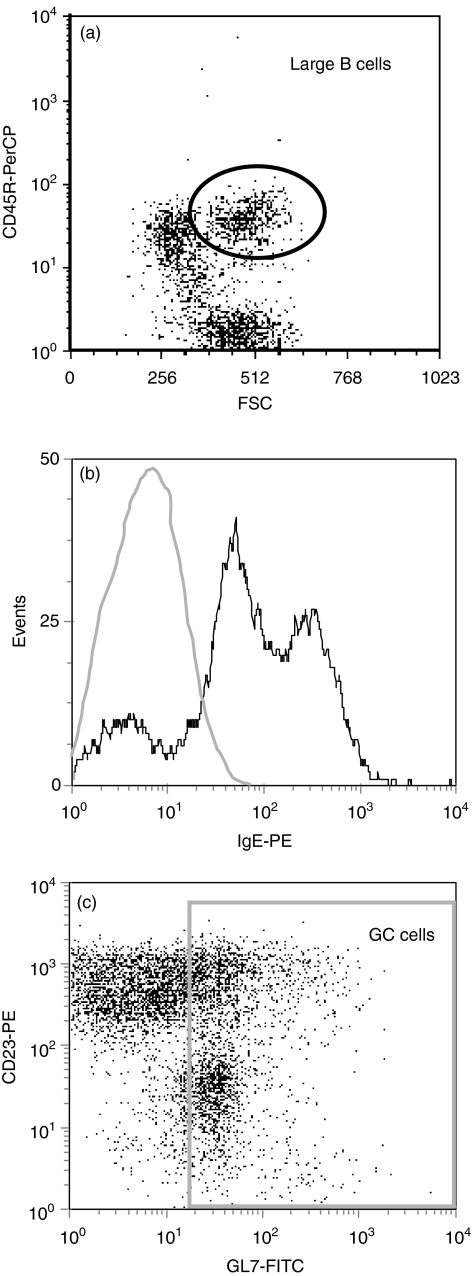
Figure 4.
Flow cytometry analysis of IgE expression on GC B cells. Brachial lymph nodes were harvested on day 11 after phOx-BSA injection and single cell suspensions were stained for flow cytometric analysis. (a) Large B cells were identified based on CD45R (B220) expression and high forward-angle light scatter (channel > 384). (b) Histogram showing IgE expression by GL7+ large B cells (CD45R+ cells with high forward-angle light scatter). For comparison, the staining profile to an irrelevant control antibody is indicated by the light grey line. (c) Dot plot of gated cells (large, CD45R+ B cells) showing CD23 expression on GC B cells based on GL7 (LY77) staining. Data are representative of two separate experiments.

