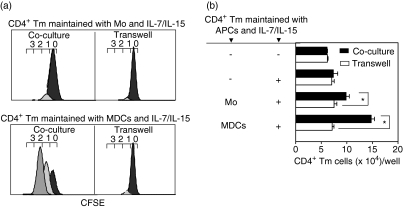
Figure 3.
The dynamics of CD4+ T memory (Tm) cell proliferation in co-culture and transwell assay. Carboxyfluorescein diacetate succinimidyl ester (CFSE)-labelled CD4+ Tm cells were cultured in the presence of interleukin (IL)-7/IL-15 and in contact with monocytes or myeloid dendritic cells (MDCs) (co-culture assay) or separated from monocytes or MDCs (transwell assay) for 7 days. Cultured cells were labelled with anti-CD3-phycoerythrin (PE), CD11c-allophycocyanin and CD45-peridinin-chorophyll-protein (PerCp) monoclonal antibodies (mAbs) and analysed by flow cytometry. Regions R1, R2 and R3 were created to define live CD45+ cells, CD3+ T cells or TruCOUNTTM beads, respectively (see Fig. 1). (a) Histograms show the fluorescence profile of CFSE-labelled CD3+ T cells (corresponding to CD4+ Tm cells). The numbers (0–3) above the histograms denote division number (see Fig. 2). (b) The absolute number of CD4+ Tm cells recovered in co-culture and transwell assay were analysed by TruCOUNTTM assay (see Fig. 1). Data are displayed as the total number of CD3+ T cells/well [corresponding to CD4+ Tm cells/well; mean ± standard error of the mean (SEM) for triplicate measurements] of one representative experiment of four. APCs, antigen-presenting cells; Mo, monocytes.

