Abstract
Monocytes constitute 5–10% of total human peripheral blood leucocytes and remain in circulation for several days before replenishing the tissue macrophage populations. Monocytes display heterogeneity in size, granularity and nuclear morphology, and in the expression of cell membrane molecules, such as CD14, CD16, CD32, CD64, major histocompatibility complex class II, CCR2, CCR5, among others. This has led to the suggestion that individual monocyte/macrophage populations have specialized functions within their microenvironments. This study provides evidence for the occurrence of two peripheral blood monocyte subpopulations on the basis of their differential expression of GM1, a sphingolipid found mostly in lipid rafts, a CD14+ GM1low population and a CD14+ GM1high population comprising about 97·5% and 2·5% of total CD14+ cells, respectively. GM1 expression correlates with functional differences in terms of endocytic activity, susceptibility to mycobacterial infection, and response to lipopolysaccharide (LPS) (modulation of Toll-like receptor-4 expression). CD14+ GM1low cells proved to be less endocytic and more responsive to LPS, whereas CD14+ GM1high cells are more endocytic and less responsive to LPS. In addition, during monocyte to macrophage differentiation in vitro, the percentage of CD14+ GM1high cells increases from about 2·5% at day 1 to more than 50% at day 7 of culture. These results suggest that GM1low and GM1high monocytes in peripheral blood, represent either different stages of maturation or different subsets with specialized activities. The expression of CD16 on GM1high favours the first possibility and, on the other hand that up-regulation of GM1 expression and probably lipid rafts function is involved in the monocyte to macrophage differentiation process.
Keywords: monocytes, macrophages, lipid rafts, endocytosis, TLR4
Introduction
Monocyte/macrophages are crucial for immune and inflammatory responses and are involved in the scavenging of dying cells, pathogens, and molecules through phagocytosis and endocytosis, and the use of pattern recognition receptors.1
Peripheral blood monocytes derive from bone marrow precursors and migrate into tissues, where differentiation into functionally distinct macrophages takes place.2 Monocytes were identified initially by their expression of large amounts of CD14. Further characterization allowed monocytes to be divided into two subsets; CD14high CD16– cells, also referred to as classic monocytes because of the fact that this phenotype corresponds to the original description of monocytes, and CD14+ CD16+ cells.3 It is now clear that monocytes are very heterogeneous and other subpopulations have been identified on the basis of physical, functional and surface marker criteria.2,4 The CD14high CD16– subpopulation represents approximately 90% of peripheral blood monocytes, whereas the expression of CD14, CD16 and CD64 defines a CD64– subpopulation comprising less than 10% of total monocytes.3,5 CD14+ CD16+ monocytes express greater amounts of major histocompatibi.lity complex (MHC) class II and CD32 (FcγRII), and resemble mature tissue macrophages.6 A subpopulation known as FcγRI has also been described.7 Expression of chemokine receptors such as CCR2 and CCR5 defines phenotypic differences among monocytes.8 A small percentage of human monocytes can enter the cell-cycle in response to monocyte colony-stimulating factor (M-CSF) and granulocyte–macrophage colony-stimulating factor (GM-CSF) in vitro9 and these are characterized by a relatively high expression of CD64 and CD33 and a low expression of CD13.4
Interestingly, distinct subpopulations of human peripheral blood monocytes give rise to dendritic cells with different biological activities10 suggesting monocyte specialization.
Lipid rafts have been found in a great variety of mammalian cells, including macrophages11 and have been shown to participate in the cell internalization process of several pathogens.12,13 Lipid rafts are cell-membrane microdomains composed of cholesterol and sphingolipids, such as GM1, that form a separate liquid-ordered phase in the liquid-disordered matrix of the cell membrane lipid bilayer.14 It is estimated that 40–70% of total plasma membrane is in the liquid-ordered phase15–17 and unbiased proteomic analyses have shown that these microdomains are enriched in cell-signalling proteins.18 GM1 is widely used as a marker of lipid rafts.14,19 Thus, by using the cholera toxin B, whose receptor is the lipid rafts constituent GM120 this work shows the occurrence of two human peripheral blood monocytes: a minor subpopulation of CD14+ cells that express a relatively large amount of GM1 on their cell membrane (CD14+ GM1high), and a majority subpopulation of CD14+cells that express a relatively small amount of GM1 (CD14+ GM1low). These two subpopulations showed different endocytic activity, susceptibility to Mycobacterium bovis infection and responses to lipopolysaccharide (LPS). In addition, monocyte to macrophage differentiation in vitro increased the percentage of the CD14+ GM1high cells. Because lipid rafts have an important role as pathogen portals and as cell-signalling platforms, these findings suggest a dependence on GM1 for the biological activities of both monocyte subpopulations and the mature macrophages.
Materials and methods
Isolation of peripheral blood monocytes and in vitro differentiation
Human peripheral blood mononuclear cells were obtained from buffy coats from healthy donors. Mononuclear cells were isolated by centrifugation over a layer of Ficoll-Hypaque (Pharmacia, Upsala, Sweden). Mononuclear cells were washed three times with phosphate-buffered saline (PBS) and suspended in Dulbecco's modified Eagle's minimal essential medium (DMEM; Sigma, St. Louis MO). Cells were plated on Petri dishes (Costar) and, after 2 hr of incubation at 37° in 5% CO2 atmosphere, non-adherent cells were removed and the adherent cells were incubated overnight (1 day monocytes). For in vitro differentiation from monocytes to macrophages, adherent cells were further incubated for 1–7 days as previously described.21 Cell morphology and CD206 expression (as an assessment of monocyte to macrophage differentiation) was carried out by culturing cells over coverslips in six-well culture plates and stain them at the indicated time points with either Giemsa or Kwik-Diff solution (Shandon, Pittsburgh, PA) and with biotin-conjugated anti-CD206 monoclonal antibody (mAb; Becton-Dickinson, San Jose, CA), followed by streptavidin-fluoroscein isothiocyanate (FITC; Sigma), respectively.
Cytofluorometric analyses
Monocyte/macrophages were scraped from the Petri dishes, washed and adjusted to 1 × 10⁷ cells/ml in ice-cold 0·1% bovine serum albumin (BSA)–PBS. Then 100 µl of the cell suspension was added to 12 mm × 75 mm polystyrene tubes (Becton-Dickinson), where cells were labelled simultaneously with anti CD14–phycoerythrin (PE) mAb and cholera toxin B–FITC for 45 min at 4°, or a combination of anti-CD14–PE mAb, anti-CD16–FITC mAb and cholera toxin B–biotin followed by streptavidin–PerCp. Non-stained cells, CD14–PE, CD16–FITC, cholera toxin B–FITC, cholera toxin B–biotin followed by streptavidin–PerCp and isotype-matched immunoglobulin–PE and immunoglobulin–FITC-labelled cells were used as controls for each individual experiment. Labelled cells were analysed by flow cytometry (FACScan; Becton-Dickinson) and CellQuest Plus software (Becton-Dickinson).
Rhodamine B isothiocyanate (RITC)–dextran uptake
One-day monocytes grown in six-well plates were incubated with 1 mg/ml of RITC–dextran (73 000 MW; Sigma) for 20 min at 4° or at 37°. Cells were washed three times with ice-cold 0·1% BSA, 0·01% NaN3 PBS and labelled with cholera toxin B–FITC for 45 min at 4°. Endocytosis was expressed as the mean fluorescence intensity (MFI) at 4° and 37° and as the change in mean fluorescence intensity (ΔMFI) between cell samples incubated at 4° and 37°.
Mycobacterium bovis bacille Calemtte–Guérin (BCG) in vitro infection
Mycobacterium bovis BCG grown in 7H9 medium (kindly provided by Dr Oscar Rojas-Espinosa) was stirred for 1 hr in order to disrupt bacterial clumps. Bacterial clumps were allowed to sediment for 5 min and the supernatant containing unaggregated bacteria were labelled with PKH-26 (Sigma) as previously described.13 Briefly, 1 × 10⁸ bacteria were washed with PBS, pH 7·4, and the cell pellet was dissolved in 300 µl of PKH-26 diluent. PKH-26 fluorochrome was diluted in a separate eppendorf tube in 300 µl of PKH-26 diluent. The bacterial suspension was added to the PKH-26-containing eppendorf tube and was gently shaken and incubated for 15 min at room temperature, after which 600 µl of fetal calf serum (FCS; Gibco, Grand Island, NY) was added and further incubated for 5 min at room temperature. The labelled bacteria were washed twice with PBS, pH 7·4, suspended in DMEM supplemented with 5% FCS and used for infection, for which 1 day monocytes, seeded on six-well microplates (Nunc, Naperville, IL) were exposed to PKH-26-labelled mycobacteria. The infected cultures were incubated for 30 min at 37° in 5% CO2 atmosphere, after which cells were washed, scraped, and fixed with 4% paraformaldehyde, fixed cells were then labelled with cholera toxin B–FITC for 45 min at 4° and then analysed by flow cytometry. Expression of GM1 was assessed in FL-1 channel and PKH-26 expression (indicative of BCG infection) in channel FL-2.
LPS-induced regulation of Toll-like receptor (TLR4) expression
One day monocytes were scraped from the Petri dishes, washed and suspended in DMEM; 2 × 10⁶ cells were plated in six-well culture plates and allowed to adhere for 2 hr. Cells were then stimulated with LPS (100 ng/ml) for 2 hr, or for 24 hr, or left unstimulated, after which cells were washed, suspended in ice-cold 0·1% BSA–PBS and stained for CD14, GM1 and TLR-4 as follows: cholera toxin B–biotin (Sigma) and mouse anti-TLR4 (Becton-Dickinson) for 45 min at 4°. After washing, cells were incubated in the presence of streptavidin–PerCp (Beckton-Dickinson) and anti-mouse immunoglobulin G (IgG)–FITC, and finally anti-CD14–PE mAb (Becton-Dickinson) for 45 min at 4°. After washing, cells were analysed in a FACScan (Becton-Dickinson) by using FL-1, FL-2 and FL-3 channels. Appropriate non-stained, and single-stained controls were used for flow cytometry compensation.
Results
Freshly isolated human peripheral blood monocytes exhibit two distinct populations based on GM1 expression
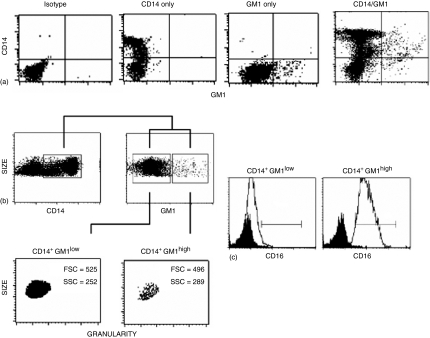
Human peripheral blood monocytes were isolated as indicated in Materials and Methods, and stained with the B subunit of cholera toxin coupled to FITC, which is known to recognize the GM1 ganglioside20 widely used as a marker of lipid rafts,14 and with anti-CD14 mAb–PE in order to electronically gate on the monocyte cell population only. In addition, in some experiments an anti-CD16 mAb–FITC was included in the staining procedure in which case, GM1 was stained with cholera toxin-biotin, followed by streptavidin–PerCp. Figure 1 shows a representative experiment out of eight (for CD14/G1) and one out of four (for CD14/G1/CD16) in which GM1 expression clearly defines two monocyte subpopulations. The CD14+ GM1low subpopulations comprises about 95·5% of total CD14+ cells, whereas the major population, CD14+ GM1high, comprises about 2·5% of total CD14+ cells. Interestingly, most (average 95%) CD14+ GM1high cells are also CD16+ whereas only a minor subpopulation of GM1low monocytes (average 5%) are CD16+.
Figure 1.
GM1 expression in freshly isolated CD14+ cells. Human peripheral blood mononuclear cells were obtained from buffy coats. After washing, cells were stained and FACS analysed for expression of both CD14 (anti human CD14-PE MAb) and GM1 (cholera toxin B subunit-FITC) in the region corresponding to monocytes. (a) Representative experiment out of 12 showing isotype control, CD14 staining only, GM1 staining only, and staining for both markers. (b) From the double stained cells showed in (a), a dot plot depicting size and CD14 expression was constructed, cells in the square are CD14+. From this region (CD14+ cells), another dot plot depicting size and GM1 expression was constructed. Two cell populations are shown (GM1low and GM1high). In trying to look for morphological differences between these two populations, FSC (Size) and SSC (Granularity) were assessed on both GM1low and GM1high CD14+ cells. (c) CD16 expression in the CD14+ GM1low and CD14+ GM1high monocyte subpopulations. Isotype control in black and CD16 expression in white. The average percentage of CD16+ cells is 5% and 95% for GM1low and GM1high monocytes, respectively (n = 4).
CD14+ GM1high monocytes have a higher endocytic activity than CD14+ GM1low monocytes
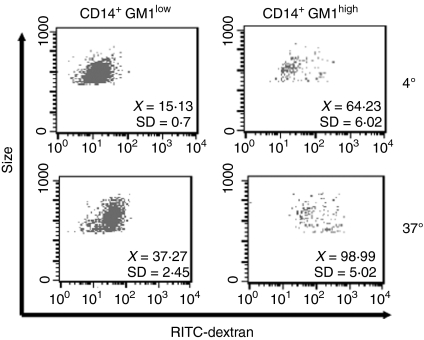
Following the observation that GM1 expression defines two subpopulations of CD14+ cells, we investigated whether those cells also present differences in biological activity. Accordingly, endocytic activity was assessed by dextran uptake assays. Figure 2 shows a representative experiment out of six, along with the MFI and standard deviation values (upper right corner), in which CD14+ GM1high monocytes present a higher endocytic activity (MFI at 37° = 98·99, SD = 5·02; ΔMFI = 34·76 SD = 11·03) than CD14+ GM1low cells (MFI at 37° =37·27, SD = 2·45; ΔMFI = 22·13, SD = 3·02).
Figure 2.
Endocytic activity of CD14+ GM1high and CD14+ GM1low human monocytes. Endocytic activity was assessed by exposure of monocytes to 1 mg/ml of RITC–dextran (73 000 MW) for 30 min at 4° or 37°. Dot plots indicate dextran uptake (FL-2) versus GM1 expression (FL-1) from the gate corresponding to monocytes. The MFI and the standard deviation is shown in each case (n = 6). CD14+ GM1high monocytes have a higher endocytic activity (ΔMFI = 34·76, SD = 11·03) as compared to CD14+ GM1low cells (ΔMFI = 22·13, SD = 3·02).
CD14+ GM1high monocytes are more susceptible to infection with Mycobacterium bovis BCG than CD14+ GM1low monocytes
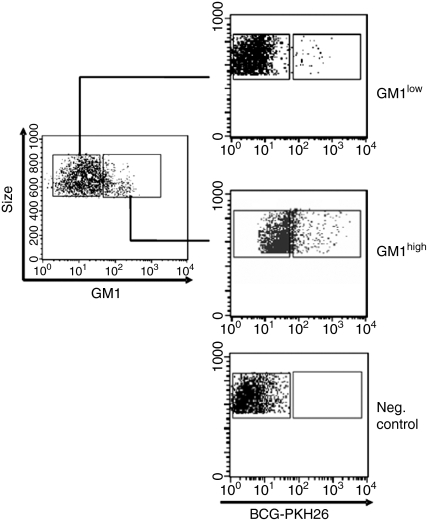
In addition to dextran uptake as a measure of endocytic activity, the susceptibility of GM1low and GM1high monocyte subpopulation to infection with bacteria was also evaluated. Mycobacterium bovis BCG was chosen because it has previously been shown that mycobacterial infections are dependent on lipid rafts13,22 and also because BCG is a mycobacterial strain used as a vaccine for a deadly disease (tuberculosis). Figure 3 and Table 1 show that CD14+ GM1high monocytes are more susceptible to infection with BCG than CD14+ GM1low monocytes, as indicated for both the percentage of infected cells and the mean fluorescence intensity, in monocytes exposed to PKH-26 labelled mycobacteria.
Figure 3.
Infection of CD14+ GM1high and CD14+ GM1low human monocytes by Mycobacterium bovis BCG. Human monocytes were cultured in the presence of PKH-26-labelled BCG for 30 min at 37°, after which, cells were washed, scraped out from the culture dishes, fixed with 4% paraformaldehyde–PBS and FACS analysed. Dot plots are from a representative experiment out of four.
Table 1.
Infection of GM1low and GM1high monocytes with Mycobacterium bovis BCG
| GM1low | GM1high | |||
|---|---|---|---|---|
| Experiment | BCG+ (%) | MFI | BCG+ (%) | MFI |
| 1 | 1·54 | 255 | 13·83 | 267 |
| 2 | 2·35 | 217 | 15·28 | 308 |
| 3 | 4·08 | 258 | 19·72 | 315 |
| 4 | 2·04 | 250 | 13·97 | 337 |
| Mean | 2·5 | 245 | 15·7 | 306 |
| SD | 0·55 | 14 | 1·14 | 20·25 |
Day 1 monocytes were infected with PKH26-labelled M. bovis BCG and stained for CD14 and GM1. Both percentage of infected cells and MFI in each population are shown for four independent experiments, along with mean and standard deviations.
LPS stimulation induces differential expression of TLR4 in CD14+ GM1low and CD14+ GM1high monocytes
Freshly isolated monocytes are readily activated by LPS through a signalling complex that involves TLR4. In order to identify possible signalling differences between the CD14+ GM1low and CD14+ GM1high subpopulations, we analysed the expression of TLR4 following LPS stimulation.
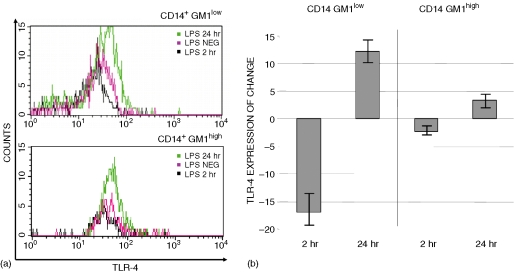
Down-regulation, followed by up-regulation of TLR4 cell-surface expression was observed at 2 hr and at 24 hr poststimulation in both CD14+ GM1low and CD14+ GM1high cells. However, changes in the expression of TLR4 following LPS stimulation were more evident in CD14+ GM1low cells than in CD14+ GM1high cells. Figure 4(a) shows a representative experiment of TLR4 expression (n = 6), and Fig. 4(b) shows the TLR4 expression referred to as the average percentage of change over the basal TLR4 expression label. It can be observed that in CD14+ GM1low monocytes, the average TLR4 down-regulation (at 2 hr) and the corresponding up-regulation (at 24 hr) are more than twice the observed changes in CD14+ GM1high cells.
Figure 4.
LPS-dependent modulation of TLR4 expression. Freshly isolated monocytes were left un-activated or activated with LPS (100 ng/ml) for 2 hr and 24 hr, and stained for TLR4 (FITC, FL-1), CD14 (PE, FL-2) and GM1 (PerCp, FL-3). After electronic gating on CD14+ GM1low and CD14+ GM1high cells, the expression of TLR4 was assessed. (a) Representative overlay histograms for TLR4 expression in each subpopulation and culture condition. (b) Average percentage change and the standard deviations in the TLR4 expression after LPS stimulation calculated as percentage ΔMFI = (MFILPS/mfimedium) × 100. Results are from eight independent experiments.
Monocyte to macrophage differentiation in vitro increases the percentage of CD14+ GM1high cells
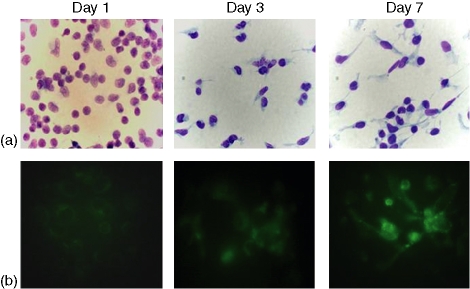
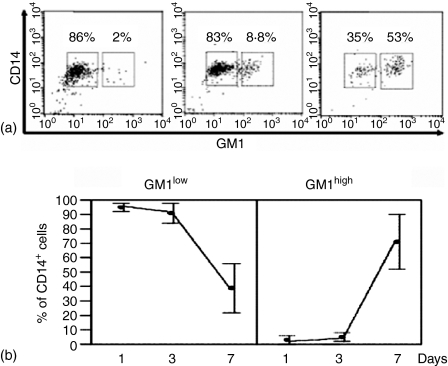
In order to investigate whether differentiating macrophages regulate GM1 expression in vitro, freshly isolated monocytes were cultured in vitro and, at the indicated time-points (1, 3, and 7 days), cell morphology was observed as well as the expression of CD206, as an assessment of monocyte to macrophage differentiation (Fig. 5). On the other hand, cells carefully scraped from the Petri dishes, were stained for CD14 and GM1, and FACS analysed. Figure 5 shows that, as with freshly isolated monocytes, differentiated monocytes present two subpopulations with differential expression of GM1. Interestingly, as differentiation proceeds, the percentage of the CD14+ GM1high subpopulation increases so that, by day 7 of culture more than 50% of total CD14+ cells are CD14+ GM1high. By comparison, at day 1 of culture, the CD14+ GM1high subpopulation comprises only about 2·5% of total CD14+ cells (see also Fig. 1).
Figure 5.
Morphological and phenotypical changes in the course of monocyte to macrophage in vitro differentiation. Human peripheral blood mononuclear cells were obtained from buffy coats, adherent cells were cultured at 37° on coverslips in six-well culture plates. At the indicated time-points, cells were (a) stained with either Giemsa (as for day 1) or Kwik-Diff solution (as for days 3 and 7) (for cell morphology) and (b) for CD206 (for assessment of monocyte to macrophage differentiation). Magnification 100×.
Discussion
Monocytes, macrophages and dendritic cells belong to a network of cells critical for both innate and adaptive immunity. There is growing evidence that the monocyte/macrophage lineage is phenotypically and functionally heterogeneous, which suggests fine specialization.2,4
Here, we provide evidence for the identification of two subsets in freshly isolated human peripheral blood monocytes on the basis of their differential expression of the ganglioside GM1, a main component and marker of lipid rafts.14 Lipid rafts are envisaged as islands of highly ordered saturated lipids (such as GM1) and cholesterol that are laterally mobile in the plane of a more fluid disordered bilayer of largely unsaturated lipids.14,19 GM1 functions as the receptor for the B subunit of cholera toxin20 and there is a clear lipid raft-dependence for the internalization of cholera toxin, leading to toxicity.23 Lipid rafts have other important biological functions, such as pathogen internalization12,24 and cell signalling.25–27 The functioning of lipid rafts depends on their constituents.28 In fact, cholesterol depletion from cell membranes causes a loss of pathogen invasion,13,22,29 BCR signalling,29,30 TCR signalling,31 etc. Thus, the finding that a minor monocyte subpopulation (2·5% of total CD14+ cells) express a relatively large amount of GM1, whereas most freshly isolated human monocytes (97·5% of total CD14+ cells) express, by comparison, a small amount of GM1, raises several questions, such as whether those two subpopulations have specialized functions, whether that function is dependent on the GM1 content, and whether those two subpopulations represent different activation or maturation stages of monocytes.
This work shows that freshly isolated CD14+ GM1high monocytes have a higher endocytic activity (dextran uptake), as well as a higher susceptibility to infection with Mycobacterium bovis BCG than CD14+ GM1low monocytes. Accordingly, the majority of peripheral blood monocytes (about 97·5%) have a low endocytic activity, which is in keeping with a previous finding in which the endocytic activity of total monocytes, macrophages and dendritic cells was compared.32 It is known that endocytosis, and mycobacterial infections are dependent on lipid rafts,13,19,22,33 thus the highly endocytic, and more susceptible to Mycobacterium bovis BCG-infection CD14+ GM1high subpopulation could represent activated/differentiating monocytes resembling macrophages. The finding that most GM1high monocytes do express CD16, whereas most GM1low monocytes are CD16– seems to further support the notion that GM1high cells are monocytic en route to a macrophage generation.6 In addition, in the RITC-Dextran uptake experiments, background fluorescence in the CD14+ GM1high cells at 4° was higher that in the CD14+ GM1low cells. A higher autofluorescence is frequently observed in macrophages as compared to other cell types.
On the other hand, the CD14+ GM1low subpopulation showed a greater response to LPS than CD14+ GM1high cells in regard to short-term down-regulation of TLR4, as shown by Husebye et al. for total monocytes.34 TLR4 is an important component of the LPS signalling cluster, along with CD14, CD55, CD11/CD18, MD-1, CXCR4, and hsp70/90,35 and has been shown to translocate into lipid rafts upon LPS stimulation in a monocyte cell line.11 Thus, it is somewhat intriguing that a monocyte subpopulation with a comparatively minor amount of the lipid raft constituent GM1 is more sensitive to LPS-mediated activation. LPS stimulation involves multiple receptors35 and the cell-surface expression of one of them, TLR4, is tightly regulated, leading to either a protective immune response or a pathological condition such as hepatic apoptosis and organ failure.36,37 If LPS-TLR4 signalling is dependent on lipid rafts, as has been reported11,35 then the finding that GM1low and GM1high monocytes have a different response to LPS implies that lipid rafts are necessary and that the relative amount of their lipid constituents (GM1 in this case) in naturally occurring cells is a determinant for cell signalling, which brings more complexity to the LPS–TLR4 system.
In any event, the most abundant monocyte subpopulation in human peripheral blood (CD14+ GM1low) is more reactive to LPS than the approximate 2·5% remaining CD14+ GM1high cells. In this regard, it may be interesting to determine whether the lateral diffusion38 of TLR4 in response to LPS is dependent on the amount of GM1. It may also be possible that GM1low and GM1high monocytes have differential activity of TLR4-signalling regulatory molecules39,40 and peripheral blood mononuclear cells seem to offer a suitable model to study this.
Finally, in the process of monocyte to macrophage differentiation in vitro (Fig. 5), the percentage of CD14+ GM1high cells increases from about 2·5% at day 1 to more than 50% by day 7 of culture (Fig. 6). To the best of our knowledge, this is the first evidence of up-regulation of GM1 expression during monocyte to macrophage differentiation. However, it has been shown that resting T cells express very low levels of the raft marker GM1, and that phytohaemagglutinin activation induces both the synthesis and the mobilization of GM1 from intracellular stores to the cell membrane, so that activated cells (3 days after PHA activation) express very high levels of GM1.41 So, it is likely that, on the one hand, the CD14+ GM1high peripheral blood monocytes that comprise only about 2·5% of total CD14+ cells represent activated/differentiating cells in healthy individuals, and, on the other, that macrophages require a greater amount of GM1 on their cell membrane to achieve their specialized functions. The percentage, functioning and biological role of CD14+ GM1low and CD14+ GM1high subpopulations in pathological conditions remain to be determined.
Figure 6.
GM1 expression in the course of monocyte to macrophage in vitro differentiation. Human peripheral blood mononuclear cells were obtained from buffy coats, adherent cells were cultured at 37° in six-well culture plates. At the indicated time-points, cells were scraped from the tissue-culture plates and FACS analysed for expression of both CD14 (anti CD14–PE mAb) and GM1 (cholera toxin B subunit–FITC). (a) Representative dot-plots experiments for days 1, 3 and 7 of culture. (b) Average percentage and standard deviations of CD14+ GM1low and CD14+ GM1high cells during in vitro differentiation (n = 8).
Acknowledgments
We thank Dr María del Carmen Maldonado-Bernal (IMSS) for helpful advice on LPS stimulation, Dr Oscar Rojas-Espinosa and Kendy Wek-Rodríguez for providing BCG, and the personnel from the INER Blood Transfusion Bank for providing buffy coats. This work was supported by CONACYT (SEP-2003-CO2-44228) and CGPI-IPN (20050399) grants. I.A.C. was supported by a CONACYT fellowship. M.M.B.M.A and F.J.S.G. are COFAA, EDI and SNI fellows.
References
- 1.Gordon S. Pattern recognition receptors. doubling up for the innate immune response. Cell. 2002;111:927–30. doi: 10.1016/s0092-8674(02)01201-1. [DOI] [PubMed] [Google Scholar]
- 2.Gordon S, Taylor PR. Monocyte and macrophage heterogeneity. Nat Rev Immunol. 2005;5:953–64. doi: 10.1038/nri1733. [DOI] [PubMed] [Google Scholar]
- 3.Passlick B, Flieger D, Ziegler-Heitbrock HW. Identification and characterization of a novel monocyte subpopulation in human peripheral blood. Blood. 1989;74:2527–34. [PubMed] [Google Scholar]
- 4.Clanchy FIL, Holloway AC, Lari R, Cameron PU, Hamilton JA. Detection and properties of the human proliferative monocyte subpopulation. J Leukoc Biol. 2006;79:757–66. doi: 10.1189/jlb.0905522. [DOI] [PubMed] [Google Scholar]
- 5.Grage-Griebenow E, Lorenzen D, Fetting R, Flad HD, Ernst M. Phenotypical and functional characterization of Fc γ receptor I (CD64) -negative monocytes, a minor human monocyte subpopulation with high accessory and antiviral activity. Eur J Immunol. 1993;23:3126–35. doi: 10.1002/eji.1830231213. [DOI] [PubMed] [Google Scholar]
- 6.Ziegler-Heitbrock HW, Fingerle G, Strobel M, Schraut W, Stelter F, Schutt C, Passlick B, Pforte A. The novel subset of CD14+/CD16+ blood monocytes exhibits features of tissue macrophages. Eur J Immunol. 1993;23:2053–8. doi: 10.1002/eji.1830230902. [DOI] [PubMed] [Google Scholar]
- 7.Grage-Griebenow E, Zawatzky R, Kahlert H, Brade L, Flad H, Ernst M. Identification of a novel dendritic cell-like subset of CD64+ CD16– blood monocytes. Eur J Immunol. 2001;31:48–56. doi: 10.1002/1521-4141(200101)31:1<48::aid-immu48>3.0.co;2-5. [DOI] [PubMed] [Google Scholar]
- 8.Weber C, Belge KU, von Hundelshausen P, Draude G, et al. Differential chemokine receptor expression and function in human monocyte subpopulations. J Leukoc Biol. 2000;67:699–704. doi: 10.1002/jlb.67.5.699. [DOI] [PubMed] [Google Scholar]
- 9.Finnin M, Hamilton JA, Moss ST. Direct comparison of the effects of CSF-1 (M-CSF) and GM-CSF on human monocyte DNA synthesis and CFS receptor expression. J Interferon Cytokine Res. 1999;19:417–23. doi: 10.1089/107999099314126. [DOI] [PubMed] [Google Scholar]
- 10.Sanchez-Torres C, Garcia-Romo GS, Cornejo-Cortez MA, Rivas-Carvalho A, Sanchez-Schmitz G. CD16+ and CD16– human blood monocyte subsets differentiate in vitro to dendritic cells with different abilities to stimulate CD4+ T cells. Int Immunol. 2001;13:1571–81. doi: 10.1093/intimm/13.12.1571. [DOI] [PubMed] [Google Scholar]
- 11.Triantafilou M, Miyake K, Golenbock DT, Triantafilou K. Mediators of innate immune recognition of bacteria concentrate in lipid rafts and facilitate lipopolysaccharide-induced cell activation. J Cell Sci. 2002;115:2603–11. doi: 10.1242/jcs.115.12.2603. [DOI] [PubMed] [Google Scholar]
- 12.Manes S, del Real G, Martinez AC. Pathogens: raft hijackers. Nat Rev Immunol. 2003;3:557–68. doi: 10.1038/nri1129. [DOI] [PubMed] [Google Scholar]
- 13.Maldonado-García G, Chico-Ortíz M, López-Marín LM, Sánchez-García FJ. High polarity M. avium-derived lipids interact with murine macrophage lipid rafts. Scand J Immunol. 2004;60:463–70. doi: 10.1111/j.0300-9475.2004.01511.x. [DOI] [PubMed] [Google Scholar]
- 14.Simons K, Ikonen E. Functional rafts in cell membranes. Nature. 1997;387:569–72. doi: 10.1038/42408. [DOI] [PubMed] [Google Scholar]
- 15.Piereini LM, Maxfield FR. Flotillas of lipid rafts fore and aft. Proc Natl Acad Sci USA. 2001;98:9471–3. doi: 10.1073/pnas.181353098. [DOI] [PMC free article] [PubMed] [Google Scholar]
- 16.Fridriksson EK, Shipkova PA, Sheets ED, Holowka D, Baird B, McLafferty FW. Quantitative analysis of phospholipids in functionally important membrane domains from RBL-2H3 mast cells using tandem high-resolution mass spectrometry. Biochemistry. 1999;38:8056–63. doi: 10.1021/bi9828324. [DOI] [PubMed] [Google Scholar]
- 17.Mayor S, Maxfield FR. Insolubility and redistribution of GPI-anchored proteins at the cell surface after detergent treatment. Mol Biol Cell. 1995;6:929–44. doi: 10.1091/mbc.6.7.929. [DOI] [PMC free article] [PubMed] [Google Scholar]
- 18.Foster LJ, De Hoog CL, Mann M. Unbiased quantitative proteomics of lipid rafts reveals high specificity for signaling factors. Proc Natl Acad Sci USA. 2003;100:5813–8. doi: 10.1073/pnas.0631608100. [DOI] [PMC free article] [PubMed] [Google Scholar]
- 19.Parton RG, Richards AA. Lipid rafts and caveolae as portals for endocytosis. new insights and common mechanisms. Traffic. 2003;4:724–38. doi: 10.1034/j.1600-0854.2003.00128.x. [DOI] [PubMed] [Google Scholar]
- 20.Holmgren J. Comparison of the tissue receptor for Vibrio cholerae and Escherichia coli endotoxins by means of gangliosides and natural choleric toxoid. Infect Immun. 1973;8:851–9. doi: 10.1128/iai.8.6.851-859.1973. [DOI] [PMC free article] [PubMed] [Google Scholar]
- 21.Moreno-Altamirano MMB, Sánchez-García FJ, Muñoz ML. Non Fc receptor-mediated infection of human macrophages by dengue virus serotype 2. J Gen Virol. 2002;83:1123–30. doi: 10.1099/0022-1317-83-5-1123. [DOI] [PubMed] [Google Scholar]
- 22.Gatfield J, Pieters J. Essential role for cholesterol in entry of mycobacteria into macrophages. Science. 2001;228:1647–50. doi: 10.1126/science.288.5471.1647. [DOI] [PubMed] [Google Scholar]
- 23.Orlandi PA, Fishman PH. Fillipin-dependent inhibition of cholera toxin: evidence for toxin internalization and activation through caveolae-like domains. J Cell Biol. 1981;141:905–15. doi: 10.1083/jcb.141.4.905. [DOI] [PMC free article] [PubMed] [Google Scholar]
- 24.Lafont F, van der Goot FG. Bacterial invasion via lipid rafts. Cell Microbiol. 2005;7:613–20. doi: 10.1111/j.1462-5822.2005.00515.x. [DOI] [PubMed] [Google Scholar]
- 25.Simons K, Toomre D. Lipid rafts and signal transduction. Nat Rev Mol Cell Biol. 2000;1:31–9. doi: 10.1038/35036052. [DOI] [PubMed] [Google Scholar]
- 26.Harder T. Lipid raft domains and protein networks in T-cell receptor signal transduction. Curr Opin Immunol. 2004;16:353–9. doi: 10.1016/j.coi.2004.03.013. [DOI] [PubMed] [Google Scholar]
- 27.Kabouridis PS. Lipid rafts in T cell receptor signaling. Mol Membr Biol. 2006;23:49–57. doi: 10.1080/09687860500453673. [DOI] [PMC free article] [PubMed] [Google Scholar]
- 28.Goluszco P, Nowicki B. Membrane cholesterol: a crucial molecule affecting interactions of microbial pathogens with mammalian cells. Infect Immun. 2005;73:7791–6. doi: 10.1128/IAI.73.12.7791-7796.2005. [DOI] [PMC free article] [PubMed] [Google Scholar]
- 29.Seveau S, Birne H, Giroux S, Prevost MC, Cossart P. Role of lipid rafts im E-cadherin- and HGF-R/Met-mediated entry of Listeria monocytogenes into host cells. J Cell Biol. 2004;166:743–53. doi: 10.1083/jcb.200406078. [DOI] [PMC free article] [PubMed] [Google Scholar]
- 30.Dykstra M, Cherukuri A, Won Sohn H, Tzeng S-J, Pierce SK. Location is everything: lipid rafts and immune cell signaling. Annu Rev Immunol. 2003;21:457–81. doi: 10.1146/annurev.immunol.21.120601.141021. [DOI] [PubMed] [Google Scholar]
- 31.Kabouridis PS, Janzen J, Magee AL, Ley SC. Cholesterol depletion disrupts lipid rafts and modulates the activity of multiple signaling pathways in T lymphocytes. Eur J Immunol. 2000;30:954–63. doi: 10.1002/1521-4141(200003)30:3<954::AID-IMMU954>3.0.CO;2-Y. [DOI] [PubMed] [Google Scholar]
- 32.Kato M, Neil TK, Fearnley DB, McLellan AD, Vuckovic S, Hart DNJ. Expression of multilectin receptors and comparative FITC-dextran uptake by human dendritic cells. Int Immunol. 2000;11:1511–9. doi: 10.1093/intimm/12.11.1511. [DOI] [PubMed] [Google Scholar]
- 33.Pelkmans L. Secrets of caveolae- and lipid raft-mediated endocytosis revealed by mammalian viruses. Biochim Biophys Acta. 2005;1746:295–304. doi: 10.1016/j.bbamcr.2005.06.009. [DOI] [PubMed] [Google Scholar]
- 34.Husebye H, Halaas O, Stenmark H, et al. Endocytic pathways regulate toll-like receptor 4 signaling and link innate and adaptive immunity. EMBO J. 2006;25:685–92. doi: 10.1038/sj.emboj.7600991. [DOI] [PMC free article] [PubMed] [Google Scholar]
- 35.Triantafilou M, Triantafilou K. The dynamics of LPS recognition: complex orchestration of multiple receptors. J Endotoxin Res. 2005;11:5–11. doi: 10.1179/096805105225006641. [DOI] [PubMed] [Google Scholar]
- 36.Liew FY, Xu D, Brini EK, O'Neill LAJ. Negative regulation of toll-like receptor-mediated immune response. Nat Rev Immunol. 205(5):446–58. doi: 10.1038/nri1630. [DOI] [PubMed] [Google Scholar]
- 37.Jiang W, Sun R, Wei H. Tian Z. Toll-like receptor 3 ligand attenuates LPS-induced liver injury by down-regulation of toll-like receptor 4 expression on macrophages. Proc Natl Acad Sci USA. 2005;102:17077–82. doi: 10.1073/pnas.0504570102. [DOI] [PMC free article] [PubMed] [Google Scholar]
- 38.Triantafilou M, Morath S, Mackie A, Hartung T, Triantafilou K. Lateral diffusion of toll-like receptors reveals that they are transiently confined within lipid rafts on the plasma membrane. J Cell Sci. 2004;117:4007–14. doi: 10.1242/jcs.01270. [DOI] [PubMed] [Google Scholar]
- 39.Salojin KV, Owusu IB, Millerchip KA, Potter M, Platt KA, Oravecz T. Essential role of MAPK phosphatease-1 in the negative control of innate immune responses. J Immunol. 2006;176:1899–907. doi: 10.4049/jimmunol.176.3.1899. [DOI] [PubMed] [Google Scholar]
- 40.Sekine Y, Yumioka T, Yamamoto T, et al. Modulation of TLR4 signaling by a novel adaptor protein signal-transducing adaptor protein-2 in macrophages. J Immunol. 2006;176:380–9. doi: 10.4049/jimmunol.176.1.380. [DOI] [PubMed] [Google Scholar]
- 41.Tousto L, Parolini I, Schroder S, Sargiacomo M, Lanzavecchia A, Viola A. Organization of plasma membrane functional rafts upon T cell activation. Eur J Immunol. 2001;31:345–9. doi: 10.1002/1521-4141(200102)31:2<345::aid-immu345>3.0.co;2-l. [DOI] [PubMed] [Google Scholar]


