

Abstract
It is clear that regulatory T cells (Treg) have an important role in preventing autoimmunity and modulating responses to pathogens. Full characterization of Treg cell function in human patients would be greatly facilitated by practical methods for expanding Treg in vitro. Methods for expansion have been reported but whether expression of surface and intracellular markers associated with freshly isolated Treg following expansion correlates with the maintenance of function is unclear. Our aim was to investigate the various methods of expansion and to correlate regulatory activity with expression of these markers. We show that, of the markers associated with freshly isolated Treg, only CD27 expression correlated with regulatory activity and could be used to isolate cells with regulatory activity from lines expanded from CD4+ CD25+ cells. Also, cells expressing high levels of the transcription factor forkhead box P3 (Foxp3) were confined to the CD27+ population within these lines. Expression of CD27 by cells in lines expanded from CD4+ CD25– cells varied depending on the stimulus used for expansion, but these lines did not have significant regulatory activity even when the CD27+ cells were tested. Analysis of synovial CD4+ CD25+ cells from reactive arthritis patients revealed that they were predominantly CD27 positive. This also applied to CD25high and CD25intermediate CD4+ cells, despite their reported different abilities to regulate. We conclude that, whilst CD27 is useful for identifying Treg in the cell lines obtained after expansion of CD4+ CD25+ cells, its expression may not reliably identify the Treg cell population in other T-cell populations such as those found in joints.
Keywords: regulatory T cells, anergy/suppression/tolerance, arthritis (including rheumatoid arthritis), human studies, phenotype/cell markers
Introduction
There are a number of different mechanisms through which self tolerance is achieved, and in recent years the discovery of T cells with regulatory properties has attracted much attention. These cells are CD4+ and express high levels of the high-affinity interleukin (IL)-2 receptor, CD25; this CD4+ CD25+ subset [commonly referred to as ‘regulatory T cells’ (Treg)1] is produced in the thymus, is critically dependent on the expression of the transcription factor forkhead box P3 (Foxp3)2–4 and has been shown to be important in preventing or ameliorating a number of animal models of autoimmune disease.5–9 In humans, it has been shown that imbalances in this subset are present in various autoimmune diseases.10 Recently, a role for Treg in controlling responses to infectious agents has also been demonstrated,11–15 with findings including evidence that some pathogens elicit Treg responses to inhibit beneficial T-cell responses.16,17 Naturally occurring, thymically derived Treg can be distinguished from other CD4+Treg subsets, such as regulatory T-cell type 1 (Tr1) and T helper type 3 (Th3) cells, in that the latter can be induced in vitro from CD4+ CD25– cells lacking regulatory activity.18,19
The dependence on Foxp3 for both development and function of Treg has lead to Foxp3 being considered the only truly specific marker of Treg. A more detailed examination of CD25 as a marker of Treg has shown that it is the cells with the highest expression of CD25 (CD4+ CD25high; reference20) that are the most potent regulatory cells; these also express cytotoxic T lymphocyte-associated antigen 4 (CTLA-4),21–25 CD45RO,21,25 CCR426 and CD28.21 However, none of these markers are specific for Treg, as they are also present on activated T cells. There is also evidence that in humans even Foxp3 is transiently expressed in activated T cells27 and may be expressed on Th3 cells.28–30 Thus there is still a need to find markers that could be used to identify Treg in cell populations where activated or effector T cells are also likely to be present.
The low numbers of Treg in peripheral blood (PB) and inflamed tissues [5–10% of CD4+ cells in human peripheral blood mononuclear cells (PBMC)] impose limits on the functional studies that can be performed. This is particularly true when dealing with patient populations, and therefore methods for expanding Treg in vitro have been investigated.22,25,31–34 Whilst methods vary, they often involve stimulation of the T-cell receptor (TCR) using anti-CD3 monoclonal antibodies, costimulation in the form of either anti-CD28 monoclonal antibodies or accessory cells, and cytokines acting through the IL-2 receptor alpha (IL-2Rγ) chain.22,25,31 Recently, stimulation through the TCR and costimulation have been achieved together using magnetic beads (dynabeads) coated with monoclonal antibodies to CD3 and CD28.32,33 There is also a report of expansion of human Treg using stimulation with alloantigens.34
When Treg are expanded in vitro from starting populations, which are rarely homogeneous, there is a need to distinguish between activated T cells and expanded Treg within the polyclonal T-cell lines. It has previously been suggested that Treg within such lines express high levels of CD25, intracellular CTLA-4, CD27 and CD62L,22,25,31–34 whereas lines expanded from CD4+ CD25– cells contain lower levels of these markers and display no regulatory activity and therefore are unlikely to contain large numbers of Treg. If this is true, it would enable the purification of Treg from cell lines expanded in vitro and might also serve to identify Treg in T-cell populations at sites of disease. Thus, a recent study used CD27 to purify Treg from the synovial fluid of patients with juvenile idiopathic arthritis.35
In this study we have investigated various methods of expansion of Treg and have correlated regulatory activity in the resulting T-cell lines with expression of surface and intracellular markers, with the aim of being able to discriminate between effector cells and Treg. We show that, after expansion of CD4+ CD25+ cells, only CD27 expression correlated with regulatory activity, and expression of CD27 could be used to purify Treg from the cell lines expanded from CD4+ CD25+ cells. The highest levels of Foxp3 expression were also found in these CD27+ cells. However, CD27 expression was not confined to Treg, because CD27 was also expressed by cells in lines derived from CD4+ CD25– cells; these cells and the lines derived from them lacked regulatory activity. Similarly, whilst CD27 expression was seen in T-cell populations present in inflamed joints, it was not confined to Treg, and could not therefore be used reliably to purify the Treg population from such cells.
Materials and methods
Culture medium
Cell cultures were carried out in complete RPMI medium (Gibco/Invitrogen, Paisley, UK) containing 5% human serum, 20 mm Hepes buffer (Sigma-Aldrich, Poole, UK), non-essential amino acids (Sigma-Aldrich), sodium pyruvate (Sigma-Aldrich), 2 mm l-glutamine (Sigma-Aldrich), 100 units/ml penicillin and 100 µg/ml streptomycin (Invitrogen, Paisley, UK).
Antibodies and flow cytometry
For surface immunostaining, phycoerythrin (PE)-conjugated antibodies (Abs) to the following surface markers were used: CD25 (Miltenyi Biotech, Bisley, UK; clone 4E3), CD62L (BD PharMingen, Cowley, UK; clone DREG-56), CCR4 (BD PharMingen; clone 1G1), CCR7 (R & D Systems, Abington, UK; clone 150503), and CD27 (BD PharMingen; clone M-T271). Fluorescein isothiocyanate (FITC)-conjugated Abs were used against CD27 (BD PharMingen; clone M-T271), TCRαß (BD Biosciences, Cowley, UK; clone WT31) and CD8 (Dako, Ely, UK; clone DK25). Allophycocyanin-conjugated Abs were also employed against CD4 (BD PharMingen; clone RPA-T4), CD8 (BD PharMingen; clone RPA-T8), CD28 (BD PharMingen; clone CD28·2), CD25 (BD PharMingen; clone M-A251) and CD45RO (BD PharMingen; clone UCHL1). Finally, peridinin chlorophyll protein (PerCP) (BD Biosciences) conjugated Abs against CD4 and CD8 (clones SK3 and SK1, respectively) were also used. For staining of intracellular proteins, PE-conjugated Abs against Foxp3 (eBioscience/Insight, Wembley, UK; clone PCH101) and CTLA-4 (BD PharMingen; clone BNI3) were used. In all cases, respective mouse and rat isotype control antibodies were employed.
For intracellular labelling of CTLA-4, cells were first stained with Abs against surface antigens, then fixed and permeabilized using Perm/Fix solution (BD PharMingen). The cells were then washed in Perm/wash buffer (BD PharMingen) and stained with antibodies against CTLA-4. Intracellular staining for Foxp3 was performed in the same manner with the following exceptions, in accordance with the manufacturer's instructions: fixation and permeabilization were performed using Perm/Fix solution from eBioscience. Two rounds of cell washes with permeabilization buffer (eBioscience) were employed before and after intracellular labelling, and finally the cells were blocked prior to staining for Foxp3 using rat serum. Cell staining was analysed on a FACalibur (BD Biosciences) flow cytometer and analysis was performed using CELLQuest (BD Biosciences) and winmdi software (The Scripps Institute, La Jolla, CA).
Cell isolation and expansion
PBMC and synovial fluid mononuclear cells (SFMC) were isolated by density gradient centrifugation using Ficoll-Paque Plus (Amersham Bioscience/GE Healthcare, Little Chalfont, UK). CD4+ CD25+ cells and CD4+ CD25– cells were isolated from healthy donors using the CD4+ CD25+ regulatory T-cell isolation kit supplied by Miltenyi Biotech and the manufacturer's directions. In brief, CD4+ cells were isolated by negative selection; the cells were labelled with biotin-conjugated Abs for human CD8, CD14, CD16, CD19, CD36, CD56, CD123, TCRγδ and glycophorin A. The cells were then labelled with antibiotin microbeads and depleted of CD4– cells using magnetic antibody cell sorting (MACS) magnetic columns. CD25+ cells and CD25– cells were then collected by labelling with a microbead conjugated with Ab against CD25 followed by positive and negative selection on MACS columns. On one occasion, the regulatory T-cell isolation kit supplied by R & D Systems was employed, which uses the same principle. The isolation was performed using MACS magnetic columns as instructed by the manufacturer.
Purified CD4+ CD25+ cells and CD4+ CD25– cells were expanded as T-cell lines for 2–8 weeks. 1 × 10⁵ or 5 × 10⁴ cells were expanded in 0·2-ml ‘U’ wells with a range of stimuli as follows.
500 U/ml tuberculin purified protein derivative (PPD; Evans Vaccines Ltd, Liverpool, UK) plus 1 × 10⁵ autologous irradiated PBMC plus 100–300 U/ml IL-2 (Chiron, Cranford, UK), added either immediately or after 3 days.
1 × 10⁴ or 1 × 10⁵ anti-CD3/CD28 dynabeads (Invitrogen) and 100 U/ml IL-2 in the presence and absence or irradiated autologous CD4+ CD25– cells.
10 µg/ml plate-bound anti-CD3 Ab (purified Ab; clone UCHT1), 2 µg/ml CD28 Ab (BD PharMingen; clone CD28·2) and 100 U/ml IL-2.
In all cases, cells were maintained with 50 U/ml IL-2 every 3–4 days, subculturing as required and ensuring that no cells remained in contact with plate-bound anti-CD3 for more than 14 days. If re-stimulation was required, either with PPD or with plate-bound anti-CD3, anti-CD28 and IL-2, the cells were collected at 14 days, washed and returned to culture in 96 ‘U’ wells for re-application of stimuli. CD27+ and CD27– cells were positively and negatively selected from expanded cell lines either by labelling CD27+ cells with FITC-conjugated anti-CD27 Ab (BD PharMingen), followed by labelling with a microbead conjugated with Ab against FITC (Miltenyi Biotech), or by labelling them with an Ab to CD27 directly conjugated to microbeads (Miltenyi Biotech). In both cases, positive and negative selection was performed using MACS columns as directed by the manufacturer.
mRNA analysis by quantitative PCR
RNA was prepared from CD4+ CD25+ and CD4+ CD25– cells freshly isolated from healthy control PBMC, CD27+ and CD27– cells isolated from CD4+ CD25+ cell-derived lines and CD27+ and CD27– cells isolated from CD4+ CD25– cell-derived lines using the Qiagen RNeasy Mini Kit (Qiagen, Crawley, UK). RNA was also extracted from a Foxp3+ CD8+ T-cell clone36 using the High Pure RNA isolation kit from Roche (Mannheim, Germany). Real-time polymerase chain reactions (PCRs) were performed as described previously,36 with the exception that 600 nm of each Foxp3 or hypoxanthine phosphoribosyl-transferase (HPRT) primer was used. The amplifications were quantified by using the Foxp3+ CD8+ T-cell clone to standardize the PCR using RNA templates of 200, 60, 12, 2·4, 0·48 and 0·096 ng of RNA. Ratios of Foxp3 to HPRT were established using duplicate PCRs.
Proliferation assays
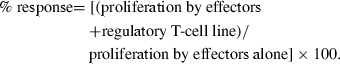
To assess the regulatory activity of freshly isolated CD4+ CD25+ cells, 5 × 10⁴ CD4+ CD25+ cells and varying numbers of CD4+ CD25– cells were cultured either separately or together at the cell ratios indicated, in 96 ‘U’ wells (200 µl), together with 1 × 10⁵ irradiated PBMC and soluble 1 µg/ml anti-CD3 Ab (BD PharMingen; clone Hit3a). Proliferation was assessed after 4 days by addition of [3H]thymidine for the last 16 hr of culture. The proliferative capacity and regulatory activity of expanded T-cell lines were determined in a similar manner: 5 × 10⁴ cells from each T-cell line were incubated in the presence or absence of 5 × 10⁴ CD4+ or 1 × 10⁵ PBMC with soluble 1 µg/ml anti-CD3 Ab and 1 × 10⁵ irradiated PBMC. Proliferation was assessed by [3H]thymidine incorporation; proliferative responses to anti-CD3 Ab by T-cell lines were compared to responses by freshly isolated CD4+ CD25– cells or cryopreserved autologous PBMC (effectors). Regulatory activity was expressed as ‘% response’:
 |
Human subjects
Cryopreserved SFMC and PBMC previously obtained from 10 patients with reactive arthritis (ReA) were used; in five cases, the SFMC and PBMC samples were paired, i.e. obtained from the same patient. PBMC were also obtained from 15 healthy subjects, and used fresh as sources of CD4+ CD25+ and CD4+ CD25– cells or cryopreserved and used as controls for the study of patient SFMC and PBMC. All human studies were approved by the Addenbrooke's Hospital Local Research Ethical Committee.
Results
Purification and expansion of regulatory cells
Purification using microbeads routinely resulted in CD4+ CD25+ cell populations of ≥89% purity, with high numbers of CD25intermediate (CD25int) cells and a lower proportion of CD25high (CD25hi) cells (as defined by Cao et al.37) (Fig. 1a). Conversely, the purified CD4+ CD25– population contained <1% CD25hi cells. Despite the relatively high proportion of CD25int cells, the CD4+ CD25+ cell population demonstrated high levels of regulatory activity even when it was used at a ratio of 1 : 5 relative to responding cells; a median of 80% inhibition of proliferative responses to anti-CD3 was found using a 1 : 1 ratio (n = 17; data not shown). The CD4+ CD25+ cells were expanded using various published protocols, and also by using the recall antigen PPD. It was found, however, that only immobilized anti-CD3, in conjunction with anti-CD28 and IL-2, produced lines that generally maintained regulatory activity (Fig. 1b). This stimulus produced a median 4·3-fold expansion of the CD4+ CD25+ cells. In comparison, using the same stimuli, CD4+ CD25– cells expanded 47-fold (n = 7). It should be noted that both freshly isolated CD4+ CD25+ cells and freshly isolated CD4+ CD25– cells contained high proportions of CD27+ cells (median 89% and 95% of isolated cells, respectively; n = 7) and CD62L+ cells (median 94% and 95% of isolated cells, respectively; n = 3).
Figure 1.

Isolation and expansion of regulatory T cells. (a) A representative example of CD25 expression on CD4+ cells in (i) healthy control peripheral blood mononuclear cells (PBMC), (ii) isolated CD4+ CD25– cells, and (iii) isolated CD4+ CD25+ cells. CD25 expression is subdivided as described by Cao et al.37; CD25 high (Hi) cells are defined as CD4+ cells with brighter CD25 staining than the brightest CD8+ CD25+ cells. CD25 negative (Neg) and CD25 intermediate (Int) cells are gated using isotype controls. The percentages of live cells, by forward and side scatter, in each sector are shown, with the percentages of CD4+ gated cells in each sector in brackets. Quadrants were set using isotype controls. (b) Regulatory activity of lines generated from CD4+ CD25+ cells following 2–8 weeks of expansion using: (1) PPD 100 or 300 U/ml interleukin (IL)-2 and irradiated, autologous PBMC, (2) anti-CD3/CD28 dynabeads, with or without irradiated CD4+ cells, or (3) plate-bound anti-CD3, soluble anti-CD28 and IL-2 (pαCD3/CD28), with one or two rounds of stimulation. Regulatory activity is measured as ‘percentage response’, i.e. effector cell responses to soluble anti-CD3 in the presence of expanded CD4+ CD25+ cells compared with their response when cultured alone. Median regulatory activities of lines obtained using the three different protocols are shown.
Expression of CD27 can identify cells with regulatory activity
The use of different expansion protocols resulted in the production of a large number of T-cell lines with a range of regulatory activities. It was possible, therefore, to determine whether expression of particular surface markers correlated with regulatory activity. Characterization of the cell lines for surface expression of CD27, CD62L and CD25 and intracellular expression of CTLA-4 indicated that there was a relationship between the numbers of CD27+ cells present in the CD25+ cell-derived lines and regulatory activity; the scatter plot of regulatory activity (percentage response) against percentage of CD27+ cells present could be described using an exponential curve (Fig. 2a). To achieve a linear relationship, the y-axis was logarithmically transformed. This resulted in a significant correlation (Fig. 2a; inset) such that an increasing percentage of CD27+ cells in the lines correlated with increased regulatory activity (decreasing percentage response). No such correlation was observed in cell lines expanded from CD4+ CD25– cells (Fig. 2b). The expression of CD62L did not correlate with regulatory activity in cell lines derived from either CD25+ or CD25– cells (data not shown). However, in combination with CD27, there was a relationship with regulatory activity such that increasing numbers of CD27– CD62L– cells were associated with a lack of regulatory activity in lines derived from CD4+ CD25+ cells [Spearman rank correlation r = 0·540 (95% confidence interval, 0·11 to 0·80), r2 = 0·29]. Again, no such relationship was observed with the CD25– cell-derived cell lines. Despite the well-recognized expression of CD25 and intracellular CTLA-4 on freshly isolated Treg, we found no association between expression of these markers in expanded T-cell lines and regulatory activity (data not shown).
Figure 2.

Regulatory activity is associated with high numbers of CD27+ cells. CD4+ CD25+ cells were isolated from seven healthy donors and CD4+ CD25– cells from six healthy donors and expanded to generate 20 and 23 lines, respectively, using the methods described in Fig. 1(b) In each case regulatory activity is shown as the logarithm of the ‘percentage response’, i.e. effector cell responses to soluble anti-CD3 in the presence of expanded cells compared with their response when cultured alone. (a) Scatter plot showing the correlation between regulatory activity and the proportion of CD27+ cells in lines derived from CD4+ CD25+ cells. An exponential curve fit is shown with a logarithmic transformation (inset) to achieve a linear relationship; Spearman rank correlation for log-transformed data: r = −0·819 (95% confidence interval, −0·93 to −0·58); r2 = 0·67. (b) Scatter plot showing the lack of correlation between regulatory activity and the proportion of CD27+ cells in lines derived from CD4+ CD25– cells. A logarithmic transformation of the data as used in (a) is also shown (inset).
Whilst we found no association between regulatory activity and CD27 expression in the cell lines derived from CD4+ CD25– cells, the proportion of CD27+ cells in these lines remained high throughout long-term culture. Analysis of 10 lines stimulated with anti-CD3/anti-CD28 and following one or two rounds of stimulation (2–5 weeks in culture) showed that a median of 75% of the cells remained CD27+. Interestingly, when cells were expanded using PPD and IL-2, a lower proportion of cells remained CD27+, with a median of 26% CD27+ cells after only 2 weeks in culture (n = 3).
Regulatory activity is confined to the CD27+ population in cell lines derived from CD4+ CD25+ cells
Having established that there is a strong correlation between regulatory activity and CD27 expression, we wished to determine directly whether regulatory activity did indeed reside in the CD27+ cell population. Therefore, CD27+ and CD27– cell populations were isolated from a number of T-cell lines derived from CD4+ CD25+ or CD4+ CD25– cells after 2–6 weeks of expansion (Fig. 3). CD27+ cells from the lines derived from CD25+ cells were found to be significantly less responsive to anti-CD3 than the equivalent cells isolated from cell lines derived from CD25– cells (Fig. 3a). When CD27+ and CD27– cells were isolated from CD4+ CD25+-derived T-cell lines, significant regulatory activity was found to be present in the CD27+ cells (median percentage response = 32·8; n = 8) (Fig. 3b). In contrast, neither the CD27– cells nor the unseparated cell lines showed high levels of regulatory activity (medians of 87·1% and 89·1% for CD27– cells and unseparated cells, respectively; Fig. 3b). When CD27+ cells were purified from cell lines derived from CD4+ CD25– cells their effects on proliferative response were not significantly different from those of CD27– cells or unseparated cells (Fig. 3c).
Figure 3.

The CD27+ cells in the lines derived from CD25+ cells are hyporesponsive and possess the highest regulatory activity. (a) Response to soluble anti-CD3 antibody by lines derived from CD4+ CD25+ and CD4+ CD25– cells, and from CD27+ and CD27– cells purified from these lines. Responses are expressed as a percentage of the response by autologous peripheral blood mononuclear cells (PBMC) or freshly isolated CD4+ CD25– cells tested in the same experiment. Boxes contain values falling between the 25th and 75th percentiles, with lines extending from the box indicating ranges in each subgroup. The lines within the boxes represent median values. P-values were determined by Mann–Whitney U-tests. (b, c) Regulatory activity of CD27+ cells and CD27– cells isolated from cell lines derived from CD4+ CD25+ (b) or from CD4+ CD25– cells (c), compared with the unseparated T-cell lines. Regulatory activity is expressed as described in the legend to Fig. 1(b). P-values were determined using Wilcoxon paired tests.
High levels of Foxp3 expression are confined to the cell lines derived from CD25+ cells and are expressed by CD27+ cells in those lines
Lines expanded for 2 weeks in culture using plate-bound anti-CD3 Ab, soluble anti-CD28 Ab and IL-2 were further characterized for the expression of Foxp3 by CD27+ and CD27– cells within the lines. Intracellular staining showed that Foxp3+ cells were mainly confined to the CD27+ population in cells derived from CD25+ cells (Fig. 4a), with 78% of these being Foxp3+ the CD4+ CD25+ and CD4+ CD25– cells used to generate the lines were 80% and 5% Foxp3+, respectively, before expansion (data not shown). In cell lines derived from CD25– cells, 26% of the cells were Foxp3+ as compared with 5% in the freshly isolated CD25– cells, but importantly this expression was lower than in cell lines derived from CD25+ cells [mean fluorescence intensity (MFI) 42 in CD25+ derived cells compared with 23 in CD25− derived cells]. A number of lines analysed after 2–3 weeks of expansion all showed the same trend of lower intensity of Foxp3 expression (median MFI 14·2 compared with 34·4, respectively) and lower numbers of Foxp3+ cells (median 30·7% compared with 82·2%, respectively) in the CD27+ fraction of the lines derived from CD25– cells, as compared with the CD27+ fraction in lines derived from CD25+ cells (Fig. 4b). Similarly, CD27+ cells in lines derived from CD4+ CD25+ cells expressed higher levels of Foxp3 than the CD27– cells from the same lines (data not shown). Each of the cell lines derived from CD4+ CD25– cells showed an increase in the proportion of Foxp3+ cells after 2–3 weeks in culture (from median 3% to median 32%). When Foxp3 mRNA expression was examined, CD27+ cells in a line derived from CD4+ CD25+ cells showed much higher levels of expression than CD27– cells, similar to the levels expressed by peripheral blood Treg (Fig. 4c). Consistent with the intracellular staining, which showed Foxp3 expression in 39% of cells derived from CD4+ CD25– cells, Foxp3 mRNA was detectable in these cells but was at a lower level irrespective of CD27 expression.
Figure 4.

Cell lines derived from CD4+ CD25+ cells express high levels of forkhead box P3 (Foxp3) and high numbers of Foxp3+ cells are present in the CD27+ subpopulation. (a) Flow cytometric analysis of T-cell lines derived from CD4+ CD25+ (upper) and CD4+ CD25– (lower) cells after 2 weeks of expansion with plate-bound anti-CD3, soluble anti-CD28 and interleukin (IL)-2. Cells were stained for CD25, intracellular Foxp3 and CD4. The dot plots shown are gated on CD4+ cells with quadrants set using isotype controls. The percentages of cells in each quadrant are indicated, with the mean fluorescence intensity (MFI) of Foxp3 staining given in brackets. (b) Variability of Foxp3 labelling of CD27+ cells. The figure shows labelling from (a) and three additional lines from healthy controls derived from CD4+ CD25+ cells or CD4+ CD25– cells, after expansion for 14–20 days. Upper panel: MFI of Foxp3 labelling of CD27+ cells. Lower panel: the percentages of CD27+ cells that were Foxp3+. Analyses were gated on CD4+ cells if either line was >5% CD4–. (c)Foxp3 mRNA expression by freshly isolated CD4+ CD25– and CD4+ CD25+ cells (black bars), and by CD27+ and CD27– cells isolated from expanded CD25+ (grey bars) and CD25– (open bars) cell-derived cell lines after 4 weeks in culture. Foxp3 mRNA was measured relative to hypoxanthine phosphoribosyl-transferase (HPRT) mRNA by quantitative polymerase chain reaction (PCR), standardized using a Foxp3+ CD8+ T-cell clone (see Materials and methods).
Surface and intracellular markers expressed by cell lines derived from CD4+ CD25+ and CD4– CD25– cells
Having established that CD27+ cells in lines expanded from CD25+ cells had a regulatory phenotype and expressed more Foxp3 than CD27– cells, it was important to determine what other markers of Treg they might express. Figure 5 shows that, 3 weeks after re-stimulation with anti-CD3/CD28 (5 weeks total culture), 77% of the CD27+ cells in the CD25+ cell-derived line continued to express high levels of CD25 (MFI of 208). In contrast, only 38% of the CD27+ cells in lines derived from CD4+ CD25– cells expressed CD25, and the levels were much lower (MFI of 35). Figure 5 also shows that the CD27+ cells in the line derived from CD25+ cells generally expressed CC chemokine receptor (CCR) 4 and CCR7. In contrast, whilst the CD27+ cells in the cell lines derived from CD25– cells also expressed high levels of CCR4, they expressed low levels of CCR7. Surface expression of CTLA-4 did not vary between CD27+ cells derived from CD25+ cells and those derived from CD25– cells [5% (MFI 33) and 2% (MFI 18), respectively (data not shown)]. There was, however, a difference in intracellular CTLA-4 expression; 92% of CD27+ cells in the CD25+ cell-derived line were CTLA-4+ (MFI 127) compared with 12% in the CD25– cell-derived line (MFI 50). There were no notable differences in expression of CD45RO+ and CD28+. Cells in lines derived from either CD25+ or CD25– cells generally expressed high levels of CD62L, but CD27+ cells differed in their expression of CD62L; in lines derived from CD4+ CD25– cells, ∼20% of the CD27+ cells were CD62L–, whereas 97% of the CD27+ cells in lines derived from CD25+ cells maintained CD62L expression. When CD27+ and CD27– cells were isolated from the cell lines using anti-CD27 labelled microbeads (> 98% CD27+ and <6% CD27–), those in the lines derived from CD25+ cells demonstrated significant regulatory activity (data not shown).
Figure 5.

Phenotype of T-cell lines after 5 weeks in culture. Flow cytometric analysis of CD4+ CD25+ cell-derived (upper panels) and CD4+ CD25– cell-derived (lower panels) cell lines after 5 weeks in culture and two rounds of stimulation with plate-bound anti-CD3, soluble CD28 and interleukin (IL)-2. All markers were analysed in conjunction with staining for CD27; the percentages of cells in each quadrant (set on isotype controls) are shown together with the mean fluorescence intensity (MFI) on the y-axis (brackets).
CD27 expression on CD4+ CD25+ cells in synovial fluid of ReA patients
Having established that CD27 expression was associated with regulatory activity in cell lines expanded from CD4+ CD25+ cells, it was also clear that there were high numbers of CD27+ cells present in lines derived from CD4+ CD25– cells which lacked regulatory activity. To determine the usefulness of using CD27 as a marker of Treg cell populations from a site of inflammation, we characterized SFMC from ReA patients (n = 6) for the proportions of CD27+ cells within the CD4+ CD25hi, CD4+ CD25int and CD4+ CD25– populations, and compared the results with those obtained from PBMC of ReA patients (n = 8) and healthy controls (n = 6). More than 90% of the CD4+ CD25hi cells were CD27+, in all three groups, but a high proportion of the CD4+ CD25int and CD4+ CD25– subpopulations of PBMC from both healthy controls and ReA patients were also CD27+, with no significant differences between the groups (Fig. 6). There were significantly lower proportions of CD27+ cells in CD4+ CD25int and CD4+ CD25– subpopulations in SFMC from ReA patients, but 80% of the CD4+ CD25int cells were still CD27+ (Fig. 6). As it is unlikely that 80% of each of these populations consist of Treg, CD27 does not reliably identify Treg within SFMC.
Figure 6.

A high proportion of synovial CD4+ cells are CD27+. Percentages of CD4+ CD25–, CD4+ CD25int (‘int’ denoting ‘intermediate’) and CD4+ CD25high cells (as defined by Cao et al.37) that were CD27+ in peripheral blood mononuclear cells (PBMC) from six healthy controls (HC, open boxes), PBMC from eight reactive arthritis (ReA) patients (light grey boxes) and synovial fluid mononuclear cells (SFMC) from six ReA patients (dark grey boxes). Boxes contain values falling between the 25th and 75th percentiles, with lines extending from the boxes indicating the range. The lines within the boxes represent median values. P-values were determined by Mann-Whitney U-test.
Discussion
Whilst CD25 is currently the only marker that can be used to purify functional Treg, it is an imperfect marker because it is also expressed on activated effector cells. Thus, expansion of purified CD25+ cells will inevitably result in a mixed population of CD25+ effector cells as well as CD4+ CD25+ Treg. There is therefore a need to be able to reliably identify Treg within such expanded cell lines.
Using some of the methods reported to expand freshly isolated CD4+ CD25+ human T cells we have shown that, of the markers reported to be stably expressed by Treg following activation, only CD27 could be used to identify Treg within these expanded cell lines. Thus, CD27+ cells had the highest regulatory activity, were anergic to anti-CD3 stimulation and expressed the highest levels of Foxp3. It should be noted that CD27 expression does not per seindicate that a cell has regulatory properties; CD27 is thought to be down-regulated on terminally differentiated effector cells, but our data on cell lines derived from CD4+ CD25– cells show that the extent of this down-regulation is variable. Yet, despite high CD27 expression, cells expanded from CD25– cells did not have the same phenotype as CD27+ cells from CD25+ cell-derived lines. The factors that influence down-regulation of CD27 are not clear; stimulation with the recall antigen PPD resulted in a marked decrease in the number of CD27+ cells compared with stimulation with anti-CD3/CD28. This was not a result of the presence of APC, which is required for the response to PPD, as addition of APC to anti-CD28/CD28 had no significant effect on CD27 expression. In addition, examination of Foxp3 expression revealed that, in lines derived from CD25+ cells, not all CD27+ cells were Foxp3+. This, in combination with sustained CD27 expression on non-regulatory cells, may explain why CD27 was not a reliable marker of Treg in synovial fluid from patients with active inflammatory arthritis; CD27 was expressed not only by CD25hi cells but also by high proportions of CD25int and CD25– cells. It is unlikely that the latter populations contain large proportions of Treg, so caution needs to be exercised when using CD27 as a marker of Treg in these polyclonal T-cell populations.
The transcription factor Foxp3 is still considered to be the best marker of regulatory T-cell function, although recent evidence suggests that activation induces transient Foxp3 expression in CD4+ CD25– cells.27 In our lines there were clearly higher levels of Foxp3 expression in cells derived from CD4+ CD25+ cells (particularly in CD27+ cells) than in those derived from CD4+ CD25– cells. This higher expression of Foxp3 suggests that the CD27+ regulatory cells are not Tr1 cells induced by the culture conditions as Tr1 cells are Foxp3 negative.38 A proportion of the Foxp3+ cells in the CD25– cell-derived line may be Th3 cells induced by the culture conditions; however, these cells clearly have a different phenotype from the Foxp3+ CD27+ cells expanded from CD25+ cells. Finally, stable CD25+ expression on the Foxp3+ CD27+ cells makes it unlikely that they are so-called ‘Th-suppressors’.39–41 On this basis we conclude that expansion of pre-existing Treg has been achieved rather than in vitro induction of cells with a regulatory phenotype.
What other markers might be considered useful in identifying Treg in expanded T-cell lines? Many if not all the markers that have been described to be present on Treg were also present on cells expanded from CD4+ CD25– cells. CD62L, like CD27, is present on CD4+ CD25+ and CD4+ CD25– cells from PBMC before activation and has been reported to be down-regulated on effector cells whilst remaining on expanded Treg.31–33 However, we found no association between regulatory activity and the proportions of CD62L+ cells or even the proportions of CD62L+ CD27+ cells. This is in general agreement with reports of Foxp3+ expression in both CD62L+ and CD62L– cells.42 It is unsurprising that CD45RO, whilst expressed on Treg21,25 and by our lines derived from CD25+ cells, was also expressed by cells expanded from CD25– cells; CD45RO is a marker of memory T cells and it unlikely that any naïve T cells remain after expansion. Similarly, the chemokine receptor CCR4 is present on both Treg26 and effector cells, and was expressed at high levels on cells derived from CD4+ CD25– cells. Another chemokine receptor, CCR7, was present only on CD27+ cells from the CD25+ cell-derived line; the presence of CCR7 on Treg has been inferred from their ability to respond to its ligand CCL19,26,42 and CCR7 is normally present on naïve and central memory cells43,44 being down-regulated during the course of T-cell differentiation.45 However, its usefulness as a marker of Treg at sites of disease would be abrogated by the active recruitment of CCR7+ naïve and central memory cells to sites of inflammation.
In conclusion, we have shown that many if not all the current markers of Treg are ineffective for discriminating between activated CD4+ effectors and regulatory T cells, but that stable expression of CD27 is a useful marker of Treg within cell lines derived from CD4+ CD25+ cells. However, in other T-cell lines and populations, CD27 expression is also present on non-regulatory T cells and studies that have employed CD27 expression to identify Treg in circumstances where significant numbers of activated CD4 effectors are likely to be present should be interpreted with caution. Additional reliable markers of Treg are required; during the preparation of this manuscript, CD127 has been reported to be able to distinguish between Treg and effector cells.46,47 In these studies, higher Foxp3 expression and regulatory activity were found in CD4+ CD25+ cells expressing low levels of CD127 compared with those expressing high levels of CD127. Further study is needed to characterize CD27 expression on these cells after activation and to determine whether the relationship between regulatory activity and CD127 expression is maintained in inflamed tissues.
Acknowledgments
This work was supported by the Arthritis Research Campaign. We would also like to acknowledge the support of the European Commission through the RTD project ‘HSP for Therapy’ (Project QLG1-CT-2002-01287). The authors would like to acknowledge the following people for their help with this study: Mr Roy Whiston for his technical help; Dr Jane Goodall and Dr Frances Hall for help with the QCPR and for all their constructive comments and advice; Mr Edward Carr for RNA material, and Dr Ian McFarlane (Department of Clinical Biochemistry, Addenbrooke's Hospital) for his help with RNA quality control. The authors would also like to thank Dr Lucy Wedderburn and Dr Leonie Taams for their technical advice.
Abbreviations
- Ab
antibody
- APC
antigen presenting cells
- CCR
CC chemokine receptor
- CTLA-4
cytotoxic T lymphocyte-associated antigen 4
- FITC
fluorescein isothiocyanate
- Foxp3
forkhead box P3
- HPRT
hypoxanthine phosphoribosyl-transferase
- IL
interleukin
- MFI
mean fluorescence intensity
- PBMC
peripheral blood mononuclear cells
- PCR
polymerase chain reaction
- PerCP
peridinin chlorophyll protein
- PE
phycoerythrin
- PPD
tuberculin purified protein derivative
- ReA
reactive arthritis
- SFMC
synovial fluid mononuclear cells
- TCR
T-cell receptor
- Treg
regulatory T cell
References
- 1.Sakaguchi S. Naturally arising CD4+ regulatory T cells for immunologic self-tolerance and negative control of immune responses. Annu Rev Immunol. 2004;22:531–62. doi: 10.1146/annurev.immunol.21.120601.141122. [DOI] [PubMed] [Google Scholar]
- 2.Fontenot JD, Gavin MA, Rudensky AY. Foxp3 programs the development and function of CD4+CD25+ regulatory T cells. Nat Immunol. 2003;4:330–6. doi: 10.1038/ni904. [DOI] [PubMed] [Google Scholar]
- 3.Khattri R, Cox T, Yasayko SA, Ramsdell F. An essential role for Scurfin in CD4+CD25+ T regulatory cells. Nat Immunol. 2003;4:337–42. doi: 10.1038/ni909. [DOI] [PubMed] [Google Scholar]
- 4.Hori S, Nomura T, Sakaguchi S. Control of regulatory T cell development by the transcription factor Foxp3. Science. 2003;299:1057–61. doi: 10.1126/science.1079490. [DOI] [PubMed] [Google Scholar]
- 5.Annacker O, Pimenta-Araujo R, Burlen-Defranoux O, Barbosa TC, Cumano A, Bandeira A. CD25+CD4+ T cells regulate the expansion of peripheral CD4 T cells through the production of IL-10. J Immunol. 2001;166:3008–18. doi: 10.4049/jimmunol.166.5.3008. [DOI] [PubMed] [Google Scholar]
- 6.Salomon B, Lenschow DJ, Rhee L, Ashourian N, Singh B, Sharpe A, Bluestone JA. B7/CD28 costimulation is essential for the homeostasis of the CD4+CD25+ immunoregulatory T cells that control autoimmune diabetes. Immunity. 2000;12:431–40. doi: 10.1016/s1074-7613(00)80195-8. [DOI] [PubMed] [Google Scholar]
- 7.Jaeckel E, von Boehmer H, Manns MP. Antigen-specific FoxP3-transduced T-cells can control established type 1 diabetes. Diabetes. 2005;54:306–10. doi: 10.2337/diabetes.54.2.306. [DOI] [PubMed] [Google Scholar]
- 8.Gregori S, Giarratana N, Smiroldo S, Adorini L. Dynamics of pathogenic and suppressor T cells in autoimmune diabetes development. J Immunol. 2003;171:4040–7. doi: 10.4049/jimmunol.171.8.4040. [DOI] [PubMed] [Google Scholar]
- 9.Kohm AP, Carpentier PA, Anger HA, Miller SD. Cutting edge: CD4+CD25+ regulatory T cells suppress antigen-specific autoreactive immune responses and central nervous system inflammation during active experimental autoimmune encephalomyelitis. J Immunol. 2002;169:4712–6. doi: 10.4049/jimmunol.169.9.4712. [DOI] [PubMed] [Google Scholar]
- 10.Dejaco C, Duftner C, Grubeck-Loebenstein B, Schirmer M. Imbalance of regulatory T cells in human autoimmune diseases. Immunology. 2006;117:289–300. doi: 10.1111/j.1365-2567.2005.02317.x. [DOI] [PMC free article] [PubMed] [Google Scholar]
- 11.Annacker O, Powrie F. Homeostasis of intestinal immune regulation. Microbes Infect. 2002;4:567–74. doi: 10.1016/s1286-4579(02)01574-5. [DOI] [PubMed] [Google Scholar]
- 12.Kullberg MC, Jankovic D, Gorelick PL, Caspar P, Letterio JJ, Cheever AW, Sher A. Bacteria-triggered CD4+ T regulatory cells suppress Helicobacter hepaticus-induced colitis. J Exp Med. 2002;196:505–15. doi: 10.1084/jem.20020556. [DOI] [PMC free article] [PubMed] [Google Scholar]
- 13.Maloy KJ, Salaun L, Cahill R, Dougan G, Saunders NJ, Powrie F. CD4+CD25+ TR cells suppress innate immune pathology through cytokine-dependent mechanisms. J Exp Med. 2003;197:111–9. doi: 10.1084/jem.20021345. [DOI] [PMC free article] [PubMed] [Google Scholar]
- 14.Hori S, Carvalho TL, Demengeot J. CD25+CD4+ regulatory T cells suppress CD4+ T cell-mediated pulmonary hyperinflammation driven by Pneumocystis carinii in immunodeficient mice. Eur J Immunol. 2002;32:1282–91. doi: 10.1002/1521-4141(200205)32:5<1282::AID-IMMU1282>3.0.CO;2-#. [DOI] [PubMed] [Google Scholar]
- 15.Montagnoli C, Bacci A, Bozza S, Gaziano R, Mosci P, Sharpe AH, Romani L. B7/CD28-dependent CD4+CD25+ regulatory T cells are essential components of the memory-protective immunity to Candida albicans. J Immunol. 2002;169:6298–308. doi: 10.4049/jimmunol.169.11.6298. [DOI] [PubMed] [Google Scholar]
- 16.Aseffa A, Gumy A, Launois P, MacDonald HR, Louis JA, Tacchini-Cottier F. The early IL-4 response to Leishmania major and the resulting Th2 cell maturation steering progressive disease in BALB/c mice are subject to the control of regulatory CD4+CD25+ T cells. J Immunol. 2002;169:3232–41. doi: 10.4049/jimmunol.169.6.3232. [DOI] [PubMed] [Google Scholar]
- 17.Belkaid Y, Piccirillo CA, Mendez S, Shevach EM, Sacks DL. CD4+CD25+ regulatory T cells control Leishmania major persistence and immunity. Nature. 2002;420:502–7. doi: 10.1038/nature01152. [DOI] [PubMed] [Google Scholar]
- 18.Groux H, O'Garra A, Bigler M, Rouleau M, Antonenko S, de Vries JE, Roncarolo MG. A CD4+ T-cell subset inhibits antigen-specific T-cell responses and prevents colitis. Nature. 1997;389:737–42. doi: 10.1038/39614. [DOI] [PubMed] [Google Scholar]
- 19.Weiner HL. Induction and mechanism of action of transforming growth factor-β-secreting Th3 regulatory cells. Immunol Rev. 2001;182:207–14. doi: 10.1034/j.1600-065x.2001.1820117.x. [DOI] [PubMed] [Google Scholar]
- 20.Baecher-Allan C, Brown JA, Freeman GJ, Hafler DA. CD4+CD25high regulatory cells in human peripheral blood. J Immunol. 2001;167:1245–53. doi: 10.4049/jimmunol.167.3.1245. [DOI] [PubMed] [Google Scholar]
- 21.Taams LS, Smith J, Rustin MH, Salmon M, Poulter LW, Akbar AN. Human anergic/suppressive CD4+CD25+ T cells: a highly differentiated and apoptosis-prone population. Eur J Immunol. 2001;31:1122–31. doi: 10.1002/1521-4141(200104)31:4<1122::aid-immu1122>3.0.co;2-p. [DOI] [PubMed] [Google Scholar]
- 22.Dieckmann D, Plottner H, Berchtold S, Berger T, Schuler G. Ex vivo isolation and characterization of CD4+CD25+ T cells with regulatory properties from human blood. J Exp Med. 2001;193:1303–10. doi: 10.1084/jem.193.11.1303. [DOI] [PMC free article] [PubMed] [Google Scholar]
- 23.Jonuleit H, Schmitt E, Stassen M, Tuettenberg A, Knop J, Enk AH. Identification and functional characterization of human CD4+CD25+ T cells with regulatory properties isolated from peripheral blood. J Exp Med. 2001;193:1285–94. doi: 10.1084/jem.193.11.1285. [DOI] [PMC free article] [PubMed] [Google Scholar]
- 24.Ng WF, Duggan PJ, Ponchel F, Matarese G, Lombardi G, Edwards AD, Isaacs JD, Lechler RI. Human CD4+CD25+ cells: a naturally occurring population of regulatory T cells. Blood. 2001;98:2736–44. doi: 10.1182/blood.v98.9.2736. [DOI] [PubMed] [Google Scholar]
- 25.Levings MK, Sangregorio R, Roncarolo MG. Human CD25+CD4+ T regulatory cells suppress naive and memory T cell proliferation and can be expanded in vitro without loss of function. J Exp Med. 2001;193:1295–302. doi: 10.1084/jem.193.11.1295. [DOI] [PMC free article] [PubMed] [Google Scholar]
- 26.Iellem A, Mariani M, Lang R, Recalde H, Panina-Bordignon P, Sinigaglia F, D'Ambrosio D. Unique chemotactic response profile and specific expression of chemokine receptors CCR4 and CCR8 by CD4+CD25+ regulatory T cells. J Exp Med. 2001;194:847–53. doi: 10.1084/jem.194.6.847. [DOI] [PMC free article] [PubMed] [Google Scholar]
- 27.Mantel PY, Ouaked N, Ruckert B, Karagiannidis C, Welz R, Blaser K, Schmidt-Weber CB. Molecular mechanisms underlying FOXP3 induction in human T cells. J Immunol. 2006;176:3593–602. doi: 10.4049/jimmunol.176.6.3593. [DOI] [PubMed] [Google Scholar]
- 28.Chen W, Jin W, Hardegen N, Lei KJ, Li L, Marinos N, McGrady G, Wahl SM. Conversion of peripheral CD4+CD25– naive T cells to CD4+CD25+ regulatory T cells by TGF-β induction of transcription factor Foxp3. J Exp Med. 2003;198:1875–86. doi: 10.1084/jem.20030152. [DOI] [PMC free article] [PubMed] [Google Scholar]
- 29.Zheng SG, Wang JH, Gray JD, Soucier H, Horwitz DA. Natural and induced CD4+CD25+ cells educate CD4+CD25− cells to develop suppressive activity: the role of IL-2, TGF-β, and IL-10. J Immunol. 2004;172:5213–21. doi: 10.4049/jimmunol.172.9.5213. [DOI] [PubMed] [Google Scholar]
- 30.Fantini MC, Becker C, Monteleone G, Pallone F, Galle PR, Neurath MF. Cutting edge: TGF-β induces a regulatory phenotype in CD4+CD25– T cells through Foxp3 induction and down-regulation of Smad7. J Immunol. 2004;172:5149–53. doi: 10.4049/jimmunol.172.9.5149. [DOI] [PubMed] [Google Scholar]
- 31.Hoffmann P, Eder R, Kunz-Schughart LA, Andreesen R, Edinger M. Large-scale in vitro expansion of polyclonal human CD4+CD25highregulatory T cells. Blood. 2004;104:895–903. doi: 10.1182/blood-2004-01-0086. [DOI] [PubMed] [Google Scholar]
- 32.Godfrey WR, Ge YG, Spoden DJ, Levine BL, June CH, Blazar BR, Porter SB. In vitro-expanded human CD4+CD25+ T-regulatory cells can markedly inhibit allogeneic dendritic cell-stimulated MLR cultures. Blood. 2004;104:453–61. doi: 10.1182/blood-2004-01-0151. [DOI] [PubMed] [Google Scholar]
- 33.Earle KE, Tang Q, Zhou X, Liu W, Zhu S, Bonyhadi ML, Bluestone JA. In vitro expanded human CD4+CD25+ regulatory T cells suppress effector T cell proliferation. Clin Immunol. 2005;115:3–9. doi: 10.1016/j.clim.2005.03.007. [DOI] [PMC free article] [PubMed] [Google Scholar]
- 34.Jiang S, Camara N, Lombardi G, Lechler RI. Induction of allopeptide-specific human CD4+CD25+ regulatory T cells ex vivo. Blood. 2003;102:2180–6. doi: 10.1182/blood-2003-04-1164. [DOI] [PubMed] [Google Scholar]
- 35.Ruprecht CR, Gattorno M, Ferlito F, Gregorio A, Martini A, Lanzavecchia A, Sallusto F. Coexpression of CD25 and CD27 identifies FoxP3+ regulatory T cells in inflamed synovia. J Exp Med. 2005;201:1793–803. doi: 10.1084/jem.20050085. [DOI] [PMC free article] [PubMed] [Google Scholar]
- 36.Jarvis LB, Matyszak MK, Duggleby RC, Goodall JC, Hall FC, Gaston JS. Autoreactive human peripheral blood CD8+ T cells with a regulatory phenotype and function. Eur J Immunol. 2005;35:2896–908. doi: 10.1002/eji.200526162. [DOI] [PubMed] [Google Scholar]
- 37.Cao D, van Vollenhoven R, Klareskog L, Trollmo C, Malmstrom V. CD25brightCD4+ regulatory T cells are enriched in inflamed joints of patients with chronic rheumatic disease. Arthritis Res Ther. 2004;6:R335–46. doi: 10.1186/ar1192. [DOI] [PMC free article] [PubMed] [Google Scholar]
- 38.Vieira PL, Christensen JR, Minaee S, et al. IL-10-secreting regulatory T cells do not express Foxp3 but have comparable regulatory function to naturally occurring CD4+CD25+ regulatory T cells. J Immunol. 2004;172:5986–93. doi: 10.4049/jimmunol.172.10.5986. [DOI] [PubMed] [Google Scholar]
- 39.Jonuleit H, Schmitt E, Kakirman H, Stassen M, Knop J, Enk AH. Infectious tolerance: human CD25+ regulatory T cells convey suppressor activity to conventional CD4+ T helper cells. J Exp Med. 2002;196:255–60. doi: 10.1084/jem.20020394. [DOI] [PMC free article] [PubMed] [Google Scholar]
- 40.Dieckmann D, Bruett CH, Ploettner H, Lutz MB, Schuler G. Human CD4+CD25+ regulatory, contact-dependent T cells induce interleukin 10-producing, contact-independent type 1-like regulatory T cells. J Exp Med. 2002;196:247–53. doi: 10.1084/jem.20020642. [DOI] [PMC free article] [PubMed] [Google Scholar]
- 41.Stassen M, Fondel S, Bopp T, et al. Human CD25+ regulatory T cells: two subsets defined by the integrins α4β7 or α4β1 confer distinct suppressive properties upon CD4+ T helper cells. Eur J Immunol. 2004;34:1303–11. doi: 10.1002/eji.200324656. [DOI] [PubMed] [Google Scholar]
- 42.Fu S, Yopp AC, Mao X, Chen D, Zhang N, Mao M, Ding Y, Bromberg JS. CD4+CD25+CD62+ T-regulatory cell subset has optimal suppressive and proliferative potential. Am J Transplant. 2004;4:65–78. doi: 10.1046/j.1600-6143.2003.00293.x. [DOI] [PubMed] [Google Scholar]
- 43.Forster R, Schubel A, Breitfeld D, Kremmer E, Renner-Muller I, Wolf E, Lipp M. CCR7 coordinates the primary immune response by establishing functional microenvironments in secondary lymphoid organs. Cell. 1999;99:23–33. doi: 10.1016/s0092-8674(00)80059-8. [DOI] [PubMed] [Google Scholar]
- 44.Iezzi G, Scheidegger D, Lanzavecchia A. Migration and function of antigen-primed nonpolarized T lymphocytes in vivo. J Exp Med. 2001;193:987–93. doi: 10.1084/jem.193.8.987. [DOI] [PMC free article] [PubMed] [Google Scholar]
- 45.Fritsch RD, Shen X, Sims GP, Hathcock KS, Hodes RJ, Lipsky PE. Stepwise differentiation of CD4 memory T cells defined by expression of CCR7 and CD27. J Immunol. 2005;175:6489–97. doi: 10.4049/jimmunol.175.10.6489. [DOI] [PubMed] [Google Scholar]
- 46.Seddiki N, Santner-Nanan B, Martinson J, et al. Expression of interleukin (IL)-2 and IL-7 receptors discriminates between human regulatory and activated T cells. J Exp Med. 2006;203:1693–700. doi: 10.1084/jem.20060468. [DOI] [PMC free article] [PubMed] [Google Scholar]
- 47.Liu W, Putnam AL, Xu-Yu Z, et al. CD127 expression inversely correlates with FoxP3 and suppressive function of human CD4+ T reg cells. J Exp Med. 2006;203:1701–11. doi: 10.1084/jem.20060772. [DOI] [PMC free article] [PubMed] [Google Scholar]