Abstract
To determine the relative contribution of obesity and visceral white adipose tissue (WAT) to metabolic syndrome, we developed a model that is susceptible to high-fat diet-induced obesity and insulin resistance using male KK/Ta mice. The ratio of WAT weight to body weight was greater in the high-fat diet group compared with the control group in 10-, 14-, and 22-week-old mice. The increase in visceral WAT preceded development of fatty liver and insulin resistance. Adiponectin mRNA expression in WAT was markedly decreased before the decrease in its plasma levels or the development of insulin resistance. Insulin resistance appeared in association with fatty infiltration and TNF-α expression in the liver in 22-week-old mice. These data indicate that our mouse model would be useful for future studies that investigate the role of visceral WAT and its products in the development of metabolic syndrome.
Keywords: metabolic syndrome, high-fat diet, white adipose tissue, fatty liver
Introduction
The intake of calorie-rich fast food and sedentary lifestyles in developed countries, including Japan, has sharply increased the incidence of obesity [1, 2]. Obesity is not only a serious health and economic burden, but also predisposes a person to a variety of metabolic diseases. Metabolic syndrome can be characterized by a group of metabolic risk factors that includes central obesity, insulin resistance, dyslipidemia, increased blood pressure, and nonalcoholic fatty liver disease (NAFLD) [2, 3]. Accumulating evidence suggests that adipose tissue is not simply an inert energy storage depot but also functions as a major endocrine organ, producing and releasing a variety of bioactive substances, especially adiponectin, into the bloodstream [4].
Traditionally, leptin-deficient (ob/ob) and leptin receptor-deficient (db/db) mice have been used for studies of obesity. Although the ob/ob and db/db mice have many advantages for obesity research, including studies of insulin resistance and adipocyte dysfunction, their utility in studying metabolic syndrome is limited. For example, the plasma VLDL and LDL levels do not increase and the HDL levels are elevated upon high-fat diet feeding, which findings are in contrast to those often noted in humans [5]. The lipoprotein profiles of ob/ob and db/db mice, both on a chow and high-fat diet, are uncharacteristic of wild-type mice or humans. Furthermore, these mice exhibit extremely high plasma glucose levels at young ages (6–10 weeks old).
In the current study, we sought to determine the relative contribution of obesity and visceral white adipose tissue (WAT) to metabolic syndrome, insulin resistance, and NAFLD. To this end, we developed a model that is susceptible to high-fat diet-induced obesity and insulin resistance using male KK/Ta mice. We selected this model for the following reasons: i) KK/Ta mice, which are known as an animal model of human non-insulin-dependent diabetes mellitus, have such characteristics as moderate obesity, polyuria, glucose intolerance, and hyperinsulinemia. These characteristics have been shown to appear spontaneously at 3 months of age [6, 7]. ii) Male KK/Ta mice are more susceptible to visceral obesity with vascular complications compared to females. Similarly in humans, metabolic syndrome increases visceral adiposity and cardiovascular disease risk more markedly in men than women [8]. iii) A high-animal fat diet is thought to be a major risk factor for metabolic syndrome. A recent review has concluded that animal fats and omega-6/omega-9-containing plant oils can be used to generate an obese and insulin-resistant phenotype in rodents, whereas fish oil-fed animals do not develop these disorders [9]. The aim of the present study was to determine the time-course profiles of several parameters which are characteristic of metabolic syndrome.
Materials and Methods
Animals and treatment
Male KK/Ta Jcl mice (5 weeks old, 18–20 g body weight) were purchased from CLEA Japan Inc. (Tokyo, Japan). The mice were individually housed in plastic cages at 24 ± 2°C and at 45 ± 5% relatively humidity with a 12/12-h light/dark cycle, and were given free access to food and water throughout the experimental period. After acclimation for 1 week by feeding of a basal diet, 6-week-old KK/Ta mice were divided into two groups of six mice each by body weight and blood glucose level, and fed a purified powdered basal diet or purified high-fat powdered diet containing suet powder at 37.5 g/100 g diet (high-fat diet) (Table 1), which were both purchased from CLEA Japan, Inc. (Tokyo, Japan) and kept sterile. After treatment with the experimental diet for 2, 4, 8, or 16 weeks, starved animals were sacrificed under anesthesia with intraperitoneal injection of sodium pentobarbital {Nembutal® (Dainippon Sumitomo Pharma Co., Ltd., Osaka, Japan), 50 mg/kg of body weight} to collect blood, perirenal, epididymal, mesenteric and inguinal WAT, and liver tissue. All animal experiments and care were conducted in conformity with the Guidelines of the Animal Care and Use Committee of Kyoto Prefectural University of Medicine.
Table 1.
Composition of experimental diet
| Basal |
High-fat |
|
|---|---|---|
| w/w (%) | ||
| Milk casein | 20.00 | 24.48 |
| DL-methionine | 0.30 | 0.37 |
| Corn starch | 14.66 | 5.93 |
| Granulated sugar | 49.09 | 19.85 |
| Cellulose | 5.00 | 6.12 |
| Suet powder | 6.25 | 37.50 |
| Vitamin mix (AIN-76) | 1.00 | 1.22 |
| Mineral mix (AIN-76) | 3.50 | 4.28 |
| Choline bitartrate |
0.20 |
0.24 |
| Calorie (kcal/100 g) | 373.62 | 485.60 |
| Ratio of fat/total calrie (%) | 13.10 | 56.60 |
Histological analysis
Small pieces of epididymal white adipose tissues and liver were removed and rinsed with saline. The tissues were fixed with 10% formalin and embedded in paraffin. Tissue sections were cut at a thickness of 2.5 µm and stained with hematoxylin and eosin. To examine the size of the white adipocytes, the area of each adipocyte was measured in 40 cells of representative sections with Image J software (National Institutes of Health, Bethesda, MD). The mean value was designated as an index of the cell size.
Oral glucose tolerance test and determination of plasma glucose, insulin, lipids, and adiponectin
The oral glucose tolerance test (OGTT) was performed before and 4-, 8- and 16-weeks after the treatment after overnight fasting. The mice received a 20% glucose solution (2 g/kg). Blood samples were collected just before and 0.5, 1, and 2 h after glucose loading. Plasma glucose levels were determined with a Glutest Ace R (Sanwa Kagaku Kenkyusho Co., Ltd., Nagoya, Japan). Plasma adiponectin levels were measured using the mouse adiponectin enzyme-linked immunosorbent assay (ELISA) kit (Ohtsuka, Ltd., Tokyo, Japan). Asparate 2-oxoglutarate aminotransferase (AST), alanine 2-oxoglutarate aminotransferase (ALT), blood urea nitrogen (BUN), free cholesterol, triglyceride, non-esterified fatty acid, and LDL-cholesterol were measured with a Shimadzu CL8000 Clinical Chemistry Analyzer (Shimadzu, Ltd., Tokyo, Japan).
Determination of homeostasis model assessment of insulin resistance
The homeostasis model assessment of insulin resistance (HOMA-IR) was calculated using glucose and insulin concentrations obtained after 7 h of food withdrawal, using the following formula: fasting blood glucose (mg/dl) × fasting insulin (µU/ml)/405. Plasma insulin levels were measured with an insulin ELISA kit (Morinaga Institute of Biological Science, Inc., Yokohama, Japan).
mRNA analysis
Mouse epididymal WAT and liver tissue samples were taken and stored in an Isogen solution (Nippon Gene Co., Ltd., Tokyo, Japan). The mRNA expression levels of adiponectin, tumor necrosis factor-α (TNF-α), and β-actin as an internal control were determined by real-time polymerase chain reaction (PCR). Total RNA was isolated from adipose and liver tissues by the acid guanidinium phenol chloroform method with an Isogen kit (Nippon Gene Co., Ltd.) and the concentration and the quality of RNA were determined by absorbance at 260 nm and the ratio of 260 nm to 280 nm, respectively. The isolated RNA was stored at −70°C until use in real-time PCR. For the real-time PCR, 1 µg of extracted RNA was reverse-transcribed into first-strand complementary DNA (cDNA) at 42°C for 40 min, using 200 U of M-MLV reverse-transcriptase (Promega Corporation, Madison, WI) and 0.5 µg of oligo (dT) 15 primer (Takara Bio Inc., Shiga, Japan) in a 20-µl reaction mixture.
Real-time PCR for adiponectin and TNF-α was carried out with a 7300 Real-Time PCR system (Applied Biosystems, Foster City, CA) using the DNA-binding dye SYBER Green I for the detection of PCR products. The reaction mixture contained 12.5 µl Premix Ex Taq and 0.5 µL ROX reference dye (Code RRO41A; Takara Bio Inc., Shiga, Japan), 1 µl custom-synthesized primers, and 2 µl cDNA (equivalent to 20 ng total RNA) to give a final reaction volume of 25 µl. The PCR settings were as follows: an initial denaturation for 15 s at 95°C was followed by 40 cycles of amplification for 15 s at 95°C and 31 s at 60°C, with subsequent melting curve analysis increasing the temperature from 60 to 95°C. The primers were designed using a Primer Express® software (Applied Biosystems) and had the following sequences: for adiponectin, sense 5'-CTGGCTTTCTTCTCTTCCATGATAC-3', and antisense 5'-GTGTCGACGTTCCATGATTCTC-3' (82-bp product); for TNF-α, sense 5'-ATCCGCGACGTGGAACTG-3', and antisense 5'-ACCGCCTGGAGTTCTGGAA-3' (70-bp product); and for β-actin, sense 5'-TAGCCACCTTCCAGCAGATGT-3', and antisense 5'-AGCTCAGTAACAGTCCGCCTA-3' (101-bp product). Relative quantification of gene expression with real-time PCR data was calculated relative to β-actin.
Data analysis
All statistical analysis was performed with the Statcel 2 software package (OMS Publishing Inc, Saitama, Japan). We used one-way ANOVA with a Scheffe-type multiple comparison test to compare several parameters among four groups. All data are expressed as the means ± SE, and p values <0.05 were considered statistically significant.
Results
Body weight gain and white adipose tissue weight
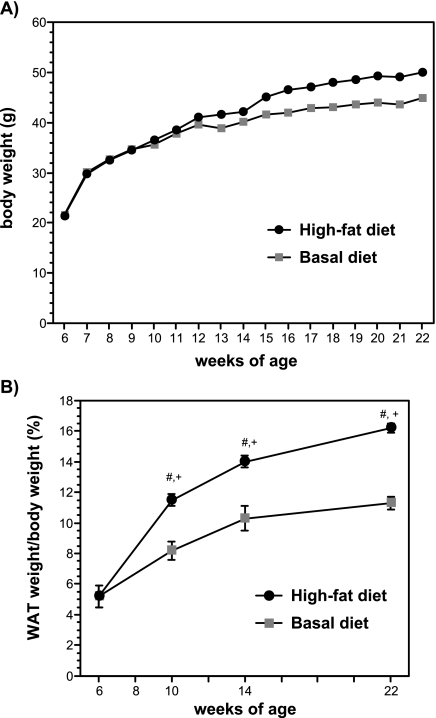
Figure 1A shows the changes in body weight of the basal diet (control) group and the high-fat diet group, throughout the experimental period. At the beginning of the experiment, the average body weight of the 6-week-old mice was 21.4 ± 0.5 g, and this value increased significantly to 50.0 ± 2.1 g after 16 weeks of feeding with a high-fat diet. There were no differences in the average body weight between the two groups until 14 weeks of age, but body weight tended to increase in the high-fat diet group compared to the basal diet group in the latter half of the experiment period. Figure 1B shows the changes in the ratio of WAT weight to body weight of the control group and the high-fat diet group in 6-, 10-, 14-, and 22-week-old mice. The ratio of WAT weight was greater in the high-fat diet group compared with the control group. In contrast to the changes of body weight, the weight of white adipose tissue was increased in 10- and 14-week-old mice treated with a high-fat diet compared with the control group.
Fig. 1.
Changes in body weight A) and the ratio of white adipose tissue (WAT) weight to body weight (B) of the mice fed a basal diet or a high-fat diet. The data are expressed as the means ± SE of 5–6 mice. #p<0.05 compared with 6-week-old mice and +p<0.05 compared with basal diet-fed mice.
Histological analysis of white adipose tissue
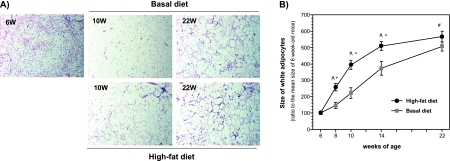
Treatment with a high-fat diet clearly increased the average size of adipocytes in the epididymal WAT in a time-dependent manner (Fig. 2A and B). Compared to adipocytes at the beginning of the experiment, the average size of adipocytes was significantly increased by >500% in mice after 16 weeks of feeding with a high-fat diet. As shown in Fig. 2B, the average size of adipocytes was significantly larger in the high-fat diet group at the ages of 8, 10, and 14 weeks compared with the control group.
Fig. 2.
Histological examination of white adipose tissues (A) and the changes in the size of white adipocytes (B) obtained from basal diet-fed and high-fat diet-fed male mice. The data are expressed as the means ± SE of 5–6 mice. #p<0.05 compared with 6-week-old mice and +p<0.05 compared with basal diet-fed mice.
Oral glucose tolerance test
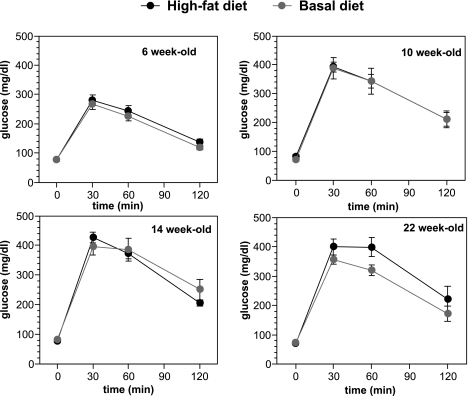
Figure 3 shows the results of the oral glucose tolerance test in the basal diet and the high-fat diet groups for 6-, 10-, 14-, and 22-week-old mice. Fasting blood glucose levels were <100 mg/dl in mice throughout the experiment. Blood glucose levels at 30 min and 60 min after glucose loading were significantly higher (>300 mg/dl) in 10-, 14-, and 22-week-old mice than in 6-week-old mice, indicating the glucose intolerance. There were no significant differences between two groups throughout the experiment.
Fig. 3.
Oral glucose tolerance test throughout the experiment. The oral glucose tolerance test (OGTT) was performed both before and after the treatment after overnight fasting.
mRNA expression of adiponectin and its plasma level
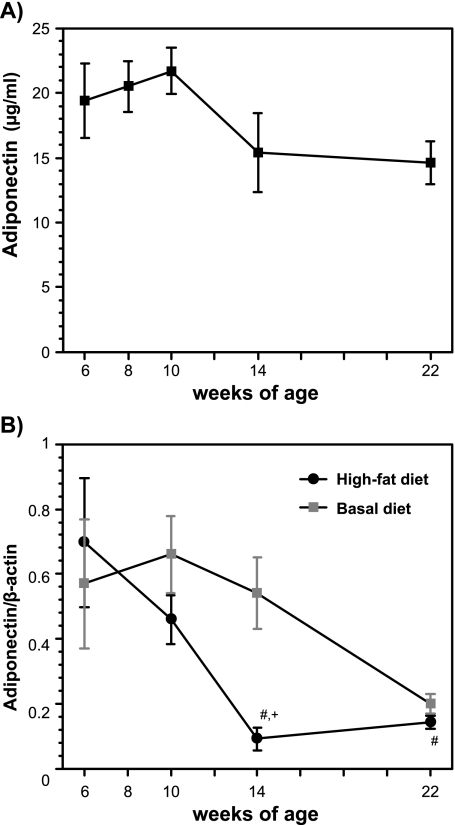
Because adiponectin is reported to be decreased in obesity, we investigated the changes in adiponectin expression in epididymal WAT and the plasma adiponectin levels in high-fat diet-fed mice (Fig. 4A and B). The treatment with a high-fat diet markedly decreased the adiponectin mRNA expression in mice at 14 weeks of age compared to the mice before treatment, and this decrease continued in mice 22 weeks of age. There was a significant difference in the level of adiponectin mRNA at 14 weeks of age. The plasma levels of adiponectin tended to decrease in mice treated with high-fat diet 14 weeks and 22 weeks of age compared with those in 6-week-old mice.
Fig. 4.
Changes in plasma adiponectin (A) and its mRNA expression in epididymal white adipose tissues (B) from high-fat diet-fed male mice. Plasma adiponectin was measured by an ELISA kit, and the mRNA expression levels were analyzed by the real-time PCR method. The details of the experiments are described in the Materials and Methods. The data are expressed as the mean ± SE of 5–6 mice. #p<0.05 compared with 6-week-old mice and +p<0.05 compared with basal diet-fed mice.
Plasma insulin concentrations and HOMA-IR
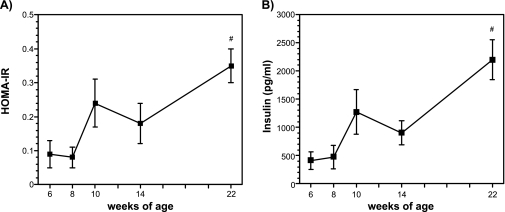
Figure 5A and B show the changes in fasting insulin concentration and HOMA-IR. These parameters, which are indices of insulin resistance, did not change during the feeding with a high-fat diet for 8 weeks, but were significantly increased in 22-week-old mice fed a high-fat diet for 18 weeks.
Fig. 5.
Changes in plasma HOMA-IR (A) and plasma insulin (B) from high-fat diet-fed male mice. Plasma insulin was measured by an ELISA kit, and HOMA-R was calculated by the fasting plasma glucose and insulin levels. The details of the experiments are described in the Materials and Methods. The data are expressed as the means ± SE of 5–6 mice. #p<0.05 compared with 6-week-old mice.
Liver histology and TNF-α mRNA expression
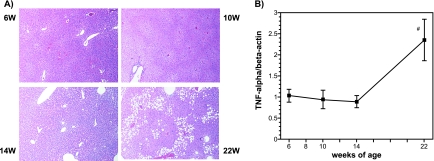
Because lipid accumulation in the liver accompanied with hepatic inflammation is reported to cause insulin resistance in high-fat diet-fed C57BL/6J Jcl mice, we investigated the histology of the liver and hepatic expression of TNF-α. As shown in Fig. 6A, small unstained vesicular regions in the hepatic cell cytoplasm were increased in 14-week-old mice fed a high-fat diet. In 22-week-old mice, larger unstained vesicular regions were increased in the zone 3 hepatocytes. Figure 6B shows the changes in hepatic TNF-α mRNA expression during the experiment. This expression was significantly increased in 22-week-old mice compared to that in 6-week-old mice.
Fig. 6.
Histological examination of the liver (A) and changes in TNF-α mRNA expression in hepatic tissues from high-fat diet-fed male mice (B). Liver tissues were stained with hematoxylin and eosin, and the mRNA expression levels were analyzed by the real-time PCR method. The details of the experiments are described in the Materials and Methods. The data are expressed as the means ± SE of 5–6 mice. #p<0.05 compared with 6-week-old mice.
Blood biochemistry
A summary of the blood chemistry is shown in Table 2. Serum levels of ALT and AST were significantly increased in 14- and 22-week-old mice fed a basal diet and in 22-week-old mice fed a high-fat diet compared with those in 6-week-old mice. Serum levels of non-esterified fatty acid and LDL cholesterol level tended to increase in 10-week-old mice and in 22-week-old mice, respectively.
Table 2.
Plasma biochemical markers
| 6 week-old |
10 week-old |
14 week-old |
22 week-old |
|||||
|---|---|---|---|---|---|---|---|---|
| Basal diet | High-fat | Basal diet | High-fat | Basal diet | High-fat | |||
| AST | U/l | 46 ± 11 | 48 ± 19 | 66 ± 5 | 106 ± 10# | 78 ± 6 | 125 ± 27# | 83 ± 3# |
| ALT | U/l | 53 ± 10 | 62 ± 11 | 66 ± 2 | 104 ± 14# | 80 ± 6 | 135 ± 34# | 95 ± 3# |
| BUN | mg/dl | 16 ± 2 | 18 ± 1 | 16 ± 1 | 23 ± 5 | 18 ± 1 | 28 ± 7 | 19 ± 1 |
| Total cholesterol | mg/dl | 92 ± 12 | 110 ± 11 | 124 ± 4 | 92 ± 8 | 98 ± 14 | 84 ± 7 | 102 ± 8.5 |
| Free cholesterol | mg/dl | 14 ± 3 | 12 ± 2 | 10 ± 0 | 10 ± 0 | 10 ± 0 | 8 ± 2 | 20 ± 0 |
| Triglyceride | mg/dl | 42 ± 11 | 48 ± 13 | 54 ± 9 | 42 ± 22 | 20 ± 7 | 20 ± 2 | 28 ± 5 |
| Non-esterified fatty acid | µeq/l | 446 ± 73 | 736 ± 157 | 612 ± 78 | 710 ± 95 | 352 ± 140 | 562 ± 113 | 497 ± 102 |
| LDL cholesterol | mg/dl | 76 ± 16 | 122 ± 13 | 104 ± 12 | 82 ± 14 | 118 ± 12 | 90 ± 20 | 132 ± 25 |
Each data is the mean ± SD of 5 mice. #p<0.05 as compared with 6 week-old mice.
Discussion
The major finding of this study included the following: (1) the increase in visceral adipose tissue preceded development of fatty liver and insulin resistance; (2) the increase in size of white adipocytes was an early event as the fist step to obesity; (3) adiponectin mRNA expression was markedly decreased before the decrease in its plasma levels or the development of insulin resistance; and (4) insulin resistance appeared in association with fatty infiltration and TNF-α expression in the liver. Although there were no significant differences in several parameters between the basal diet group and the high-fat diet group at the end of experiment (22-week-old mice), several characteristics of the metabolic syndrome, including visceral adipose tissue accumulation and decreased adiponectin expression were developed more earlier in the high-fat diet group compared to the basal diet group.
Several risk factors comprise metabolic syndrome—namely, central obesity, insulin resistance, hypertension, inflammation, and dyslipidemia. The present data demonstrate that this model exhibits many of these features. In particular, the marked fat accumulation was observed in visceral white adipose tissue/cells within a month after the treatment with high-fat diet, and this accumulation preceded the development of insulin resistance. In addition, the fat source of the high-fat diet in this study consisted of saturated fatty acids derived from animal fats. Saturated fatty acids have been known to have deleterious effects on health, but more recently, they have been specifically implicated in activating toll-like receptor-4, leading to the expression of inflammatory gene products [10, 11]. Although it is still unclear how excess visceral fat triggers metabolic syndrome, the present data clearly indicated that the high-fat diet induced visceral fat accumulation preceding insulin resistance. Coenen et al. [12] have also developed a model of metabolic syndrome in mice fed a Western diet, which they defined as a caloric density of 4.8 kcal/g with 42% of the calories from anhydrous milk fat and 0.15% added cholesterol. Their model clearly demonstrated that Western diet-induced obesity contributes to accumulation of adipose tissue-resident macrophages and its downstream pathophysiological consequences, such as inflammation and insulin resistance, but that hyperlipidemia does not. Together with our present findings, these data support the idea that adipocytes have important implications for the pathogenesis of diet-induced obesity, even when plasma lipid abnormalities are not present.
In addition to the morphological changes, the function of adipocytes in mice fed a high-fat diet may be affected by the intracellular fat deposition. The mRNA expression of adiponectin and its plasma levels are significantly reduced in obese/diabetic mice [13] and humans [14]. In the present study, the mRNA levels of adiponectin in the WAT were markedly decreased 8 weeks after the treatment with a high-fat diet, and this decrease preceded the decrease in the plasma adiponectin protein levels. In addition, the decrease in plasma adiponectin levels was correlated with the increases in plasma insulin and HOMA-IR. These data raise the possibility that the expression of adiponectin mRNA might be disturbed by the accumulation of fatty acids, and more closely related to insulin sensitivity than obesity alone. Similar findings were reported by Yamauchi et al. [15–17], who demonstrated that adiponectin is decreased in obesity and deficient in mice that are lacking in specific adipose tissues that play a causal role in the development of insulin resistance, and that the replenishment of adiponectin might provide a novel treatment modality for insulin resistance, type 2 diabetes, and atherosclerosis. The present data indicate that these mice will be useful for future studies investigating the role of visceral WAT and its products in the development of metabolic syndrome.
Nonalcoholic steatosis (nonalcoholic fatty liver disease, NAFLD) is now considered a metabolic pathway to advanced liver disease, cirrhosis and hepatocellular carcinoma. Accumulating evidence suggests that NAFLD is the hepatic expression of metabolic syndrome [2, 3]. In this model, fatty infiltration into zone 3, which is similar to NAFLD, was observed in mice fed a high-fat diet for 16 weeks, in association with the increases in serum ALT and AST. In addition, we confirmed the increased expression of TNF-α mRNA, an index of inflammation, in the liver associated with the appearance of insulin resistance in 22-week-old mice. These data indicate the close association between insulin resistance and hepatic steatosis with inflammation. Cai et al. [18] previously demonstrated that hepatic inflammation induced by lipid accumulation plays a crucial role of in the development of insulin resistance. They clearly showed that hepatic activation of IKK-β and NF-κB in common models of obesity, high-fat diet and genetic hyperplasia causes insulin resistance both locally in the liver and systemically. Consequently, these mice will be useful for future studies of the metabolic syndrome associated with NAFLD.
In conclusion, we have developed a mouse model of metabolic syndrome using male KK/Ta mice fed a high-fat diet. Using this model, we plan to more precisely clarify the mechanisms involved in the development of metabolic syndrome, especially the association between lipid accumulation-induced dysfunction of visceral adipocytes and the induction of insulin resistance. In addition, the model presented herein may be useful for the evaluation of preventive medicine, including food factors, for obesity-induced metabolic syndrome.
Acknowledgment
This study was supported by a Grant for the Research and Development Program for New Bio-industry Initiatives from Bio-oriented Technology Research Advancement Institution.
References
- 1.Nestel P., Lyu R., Low L.P., Sheu W.H., Nitiyanant W., Saito I., Tan C.E. Metabolic syndrome: recent prevalence in East and Southeast Asian populations. Asia Pac. J. Clin. Nutr. 2007;16:362–367. [PubMed] [Google Scholar]
- 2.Watanabe S., Hojo M., Nagahara A. Metabolic syndrome and gastrointestinal diseases. J. Gastroenterol. 2007;42:267–274. doi: 10.1007/s00535-007-2033-0. [DOI] [PubMed] [Google Scholar]
- 3.Shibata G., Tsuchiya H. Pathophysiology of NASH: insulin resistance, free fatty acids and oxidative stress. J. Clin. Biochem. Nutr. 2006;38:127–132. [Google Scholar]
- 4.Lara-Castro C., Fu Y., Chung B.H., Garvey W.T. Adiponectin and the metabolic syndrome: mechanisms mediating risk for metabolic and cardiovascular disease. Current Opinion in Lipidology. 2007;18:263–270. doi: 10.1097/MOL.0b013e32814a645f. [DOI] [PubMed] [Google Scholar]
- 5.Coenen K.R., Hasty A.H. Obesity potentiates development of fatty liver and insulin resistance, but not atherosclerosis, in high-fat diet-fed agouti LDLR-deficient mice. Am. J. Physiol. Endocrinol. Metab. 2007;293:E492–499. doi: 10.1152/ajpendo.00171.2007. [DOI] [PubMed] [Google Scholar]
- 6.Nakamura M. A diabetic strain of the mouse. Proc. Japan Acad. 1962;38:348–352. [Google Scholar]
- 7.Nakamuara N., Yamada K. Studies on a diabetic (KK) strain of the mouse. Diabetologia. 1967;3:212–221. doi: 10.1007/BF01222198. [DOI] [PubMed] [Google Scholar]
- 8.Onat A., Hergenc G., Keles I., Dogan Y., Turkmen S., Sansoy V. Sex difference in development of diabetes and cardiovascular disease on the way from obesity and metabolic syndrome. Metabolism. 2005;54:800–808. doi: 10.1016/j.metabol.2005.01.025. [DOI] [PubMed] [Google Scholar]
- 9.Buettner R., Scholmerich J., Bollheimer L.C. High-fat diets: modeling the metabolic disorders of human obesity in rodents. Obesity Silver Spring, Md. 2007;15:798–808. doi: 10.1038/oby.2007.608. [DOI] [PubMed] [Google Scholar]
- 10.Lee J.Y., Sohn K.H., Rhee S.H., Hwang D. Saturated fatty acids, but not unsaturated fatty acids, induce the expression of cyclooxygenase-2 mediated through Toll-like receptor 4. J. Biol. Chem. 2001;276:16683–16689. doi: 10.1074/jbc.M011695200. [DOI] [PubMed] [Google Scholar]
- 11.Shi H., Kokoeva M.V., Inouye K., Tzameli I., Yin H., Flier J.S. TLR4 links innate immunity and fatty acid-induced insulin resistance. J. Clin. Invest. 2006;116:3015–3025. doi: 10.1172/JCI28898. [DOI] [PMC free article] [PubMed] [Google Scholar]
- 12.Coenen K.R., Gruen M.L., Chait A., Hasty A.H. Diet-induced increases in adiposity, but not plasma lipids, promote macrophage infiltration into white adipose tissue. Diabetes. 2007;56:564–573. doi: 10.2337/db06-1375. [DOI] [PubMed] [Google Scholar]
- 13.Hu E., Liang P., Spiegelman B.M. AdipoQ is a novel adipose-specific gene dysregulated in obesity. J. Biol. Chem. 1996;271:10697–10703. doi: 10.1074/jbc.271.18.10697. [DOI] [PubMed] [Google Scholar]
- 14.Arita Y., Kihara S., Ouchi N., Takahashi M., Maeda K., Miyagawa J., Hotta K., Shimomura I., Nakamura T., Miyaoka K., Kuriyama H., Nishida M., Yamashita S., Okubo K., Matsubara K., Muraguchi M., Ohmoto Y., Funahashi T., Matsuzawa Y. Paradoxical decrease of an adipose-specific protein, adiponectin, in obesity. Biochem. Biophys. Res. Commun. 1999;257:79–83. doi: 10.1006/bbrc.1999.0255. [DOI] [PubMed] [Google Scholar]
- 15.Yamauchi T., Kamon J., Waki H., Terauchi Y., Kubota N., Hara K., Mori Y., Ide T., Murakami K., Tsuboyama-Kasaoka N., Ezaki O., Akanuma Y., Gavrilova O., Vinson C., Reitman M.L., Kagechika H., Shudo K., Yoda M., Nakano Y., Tobe K., Nagai R., Kimura S., Tomita M., Froguel P., Kadowaki T. The fat-derived hormone adiponectin reverses insulin resistance associated with both lipoatrophy and obesity. Nat. Med. 2001;7:941–946. doi: 10.1038/90984. [DOI] [PubMed] [Google Scholar]
- 16.Yamauchi T., Kamon J., Minokoshi Y., Ito Y., Waki H., Uchida S., Yamashita S., Noda M., Kita S., Ueki K., Eto K., Akanuma Y., Froguel P., Foufelle F., Ferre P., Carling D., Kimura S., Nagai R., Kahn B.B., Kadowaki T. Adiponectin stimulates glucose utilization and fatty-acid oxidation by activating AMP-activated protein kinase. Nat. Med. 2002;8:1288–1295. doi: 10.1038/nm788. [DOI] [PubMed] [Google Scholar]
- 17.Yamauchi T., Kamon J., Waki H., Imai Y., Shimozawa N., Hioki K., Uchida S., Ito Y., Takakuwa K., Matsui J., Takata M., Eto K., Terauchi Y., Komeda K., Tsunoda M., Murakami K., Ohnishi Y., Naitoh T., Yamamura K., Ueyama Y., Froguel P., Kimura S., Nagai R., Kadowaki T. Globular adiponectin protected ob/ob mice from diabetes and ApoE-deficient mice from atherosclerosis. J. Biol. Chem. 2003;278:2461–2468. doi: 10.1074/jbc.M209033200. [DOI] [PubMed] [Google Scholar]
- 18.Cai D., Yuan M., Frantz D.F., Melendez P.A., Hansen L., Lee J., Shoelson S.E. Local and systemic insulin resistance resulting from hepatic activation of IKK-beta and NF-kappaB. Nat. Med. 2005;11:183–190. doi: 10.1038/nm1166. [DOI] [PMC free article] [PubMed] [Google Scholar]


