

Abstract
Tor1,2 control of type-2A-related phosphatase activities in S. cerevisiae has been reported to be responsible for the regulation of Gln3 phosphorylation and intracellular localization in response to the nature of the nitrogen source available. According to the model, excess nitrogen stimulates Tor1,2 to phosphorylate Tip41 and/or Tap42. Tap42 then complexes with and inactivates Sit4 phosphatase, thereby preventing it from dephosphorylating Gln3. Phosphorylated Gln3 complexes with Ure2 and is sequestered in the cytoplasm. When Tor1,2 kinase activities are inhibited by limiting-nitrogen, or rapamycin-treatment, Tap42 can no longer complex with Sit4. Active Sit4 dephosphorylates Gln3, which can then localize to the nucleus and activate transcription. The paucity of experimental data directly correlating active Sit4 and Pph3 with Gln3 regulation prompted us to assay Gln3-Myc13 phosphorylation and intracellular localization in isogenic wild type, sit4, pph3, and sit4pph3 deletion strains. We found that Sit4 actively brought about Gln3-Myc13 dephosphorylation in both good (glutamine or ammonia) and poor (proline) nitrogen sources. This Sit4 activity masked nitrogen source-dependent changes in Gln3-Myc13 phosphorylation which were clearly visible when SIT4 was deleted. The extent of Sit4 requirement for Gln3 nuclear localization was both nitrogen source- and strain-dependent. In some strains, Sit4 was not even required for Gln3 nuclear localization in untreated or rapamycin-treated, proline-grown cells or Msx-treated, ammonia-grown cells.
Applications of clinically important derivatives of the anti-inflammatory and anti-neoplastic drug rapamycin have steadily grown in concert with our increased understanding of how cellular processes are regulated by their target, mTor (mammalian Target Of Rapamycin) (1–4). The S. cerevisiae GATA-family transcription activator, Gln3 is widely used as a reporter in studies investigating Tor function (5, 6). A major function of Gln3 is to activate Nitrogen Catabolite Repression- (NCR)-sensitive transcription needed to exploit poor nitrogen sources in the environment when nothing better is available (biology reviewed in 7–11). In the presence of good nitrogen sources (e.g. glutamine or ammonia in some strains) genes encoding permeases and enzymes required for the transport and degradation of poor nitrogen sources (e.g. proline) are minimally expressed. In contrast, when good nitrogen sources are limiting or only poor sources are available, expression of these genes increases. (7–11).
Two pivotal observations opened a new era of investigation into the mechanisms regulating Gln3 function: (i) During times of high NCR, GATA sequences (binding sites for Gln3 and Gat1/Nil1) in the promoter of an NCR-sensitive gene (CAN1) are unoccupied by Gln3 and Gat1, and thus available to serve as surrogate TATA-binding protein (TBP) binding sites (12). Gln3 and Gat1 occupancy of CAN1 GATA sequences correlates with Gln3 and Gat1 localization to the cytoplasm of cells in which NCR-sensitive transcription is low, and to their nuclei when expression is high (12, 13). (ii) Treating YPD-grown wild type cells with rapamycin induces Gln3 dephosphorylation, Gln3 nuclear localization and high level NCR-sensitive transcription. In contrast, Gln3 is phosphorylated, localizes to the cytoplasm, and NCR-sensitive transcription is low in similarly grown, untreated cells (14–17).
The above correlations along with the protein-protein association and phosphorylation relationships between Tor1,2, Tap42, Tip41, Sit4, and Sit4-associated proteins (Saps), led to a proposal describing Tor1,2 regulation of Gln3 phosphorylation via control of the type-2A-related protein phosphatases, Sit4 and/or Pph3 (Fig. 1) (5, 14–22). In bare outline, the model posits that signals of nitrogen excess (glutamine or a metabolite of it) are sensed by Tor1,2 which become active and phosphorylate Tap42 and/or Tip41 (14, 17–22). The outcome of these phosphorylations is the association of Tap42 with Sit4, thereby inactivating the phosphatase (18–20). In this inactive form, Sit4 is unable to dephosphorylate Gln3, resulting in its sequestration in the cytoplasm as a Gln3-Ure2 complex (Fig. 1) (14, 17). When cells are treated with rapamycin, or the glutamine synthetase inhibitor, methionine sulfoximine (Msx), which inhibits the synthesis of glutamine, Tor1,2 are inhibited and cease phosphorylating Tap42. Dephosphorylated Tap42 dissociates from Sit4 thereby allowing Sit4 to be active and dephosphorylate Gln3, resulting in or permitting Gln3 to dissociate from Ure2 and enter the nucleus (14, 17).
Figure 1.
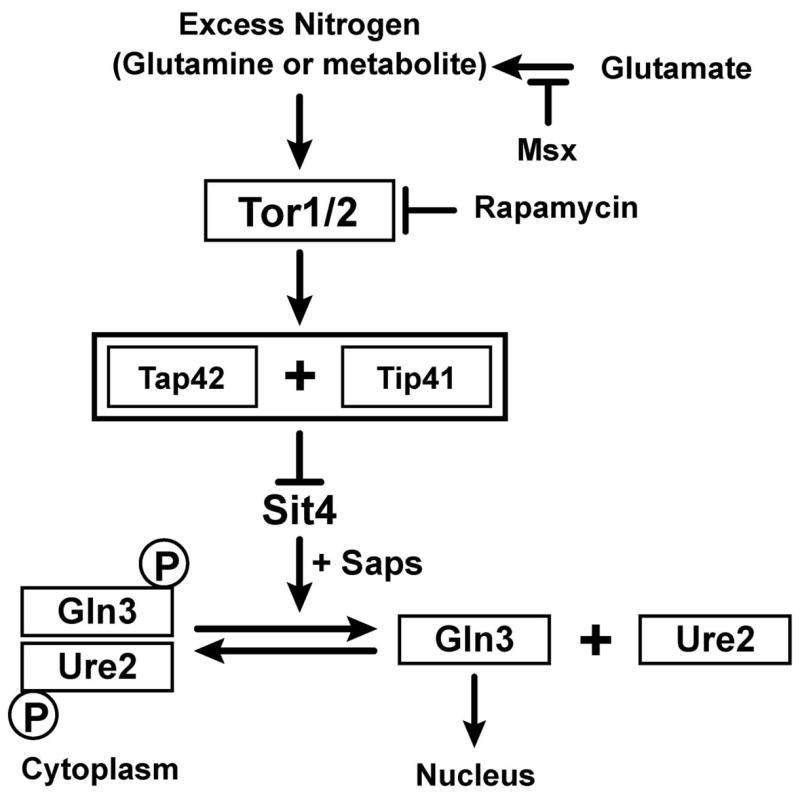
Abbreviated diagram of the model describing the regulation of Gln3 phosphorylation and intracellular localization. The diagram was derived from (14, 20, 21).
Experimentally, Sit4 was first implicated in Gln3 regulation by the demonstration that neither rapamycin-induced Gln3 nuclear localization, nor dephosphorylation occurred in a YPD-grown sit4 mutant (14). In a subsequent report, rapamycin was observed to induce modestly less GAP1 expression in a pph3 mutant than wild type, implicating the second type-2A-related phosphatase in Gln3 regulation (17). Most recently, Msx-induced Gln3 localization was reported not to occur in a sit4 mutant growing in SD medium (22).
Although impressive progress has been made in identifying additional proteins involved in Tor1,2’s global influence on cellular processes, several observations do not fit comfortably with expectations generated by the model (23). Among them are: (i) In genetic studies, Tap42 behaves more like a positive rather than a negative regulator of Sit4 (18). (ii) Sit4 association with Tap42 is required for Sit4 activity (18, 24, 25). (iii) Detectable Gln3-Myc13 phosphorylation and intracellular localization do not correlate with one another in good vs. poor nitrogen sources, during nitrogen starvation, following Msx-treatment, and beyond 30 mins. of rapamycin-treatment (26). (iv) Msx increases Gln3-Myc13 phosphorylation whereas rapamycin decreases it even though both inhibitors elicit nuclear localization of Gln3-Myc13 (27).
As noted in Fig. 1, type 2-A-related Sit4 [and Pph3] protein phosphatase activities have been proposed to directly regulate Gln3 phosphorylation and localization (14, 17, 22). The correlations upon which this conclusion rests are the failure of Gln3 dephosphorylation, nuclear localization, and NCR-sensitive transcription to occur in YPD-grown, rapamycin-treated sit4 cells. There are, however, several important gaps in our understanding of Sit4 participation in the Tor1,2 control pathway regulating Gln3: (i) Is Sit4 required for Gln3 dephosphorylation and/or nuclear accumulation of Gln3 when cells are provided with a poor nitrogen source or treated with Msx?, (ii) Is Sit4 inactive under conditions where Gln3 is restricted to the cytoplasm (i.e. nitrogen excess)? (iii) What are the relative requirements of Sit4 and Pph3 for Gln3 dephosphorylation and nuclear localization in response to growth with various nitrogen sources, rapamycin and Msx-treatment? (iv) Do the Tap42-Sit4-requirement for Gln3 regulation found in some instances but not others reflect strain specific differences when experiments are performed under identical conditions (14, 15)?
To fill in some of the gaps in our understanding of type-2A-related phosphatases and their relationship to Gln3 regulation, we performed a systematic analysis of Gln3 phosphorylation and intracellular localization, comparing these parameters in wild type, single and double sit4 and pph3 mutant cells. Our data demonstrate that: (i) Sit4 is active with respect to Gln3-Myc13 phosphorylation levels under conditions of excess nitrogen in which Tor1,2 are active, (ii) Gln3-Myc13 phosphorylation is nitrogen source-dependent in a sit4Δ, indicating that Sit4 activity is unlikely to be the major determinant responsible for nitrogen-dependent changes in Gln3-Myc13 phosphorylation, (iii) rapamycin-induced alteration of Gln3-Myc13 phosphorylation levels requires Sit4, whereas alterations elicited by Msx or the nitrogen source do not, (iv) the extent of the Sit4 requirement for Msx- and rapamycin-induced nuclear localization of Gln3-Myc13 is nitrogen source dependent, (v) the Sit4 requirement for nuclear Gln3-Myc13 localization is strain dependent, and (vi) demonstrable Pph3 influence on Gln3 regulation was minimal compared to that of Sit4.
MATERIALS AND METHODS
Strains and Culture Conditions
Saccharomyces cerevisiae strains used in this work are listed in Table 1. Strains were grown at 30° C to mid-log phase (A600 nm = 0.5) in YNB (without amino acids or ammonium sulfate) medium, containing 2% glucose, required auxotrophic supplements (120 μg/ml leucine, 20 μg/ml uracil, 20 μg/ml histidine, 20 μg/ml tryptophan, 20 μg/ml arginine, and the nitrogen source (0.1% final concentration) indicated. YPD medium consisted of 10 gm yeast extract, 20 gm bactopeptone, and 20 gm dextrose per 1000 ml. Rapamycin (Sigma-Aldrich) (dissolved in 10% Tween 20 + 90% ethanol) was added to the cultures, where indicated, to a final concentration of 0.2 μg/ml for 20 or 30 mins prior to cell harvest. L-methionine sulfoximine (Msx) (Sigma-Aldrich) was dissolved in water and added to the cultures, where indicated, to a final concentration of 2 mM for 30 mins. prior to cell harvest (by filtration). Where indicated, yeast were transferred (by filtration and resuspension) from one medium to another that had been pre-warmed, pre-aerated, and contained the required auxotrophic supplements.
Table 1.
Saccharomyces cerevisiae trains used in this work
| Strain | Parent | Genotype | Primer Coordinates |
|---|---|---|---|
| TB123 | JK9-3da | MATa, leu2-3, 112, ura3-52, rme1, trp1, his4, GAL+, HMLa, GLN3-Myc13[KanMX) | None |
| TB50 | MATα, Leu2-3,112, ura3-52, trp1, his3, rme1, HMLa | None | |
| JK9-3da | MATa, leu2-3,112, ura3-52, trp1, his4, rme1, HMLa | None | |
| TB136 | MATa, leu2-3,112, ura3-52, rme1, trp1, his4, GAL+, HMLa, GLN3-Myc13[KanMX], sit4::kanMX | None | |
| BY4709 | MATα, ura3 | None | |
| FV017 | BY4709 | Matα,ura3, GLN3-Myc13[KanMx] | |
| FV1 | BY4709 | MATα, ura3, sit4::natMX, GLN3-MYC13[kanMX] | 5′, −450 to −429 & −23 to −1
3′ 937 to 955 & 1380 to 1400 |
| FV2 | BY4709 | MATα, ura3, pph3::natMX, GLN3-MYC13[kanMX] | 5′, −400 to −379 & −22 to −1
3′ 927 to 950 & 1206 to 1228 |
| FV3 | TB123 | MATa, his4, leu2, ura3, trp1, rme1, pph3::natMX, GLN3-myc13[kanMX] | 5′, −400 to −379 & −22 to −1
3′ 927 to 950 & 1206 to 1228 |
| FV4 | TB136 | MATa, his4, leu2, ura3, trp1, rme1, sit4::kanMX, pph3::natMX, GLN3-MYC13[kanMX] |
sit4: 5′, −450 to −429 & −23 to −1
3′ 937 to 955 & 1380 to 1400 pph3: 5′, −400 to −379 & −22 to −1 3′ 927 to 950 & 1206 to 1228 |
Strain Construction
Previous data, showing strain differences can be critically important in evaluating the regulation of Gln3 function (28, 29), recommended the use of isogenic strains. Recombinant methods were used to create specific deletions in two strain backgrounds: (i) TB123, used as the wild type in the original experiments demonstrating rapamycin-induced alterations in Gln3 phosphorylation and intracellular localization (14), as well as in our own previous experiments (26, 27, 30, 31), and (ii) derivatives of BY4709, used in the systematic deletion project (32).
Deletion strains (FV series) were constructed using the long flanking homology strategy of Wach (33). The kanMX or natMX cassettes, flanked by about 500bp corresponding to the promoter and terminator regions of the target genes, were synthesized by a two-step PCR procedure (primer coordinates are in Table 1). DNA fragments (blunt-ended PCR products) containing the various constructs were used to transform the appropriate strains. Transformants were selected on YPD medium containing 200μg per ml of geneticin or 100 μg per ml of nourseothricin. Correct targeting of the deletions was verified by PCR analysis, using whole cells as the source of template DNA and two sets of primers: (i) a primer 5′ of the deletion cassette, a second at the 5′ end of the Kan gene, and a third at the beginning of the coding sequence of the gene that was deleted, and (ii) a primer at the 3′ end of the Kan gene, a second at the 3′ end of the coding sequence of the deleted gene, and a third 3′ of the deletion cassette.
Northern Blot Analysis
Total RNA was extracted as described earlier (34) and purified using the RNeasy kit (Qiagen). Northern blot analysis was performed as described by Foury and Talibi (35). DIG-DNA probes of about 500 bp were generated by PCR, using primers: 5′-CATAACCAGTTGGTGAGCCC-3′ and 5′-ACCCCCGTTACTGTATGTGG-3′ for SIT4, 5′-TGGGCGATTTTGTGGATAGG-3′ and 5′-CTGTCACTAATCCACCGTCG-3′ for PPH3, 5′-AAACAGCAAGAAAGTCCACTGG-3′ and 5′-ACCTCTTAATCTTCTAGCCAAC-3′ for HHT1, and labeled using a PCR DIG (digoxigenin) probe synthesis kit (Roche). Hybridizations were carried out according to standard procedures (36). Detection of DIG-labeled nucleic acids was performed by enzyme immunoassay with luminescence following the supplier procedure (Roche). The Hybond-N+ nylon membranes were exposed 120 mins. and analyzed with a chemiluminescence camera (Chemi-Smart from Vilbert-Lourmat).
Western Blot Analysis
Cells were harvested by the filtration method of Tate et al. (27), and crude cell extracts prepared as described by Cox et al. (26). As noted earlier (27), we prefer to assess the relative amounts of various Gln3-Myc13 species within a particular lane and then compare the pattern of Gln3-Myc13 distribution with that observed in another lane, rather than quantitatively comparing the amounts of particular Gln3-Myc13 species observed in one lane with those in another. Further, although we occasionally compared the overall patterns of data observed in one western blot to that of another, detailed comparisons were restricted to lane profiles contained within a single western blot membrane unless specifically indicated otherwise.
Indirect Immunofluorescence Microscopy
Cell preparation and assay of Gln3-Myc13 by indirect immunofluorescence was initially performed as described earlier (31, 37). Although this method (used in Fig. 2 of this text, and Fig. 1 of the Supplemental Material) performs well for wild type strains, it was inadequate for analysis of Gln3-Myc13 intracellular distribution in phosphatase mutants. sit4Δ, and to a lesser extent pph3Δ, mutants possess characteristics that, if not circumvented, seriously compromise analysis of Gln3-Myc13 intracellular distribution. Gln3-Myc13 and DAPI stained material (DNA) were asymmetrically distributed to the daughters and mothers, respectively, of sit4Δ cells with small to medium sized buds (Fig. 2). The frequency of this morphology was increased by rapamycin-treatment. This phenomenon and data suggesting that it derives from differential sensitivity of mother and daughter cells walls to zymolyase digestion as well as differential affinity for lysine-coated slides are described in Supplemental Material. Therefore, we used a modified form of another method (38) in all but Fig. 2. The modifications were: (i) fixation in the growth medium for 60 mins., (ii) addition of β-mercaptoethanol (20 mM final concentration) to the zymolyase digestion mixture, and (iii) increased digestion of mutant cells (34 to 37 mins.) and decreased digestion (15 to 17 mins.) for the wild type. Digesting wild type cells for the same length of time as the sit4Δ resulted in significant degradation of cell integrity.
Figure 2.
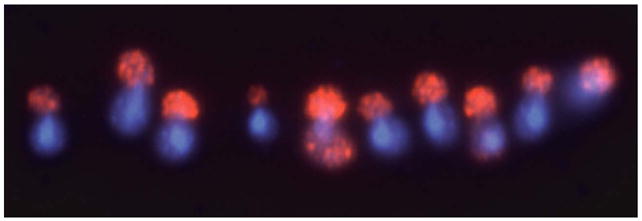
Intracellular distribution of Gln3-Myc13 in YNB-glutamine-grown sit4Δ (TB136) cells treated with rapamycin. Indirect immunofluorescent staining of Gln3-Myc13 and DAPI-positive material appear in red and blue, respectively (See Supplemental Material).
Determination of Intracellular Gln3-Myc13 Distribution
To determine the intracellular distribution of Gln3-Myc13 generated by the experimental conditions used, an average of 150–200 cells, from randomly chosen fields of each experimental condition, were scored in a double blind manner to determine the distribution of Gln3-Myc13. Experiments were independently repeated from two to seven times. Cells were classified into three categories, those in which Gln3-Myc13 was cytoplasmic, nuclear-cytoplasmic, or nuclear. Recognizing that boundaries between the middle category and those flanking it would be unavoidably subjective, we performed two control experiments to determine the precision with which we placed cells into two adjacent categories. First, we categorized Gln3-Myc13 as being cytoplasmic or nuclear-cytoplasmic in cells from one microscopic image and then repeated the count a second time using the same image. Next, we repeated this procedure using a second, randomly selected image derived from the same slide as the first image. The cell sample used in this experiment contained approximately equal numbers of cells in which Gln3-Myc13 was categorized as cytoplasmic and nuclear-cytoplasmic, respectively. The two counts yielded four sets of values, two from each image used above. The four sets of values varied from one another by plus or minus 2–3%. Finally, we performed an analogous experiment using two images of a cell sample which contained approximately equal numbers of cells in which Gln3-Myc13 was categorized as being nuclear-cytoplasmic and nuclear, respectively. The same variation (plus or minus 2–3%) was observed in this second experiment as well. These results argued that we could categorize Gln3-Myc13 localization with acceptable precision. The patterns of Gln3-Myc13 distribution between cell compartments in response to various experimental conditions (strains, nitrogen source, inhibitor-treatment) were also reproducible as was the quantitative distribution of Gln3-Myc13 among the three intracellular categories in repeated scoring of images from a single cell sample. Experiment-to-experiment variation was 2–10%, except when proline was used as nitrogen source. Here, experiment-to-experiment values occasionally varied into the 20% range for isolated samples. Therefore, our attempts to achieve as accurate and precise data as possible notwithstanding, we attribute less significance to the precise percentages of Gln3-Myc13 distribution among the three possible intracellular categories than to the patterns of change observed in the distribution of Gln3-Myc13 when comparing one experimental condition to another, i.e., presence vs. absence of inhibitor, nitrogen source identity, wild type vs. mutant strains.
RESULTS
Sit4 phosphatase brings about Gln3-Myc13 dephosphorylation in cells provided with good nitrogen sources
Our initial experiment investigated central, but previously untested, tenants of the Tor1,2 pathway model, i.e., (i) in the presence of a good nitrogen source, Tor1,2 are active and (via Tap42 and/or Tip41) inhibit Sit4 activity, thus preventing it from dephosphorylating Gln3, and (ii) Sit4 is active when the Tor1,2 kinases are inhibited by growth in limiting nitrogen, thereby making it available to dephosphorylate Gln3. Wild type and isogenic sit4Δ cultures were grown in YNB-glutamine medium in the presence and absence of rapamycin. As expected, and previously shown by multiple laboratories, rapamycin-treatment elicited Gln3-Myc13 dephosphorylation in wild type cells (Fig. 3A, lanes A vs. D). In sit4Δ cultures, two unexpected results were observed: (i) Sit4 was clearly active in cells provided with a good nitrogen source, because deleting SIT4 increased Gln3-Myc13 phosphorylation relative to wild type (Fig. 3A, lanes A vs. B). (ii) Rapamycin induced partial Gln3-Myc13 dephosphorylation in a sit4Δ (Fig. 3A, lanes B vs. C), indicating that more than Sit4 alone was responsible for rapamycin-induced dephosphorylation. Together, these data indicated that type-2A phosphatase participation in the regulation of Gln3 phosphorylation was likely more complicated or different than previously reported and motivated a more thorough investigation. Most importantly, these data showed that Sit4 is active in glutamine-grown cells in which Tor1,2 were posited to actively phosphorylate Tap42 (and/or Tip41), thereby bringing about inhibition of Sit4 protein phosphatase.
Figure 3.

(Panel A) Sit4 is active with respect to Gln3-Myc13 dephosphorylation in cells provided with a good nitrogen source (YNB-glutamine). Western blot analysis of Gln3-Myc13 in wild type (TB123) and sit4Δ (TB136) cells. Rapamycin was added for 30 min. prior to cell harvest where indicated (Rap +). (Panels B) Steady state mRNA levels of SIT4 and PPH3 in wild type (TB123), sit4Δ (TB136), and pph3Δ (FV3). Cells were cultured in YNB -glutamine (Gln) or -ammonia (Am. or +NH4) medium in the presence (+ Rap; 30 min.) or absence of rapamycin or Msx (+ Msx; 20 min.). Additionally, glutamine cultures were transferred to proline (Gln to Pro) or nitrogen-free (Gln to N.S.) medium and incubated for 60 min. before the cells were harvested.
Influence of Sit4 and Pph3 phosphatase on steady state levels of SIT4 and PPH3 mRNA
Previous reports of both Pph3 and Sit4 functioning in rapamycin-induced Gln3 dephosphorylation and localization (14, 17, 22), prompted us to query whether the expression of their cognate genes was subject to Tor1,2 or NCR-sensitive regulation. Therefore, we assayed SIT4 and PPH3 expression in wild type, sit4Δ and pph3Δ strains cultured under multiple conditions: the presence and absence of rapamycin (in glutamine medium) or Msx (in ammonia medium), and following transfer from glutamine to proline or nitrogen-free medium. As shown in Fig. 3B, neither SIT4 nor PPH3 expression appeared to exhibit a response to the nitrogen source provided. As expected, there was no expression when the genes themselves were deleted (Fig. 3B).
Type-2A-related phosphatase requirements for nuclear localization of Gln3-Myc13
Next we evaluated the influence of defects in type-2A-related phosphatases, Sit4 and Pph3, on Gln3-Myc13 localization in cells cultured as described in Fig. 3B, lanes A–D and with proline as sole nitrogen source. Wild type cells behaved as expected and previously reported, i.e., Gln3-Myc13 was cytoplasmic in glutamine-grown cells, and nuclear in proline-grown or rapamycin-treated cultures as well as glutamine-grown cells transferred to proline or nitrogen free medium (Fig. 4, column W.T.). Intracellular Gln3-Myc13 localization in pph3Δ mutants did not significantly differ from that in wild type (Fig. 4, column pph3Δ). In contrast, Gln3-Myc13 was predominantly cytoplasmic in sit4Δ cells treated with rapamycin, transferred from glutamine to proline or nitrogen free medium, and grown with proline as sole nitrogen source (Fig. 4, column sit4Δ). Results obtained with the sit4Δpph3Δ double mutant were similar to those observed with sit4Δ alone (data not shown). These data, at face value, supported the earlier contention that Sit4 was required for nuclear accumulation of Gln3-Myc13 when nitrogen was limiting or cells were treated with rapamycin.
Figure 4.
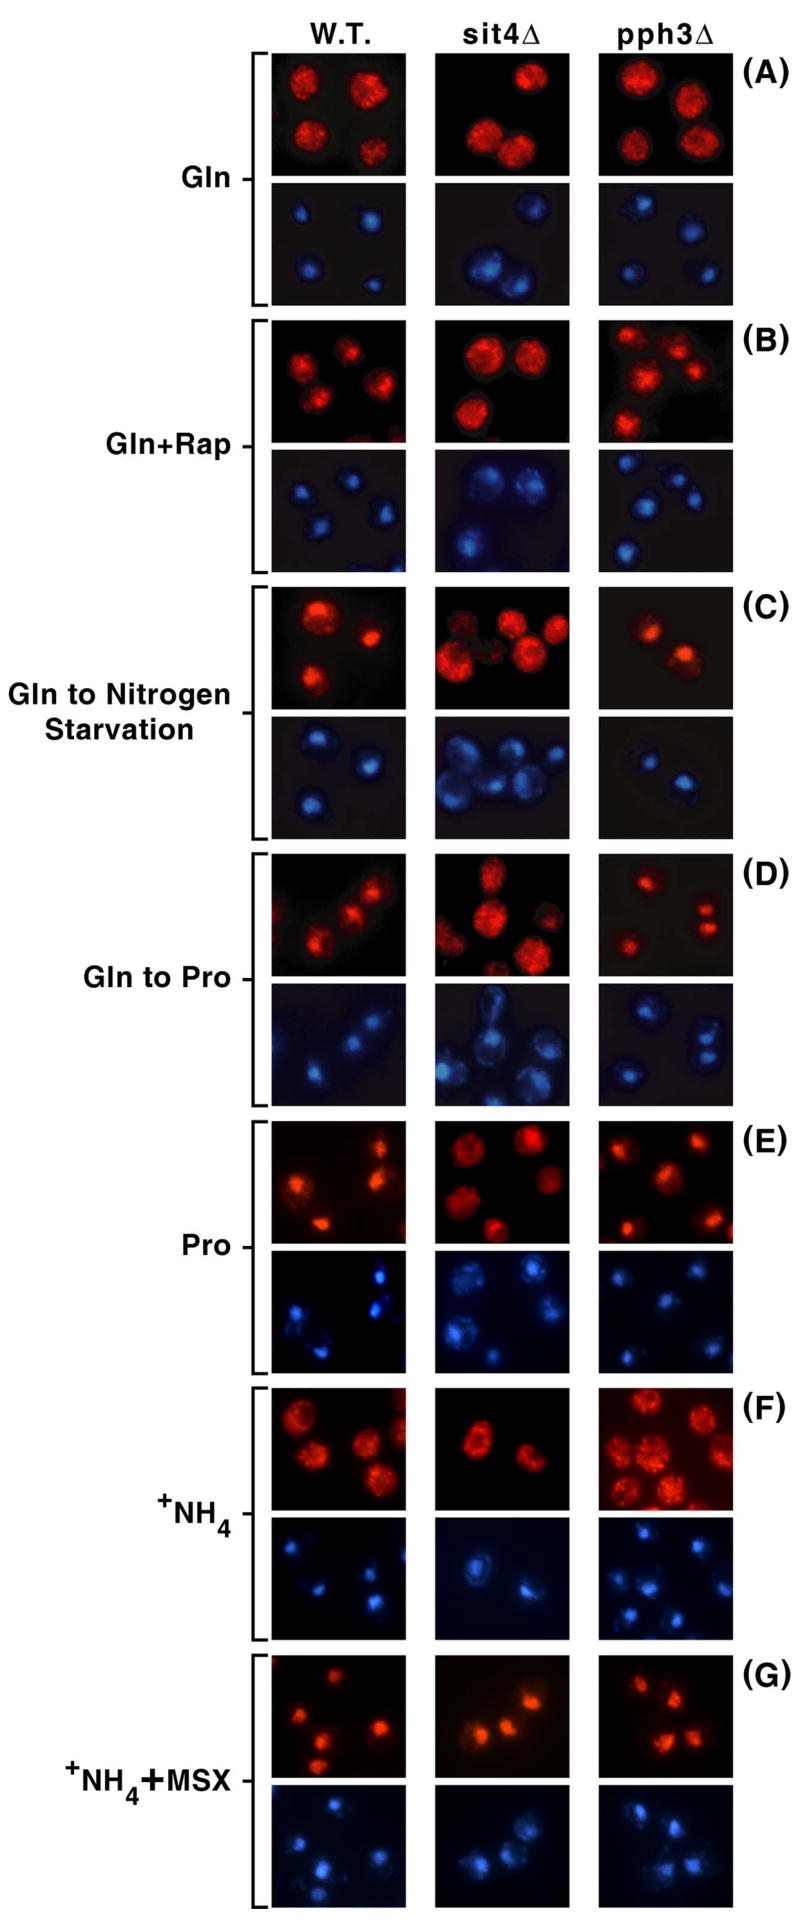
Intracellular distribution of Gln3-Myc13 observed in wild type (W.T.; TB123), sit4Δ (TB136) and pph3Δ (FV3) mutant cells grown in glutamine (Gln) medium in the presence (+ Rap) or absence of rapamycin, in proline (Pro) medium, or in after transfer from glutamine to nitrogen-free (Gln to Nitrogen Starvation; 60 min.) or proline (Gln to Pro; 60 min.) medium. Images are presented in pairs in which the Gln3-Myc13 (red) image appears above the same one stained with DAPI (blue).
Contrasting phosphatase requirements for nuclear localization of Gln3-Myc13 in response to rapamycin- and Msx-treatment
Careful inspection of many images such as those in Fig. 4 suggested the method of classification we had been using might be too crude to describe fully what occurred in response to various experimental pertubations. There were times when Gln3-Myc13 was neither completely nuclear nor cytoplasmic, i.e., one could see Gln3-Myc13 fluorescence in both cellular compartments. Therefore, we increased the resolution of our measurements by introducing a third scoring category, nuclear-cytoplasmic localization. Criteria used to place cells in each of the three categories were as follows: (i) cells in which Gln3-Myc13 could only be detected in the cytoplasm were scored cytoplasmic, (ii) those in which only nuclear localization was detected were scored nuclear, and (iii) those in which staining could be clearly detected in both compartments were scored nuclear-cytoplasmic. The third category was clearly subjective. However, this potential for subjectivity did not prove to be problematic as shown by evaluation of the assay in Materials and Methods. Success and reliability of the assay most required consistency in scoring since it was the accurate and reproducible detection of changes in the patterns of Gln3-Myc13 distribution among the cellular compartments that is most critical.
Using these scoring criteria, we assayed Gln3-Myc13 intracellular localization in wild type and three isogenic phosphatase defective mutants. Gln3-Myc13 was cytoplasmic in all glutamine-grown wild type cells (Fig. 5A, red bar, W.T.). Following rapamycin-treatment, Gln3-Myc13 became nuclear-cytoplasmic (yellow bar) in about 80% of the cells. In the remaining cells, Gln3-Myc13 was about equally distributed between the nuclear (green bar) and cytoplasmic (red bar) compartments (Fig. 5A, W.T.). The distribution shifted towards a greater nuclear localization of Gln3-Myc13 when glutamine-grown cultures were transferred to minimal-proline or nitrogen-free medium (Fig. 5A, W.T.). However, Gln3-Myc13 was still cytoplasmic in about 20% of the cells following nitrogen starvation, which may have resulted from insufficient time being allowed for the nitrogen reserves of these cells to be completely exhausted before they were harvested.
Figure 5.
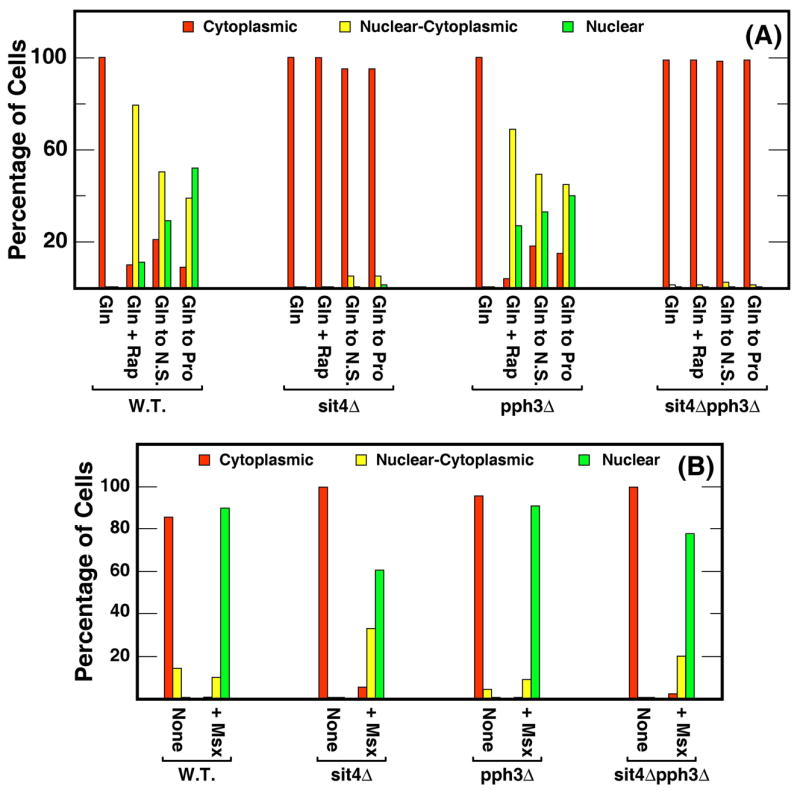
Intracellular Gln3-Myc13 distribution in wild type and type-2A-related phosphatase mutants cultured in glutamine (Gln) medium in the presence (+ Rap) or absence of rapamycin, or after transfer from glutamine to nitrogen-free (Gln to N.S.; 60 min.) or proline (Gln to Pro; 60 min.) medium. Cells (TB123, TB136, FV3, and FV4) were scored as described in Materials and Methods: cytoplasmic (red), nuclear-cytoplasmic (yellow) and nuclear (green). Panel B. Strains identical to those used in Panel A were cultured in ammonia-medium in the presence (+Msx) or absence of methionine sulfoximine.
When sit4Δ and pph3Δ single and sit4Δpph3Δ double mutants were subjected to the same perturbations as the wild type, quite unambiguous phenotypes were observed. The distribution of Gln3-Myc13 in a pph3Δ was nearly indistinguishable from wild type irrespective of the condition tested (Fig. 5A). In contrast, Gln3-Myc13 was restricted to the cytoplasm of both sit4Δ and sit4Δpph3Δ cells cultured under comparable conditions. This suggested, in agreement with other reports, that Sit4 was required for nuclear localization of Gln3-Myc13 in cells exposed to these three conditions. However, the Sit4 requirement was nearly absent when analogous experiments were performed with the metabolic inhibitor, Msx. As shown in Fig. 5B, Gln3-Myc13 was largely cytoplasmic in ammonia-grown cultures, but was nuclear and/or nuclear-cytoplasmic in all but a few sit4Δ or sit4Δpph3Δ mutant cells following Msx-treatment. Again, as seen in Fig. 5A, the Gln3-Myc13 intracellular distribution profile in a pph3Δ was indistinguishable from that of wild type (Fig. 5B). These data demonstrated that, although treating cells with rapamycin or Msx had been reported to have similar inhibitory effects on Tor1,2 activity (22, 27), nuclear localization of Gln3-Myc13 did not possess a Sit4 or Pph3 requirement following Msx-treatment clearly distinguishing it from the response to rapamycin.
Sit4 requirement of Gln3-Myc13 localization is nitrogen source dependent
The Gln3-Myc13 distribution data above were difficult to rectify with the idea that Sit4, performed the requisite dephosphorylation of Gln3 in preparation for its transport into the nucleus. Therefore, we approached the putative Sit4 requirement from a different direction. If Sit4 functioned downstream of the nitrogen supply signal in the Gln3 regulatory pathway, then the response to both rapamycin- and Msx-treatment in sit4 mutants should be independent of the nitrogen source provided. If, on the other hand, the nitrogen supply signal was situated downstream of Sit4, or in another regulatory pathway, then the nitrogen source provided to the cells would be expected to influence Gln3 localization in wild type and sit4Δ cells.
To investigate these possibilities, we determined Gln3-Myc13 localization, following rapamycin- or Msx-treatment in cultures provided with nitrogen sources ranging from good to poor: glutamine, YPD, ammonia, and proline (Fig. 6A–D). Gln3-Myc13 was completely cytoplasmic in glutamine medium and this distribution was altered only by rapamycin-treatment which elicited Sit4-dependent, nuclear-cytoplasmic localization in most cells (Fig. 6A). Msx-treatment failed to elicit a response in glutamine-grown cells concurring with earlier reports (21, 27). Our experiments do not distinguish whether this result occurred because (i) providing glutamine as the nitrogen source eliminates the need for Msx-inhibited glutamine synthetase, and/or (ii) glutamine provided in the medium inhibits Msx uptake.
Figure 6.

Sit4 requirement for nuclear localization of Gln3-Myc13 following rapamycin- (Rap) or Msx- (Msx) treatment decreases with nitrogen sources of decreasing from good to poor quality. The nitrogen source(s) are indicated in the panels along with the inhibitor treatments and pertinent genotype of the cells used; strains were the same as in Fig. 5.
In contrast, Gln3-Myc13 localization successively shifted in Msx-treated cells from cytoplasmic to nuclear-cytoplasmic to nuclear first in the wild type and then in the sit4Δ as the nitrogen source changed from glutamine (Fig. 6A) to YPD (Fig. 6B) to ammonia (Fig. 6C) to proline (Fig. 6D). Note that a similar but less pronounced shift occurred after rapamycin treatment in ammonia- vs. proline-grown cells (Fig. 6 C and D). The same results were observed in the sit4Δpph3Δ double mutant (Fig. 6E). These data suggested that Msx and rapamycin-induced Gln3-Myc13 localization exhibited a nitrogen source-dependent Sit4 requirement which paralleled that of NCR, i.e., the more severe the NCR, the greater the Sit4-requirement. However, even in proline-grown cells, a limited Sit4-requirement remained (Fig. 6D, Gln3-Myc13 was cytoplasmic in ~37% of the rapamycin-treated cells), which decreased further if pph3 was also deleted (Fig. 6E, Gln3-Myc13 was cytoplasmic in ~26 % of the rapamycin-treated cells).
Strain-dependent effects of sit4 mutations
Reports reaching differing conclusions with respect to Tap42 and Sit4 participation in the regulation of NCR-sensitive transcription have appeared (14, 15). The data presented above suggested that intracellular localization profiles of Gln3-Myc13 might differ from one strain to another as a result of strain-dependent differences in nitrogen catabolism and/or sensitivity to NCR analogous to those reported in earlier studies (28, 39). We decided to test this hypothesis by comparing the intracellular distribution of Gln3-Myc13 in two genetic backgrounds, TB123 (the background in which the Sit4 requirement was first reported (14)) and BY4709 (from the yeast genome deletion project (32)). Gln3-Myc13 localization following rapamycin-treatment of glutamine-grown wild type and sit4Δ strains were independent of the genetic background (Fig. 7A). In YNB-ammonia medium, Gln3-Myc13 localization shifted from the cytoplasm to the nuclei of Msx-treated cells in both genetic backgrounds (Fig. 7B). Additionally, Gln3-Myc13 was more nuclear-cytoplasmic in untreated ammonia-grown BY4709-derived than TB123-derived cells. An even more striking difference occurred when cells were grown in YNB-proline medium (Fig. 7C). In a TB123 genetic background, Gln3-Myc13 localization in proline medium required Sit4, whereas in a BY4709 background no such requirement was observed.
Figure 7.

Strain background and nitrogen source dependence of intracellular Gln3-Myc13 distribution observed in wild type (TB123 and FV017) and sit4Δ (TB136 and FV1) cells. Culture conditions were as in Figs. 5 and 6.
A clear difference between the TB123 and BY4709 genetic backgrounds is an rme1 mutation present in the former strain but not in the latter. To determine whether this mutation accounted for the two strains’ strikingly different Sit4 requirements with proline as nitrogen source, we transformed TB123 and sit4Δpph3Δ (FV4) strains with CEN-plasmid yCplac22-RME1. Untransformed strains and corresponding transformants were grown in glutamine, glutamine + rapamycin, and proline media and Gln3-Myc13 localization measured. Gln3-Myc13 localization in the transformants was not detectably different from that observed in the untransformed recipients (data not shown). These observations argued that the rme1 mutation did not account for differing Gln3-Myc13 distributions observed in the two genetic backgrounds.
Together, data presented above demonstrate the extent to which Sit4 is required for inhibitor-induced nuclear localization of Gln3-Myc13 qualitatively correlates with the degree of NCR elicited by the nitrogen source provided to the cells. The Sit4 requirement was greater with repressive nitrogen sources than with those that were non-repressive. This also occurs for rapamycin-induced Gln3-Myc13 nuclear localization. At face value, the data are more consistent with the suggestion that the cellular signal generated in response to its nitrogen supply is situated at or below the level of Sit4 function because a poor nitrogen source, such as proline, decreased and completely bypassed the requirement for Sit4 in the TB123 and BY4709 genetic backgrounds, respectively. Alternatively, Sit4 and the nitrogen signal that influenced Gln3 localization derived from separate branches of the regulatory pathway.
Gln3-Myc13 phosphorylation/dephosphorylation in wild type and type-2A-related phosphatase defective strains
Data in Fig. 3 demonstrated that Sit4 is clearly active and influences Gln3-Myc13 dephosphorylation levels even in cultures growing with a good nitrogen source, glutamine. We reasoned that deleting the cognate gene of an enzyme whose activity was reported to be inactivated in the model describing Tor1,2 regulation of Gln3 would not be expected, in the most straightforward case, to detectably affect Gln3-Myc13 phosphorylation levels. This reasoning and the Gln3-Myc13 nitrogen source-dependent distribution data described above prompted us to determine the relationship between Gln3-Myc13 localization, Gln3-Myc13 phosphorylation, and the nitrogen source provided to wild type and mutant cells.
Investigating these relationships, we found that Gln3-Myc13 was almost uniformly cytoplasmic in a sit4Δ (TB123 genetic background) irrespective of the nitrogen source provided (Fig. 8A). Only in proline medium was Gln3-Myc13 minimally (~10%) nuclear-cytoplasmic. In contrast, Gln3-Myc13 phosphorylation varied greatly in the sit4Δ (Fig. 8B). It was lowest in ammonia- (lane C) or proline- (lane B) grown sit4Δ cells and reached its highest levels with glutamine (lane D) or YPD (lane E) as nitrogen source (Fig. 8B). The relationship was just opposite that observed when a parallel experiment was performed several years ago using wild type cells (26). In that case, Gln3-Myc13 intracellular localization ranged from completely cytoplasmic with glutamine to nuclear with proline, while Gln3-Myc13 was almost uniformly phosphorylated (Fig. 3 ref. 26). Although Gln3-Myc13 phosphorylation changed with the nitrogen source in a sit4Δ, these changes did not correlate with whether the nitrogen source was a good or poor one. If it had, then the Gln3-Myc13 phopshorylation profile observed with ammonia as nitrogen source should have been more similar to that observed with glutamine than with proline (Fig. 8B).
Figure 8.
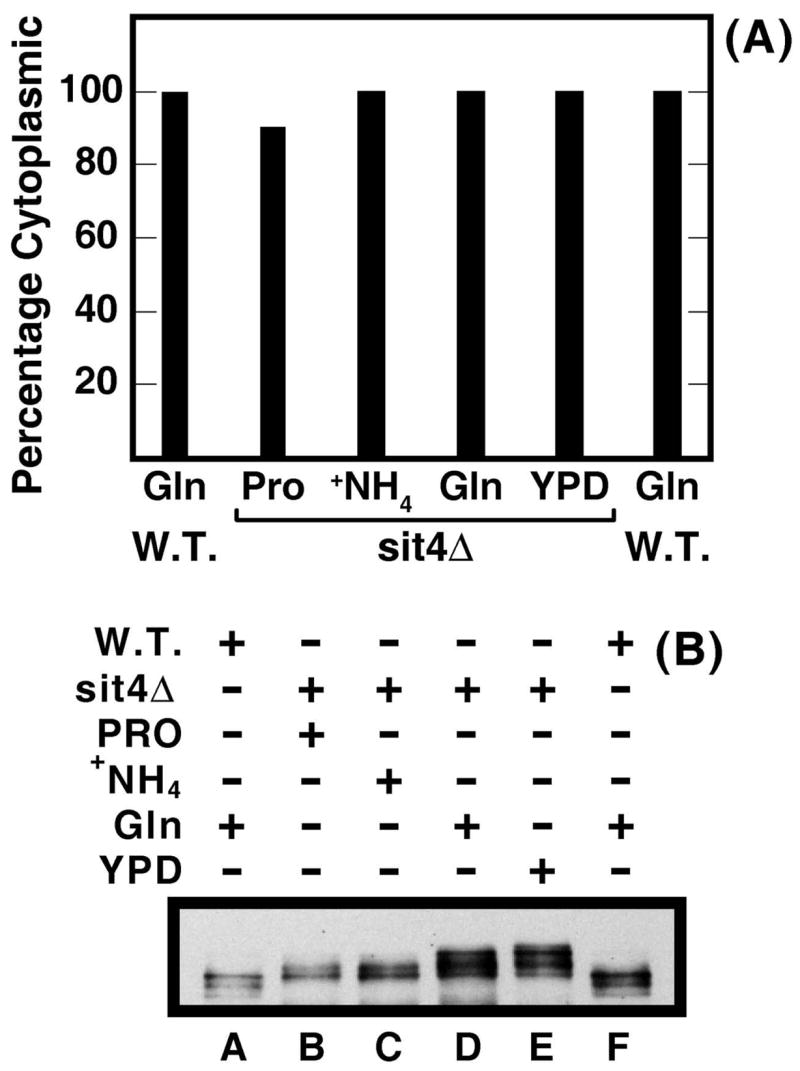
Nitrogen source dependent Gln3-Myc13 phosphorylation occurs in a sit4Δ mutant. Panel A. Percent of wild type (W.T.; TB123) or sit4Δ (TB136) cells in which Gln3-Myc13 is cytoplasmic. The cells were grown in YNB-medium with the indicated nitrogen sources [glutamine (Gln), proline (Pro), ammonia (+NH4)] or in and complex YPD (YPD) medium. Panel B. Western blot analysis of Gln3-Myc13 phosphorylation in wild type and sit4Δ cells cultured as described in panel A.
The above data convincingly demonstrated Gln3-Myc13 was phosphorylated to different extents in sit4Δ cells provided with various nitrogen sources, but did not distinguish whether it was sit4Δ or the nitrogen source that altered Gln3-Myc13 phosphorylation. Therefore, we compared Gln3-Myc13 phosphorylation in wild type and sit4Δ cells cultured under various conditions. Deletion of SIT4 increased Gln3-Myc13 phosphorylation irrespective of the nitrogen source provided (Fig. 9A–D, lanes A and B, note the black dots between lanes A and B). These effects appeared in one or both of two ways: (i) disappearance of a faster migrating species and/or appearance of a slower migrating Gln3-Myc13 species (Fig. 9A, B, and D, lanes A and B), or (ii) a shift in the relative amounts of Gln3-Myc13 species, with a slower mobility species increasing and the faster migrating species decreasing (Fig. 9A, B, and D).
Figure 9.
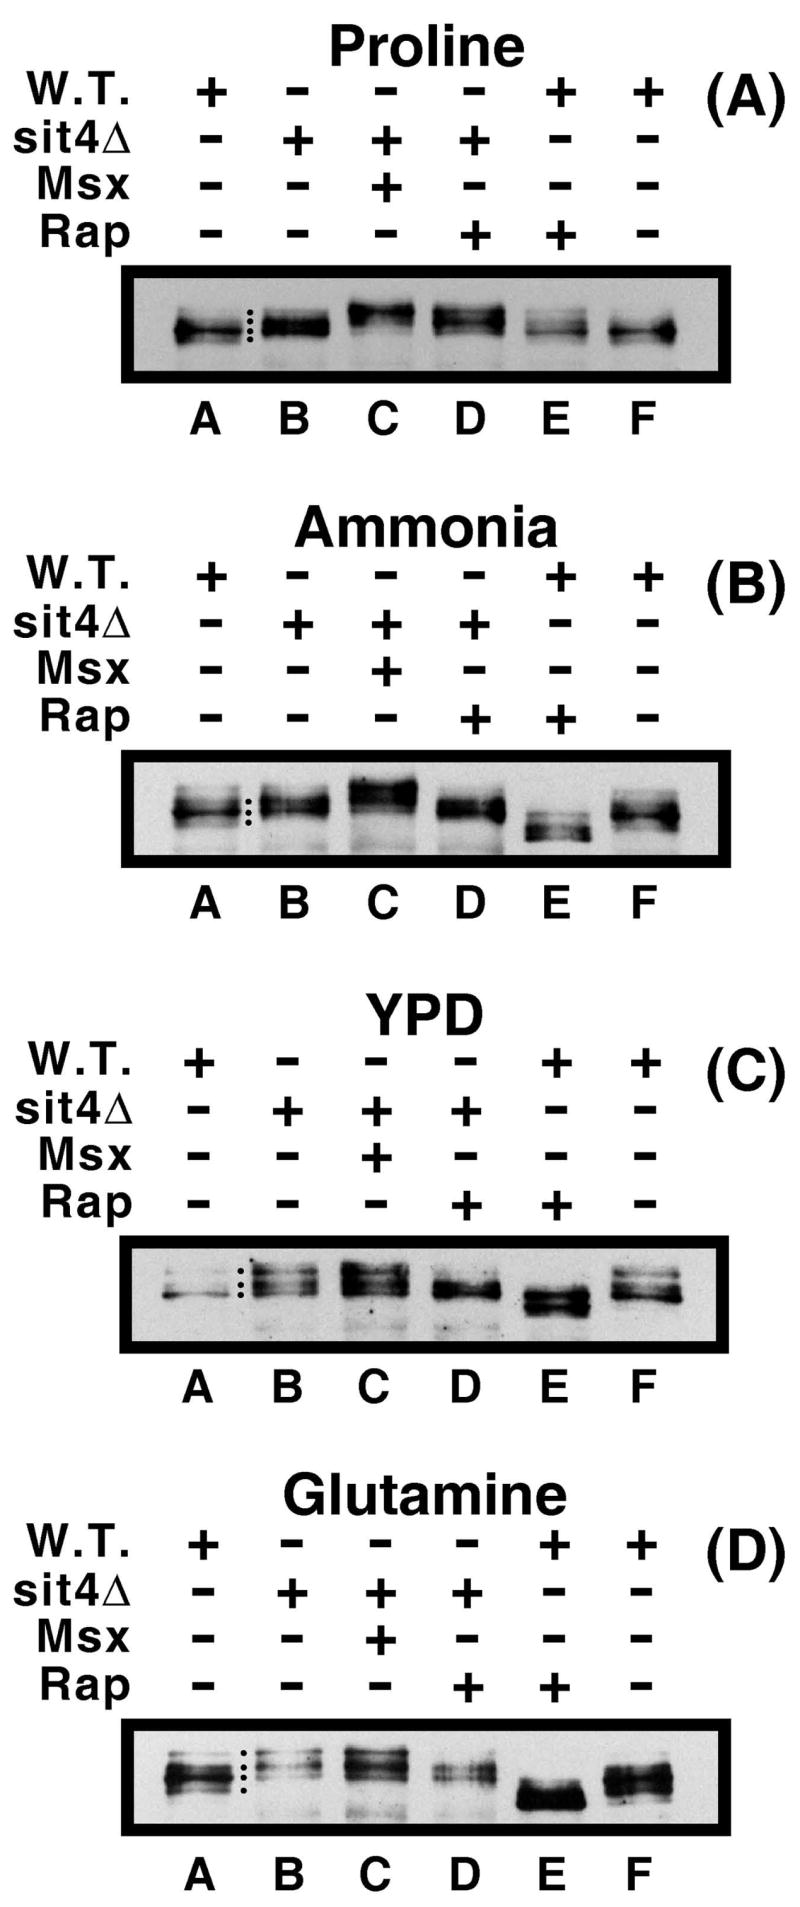
Sit4 is active with respect to Gln3-Myc13 phosphorylation irrespective of the nitrogen source. Western blot analyses of Gln3-Myc13 phosphorylation in wild type (W.T.; TB123) and sit4Δ (TB136) grown in the presence (+) or absence (−) of rapamycin (+Rap) or Msx (+Msx) as described in Materials and Methods. The nitrogen source in which each experiment was conducted is indicated above the blots.
We next determined whether the nitrogen source affected rapamycin- or Msx-mediated changes in Gln3-Myc13 phosphorylation in a sit4Δ. If both Msx and rapamycin act at or above the level of Tor1,2 in the regulatory pathway (22), and hence above the level of Sit4 dephosphorylation of Gln3-Myc13 (14) then the loss of Sit4 should eliminate responses to the inhibitor-generated signals in parallel and irrespective of the nitrogen source provided. On the other hand, if this is not the case, loss of Sit4 would not be expected to cause such uniform changes in Gln3-Myc13 phosphorylation levels. Treating a sit4Δ with Msx increased Gln3-Myc13 phosphorylation in both ammonia- and proline-grown cells (Fig. 9A and B, lanes B and C). Increased Gln3-Myc13 phosphorylation was not observed with YPD- or glutamine-grown sit4Δ cells (Fig. 9C and D, lanes B and C). When evaluating these results, however, it is important to keep two things in mind: (i) Msx is reported (and we have confirmed) to be ineffective in wild type, glutamine-grown cells (22, 27). On the other hand, the inhibitor shifted Gln3-Myc13 localization from cytoplasmic to nuclear-cytoplasmic and nuclear in wild type YPD-grown cells indicating that it did function in this medium. (ii) Gln3-Myc13 was already highly phosphorylated in glutamine and YPD grown cells. Such high levels of Gln3-Myc13 phosphorylation at the outset may have masked whatever effects that might have occurred when the ability to dephosphorylate Gln3-Myc13 was lost in the sit4Δ. In sum, the level of Gln3-Myc13 phosphorylation either remained the same or increased following Msx-treatment of a sit4Δ. This compares with increased Gln3-Myc13 phosphorylation observed upon Msx-treatment of wild type cells regardless of the nitrogen source.
The responses of Gln3-Myc13 phosphorylation in rapamycin-treated, sit4Δ cells did not parallel the effects described above. First, in the sit4Δ, rapamycin did not elicit as extensive dephosphorylation of Gln3-Myc13 as in wild type cells, where treating cells with rapamycin or cell extracts with calf intestinal alkaline phosphatase yield similarly dephosphorylated Gln3-Myc13 species (Fig. 4A of ref. 26). This is easily observed comparing the wild type and sit4Δ Gln3-Myc13 profiles (Fig. 9B–D, lanes D and E). On the other hand, rapamycin clearly caused some Gln3-Myc13 dephosphorylation in YPD- and glutamine-grown sit4Δ cells (Fig. 9C and D, lanes B and D). Rapamycin-induced Gln3-Myc13 dephosphorylation was not apparent in an ammonia-grown sit4Δ (Fig. 9B, lanes B and D), and Gln3-Myc13 phosphorylation actually increased in proline-grown sit4Δ as previously observed in wild type cells (Fig. 9A, lanes B and D and in Fig. 4D of ref 27). In sum, Gln3-Myc13 phosphorylation following rapamycin-treatment decreased, remained unchanged, or increased depending upon the nitrogen source used.
It was not difficult to envision that Gln3-Myc13 dephosphorylation noted above in a sit4Δ might derive from the closely related Pph3 phosphatase. To evaluate this possibility we assayed Gln3-Myc13 phosphorylation in pph3Δ single and sit4Δpph3Δ double mutants. As shown in Fig. 10A, the Gln3-Myc13 phosphorylation profiles in untreated as well as rapamycin and Msx-treated pph3Δ cells were indistinguishable from wild type. This parallels the results observed with Gln3-Myc13 intracellular localization (Fig. 5). In addition, the sit4Δpph3Δ double mutant possessed a phenotype that was indistinguishable from that of a sit4Δ both with respect to the effects elicited by nitrogen source and the two inhibitors (Fig. 10B).
Figure 10.
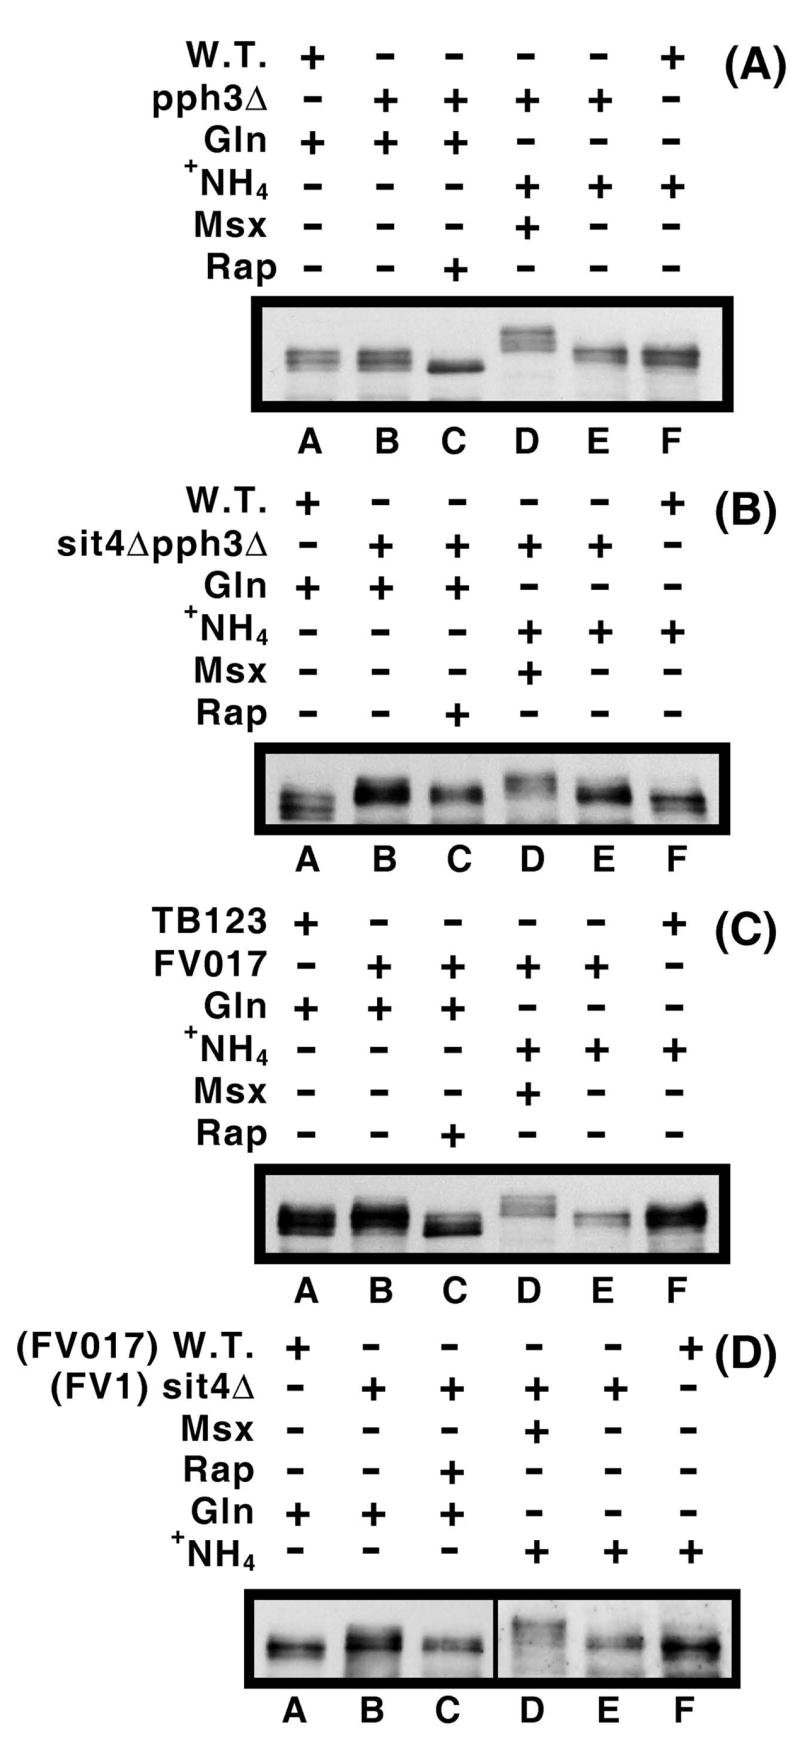
Panels A and B. Effects of defects in phosphatase Pph3 on Gln3 phosphorylation. Wild type (W.T. TB123), pph3Δ (FV3) and sit4Δpph3Δ (FV4) were grown in YNB-glutamine (Gln) or –ammonia (+NH4) medium in the presence or absence of rapamycin or Msx. They followed the same format and conditions as described in Fig. 9. Panels C and D. Effects of the genetic background on Gln3-Myc13 phosphorylation. Strains used in these experiments were derived from JK9-3a (TB123) or BY4709 (FV017) and sit4Δ (FV1). The experimental format and conditions were as described in Fig. 9.
Influence of genetic background on Gln3-Myc13 phosphorylation
Differences in intracellular Gln3-Myc13 distribution in different strains, especially in untreated, ammonia-grown wild type and proline-grown sit4Δ cells prompted us to ascertain whether these differences correlated with parallel variations in Gln3-Myc13 phosphorylation. The overall Gln3-Myc13 phosphorylation profiles were similar, though not identical in wild type cells from a TB123 vs. BY4709 genetic background (Fig. 10C). There was overall greater Gln3-Myc13 phosphorylation in the BY4709 background. This is observed as: (i) a slight increase in the upper-most and decrease in the lower-most Gln3-Myc13 species in ammonia-grown FV017 (BY4709) cells (Fig. 10C, lanes E vs. F), or (ii) the appearance of a slower migrating species (Fig. 10C, lanes A vs. B), and a decrease in the fastest migrating species in glutamine-grown BY4709 cells (lanes A and B) relative to results in the TB123 background. Similarly, rapamycin induced Gln3-Myc13 dephosphorylation in FV017 (BY4709), but not to the level observed earlier for TB123. Compare the relative positions of Gln3-Myc13 species in Fig. 9D, lanes E and F with those in Fig. 10C, lanes A and C, i.e., the positions in TB123 + rapamycin (Fig. 9) and FV017 + rapamycin (Fig. 10) relative to the positions in untreated TB123. The increased percentage of untreated, ammonia-grown FV017 (BY4709) cells containing nuclear-cytoplasmic Gln3-Myc13 relative to TB123 (Fig. 7B) was not paralleled by decreased Gln3-Myc13 phosphorylation as would be expected from the current model describing Tor1,2 regulation of Gln3. If anything, Gln3-Myc13 phosphorylation remained the same or increased modestly in the BY4709 background (Fig10C, lanes A and B and E and F).
Changes in Gln3-Myc13 phosphorylation resulting from the deletion of SIT4 in the BY4709 genetic background were the same as those in the TB123 background. However, this experiment again emphasized another difference in the behavior of Gln3-Myc13 in the two genetic backgrounds, i.e., a significant decrease in the amount of detectable Gln3-Myc13 observed in ammonia-grown BY4709 wild type and sit4Δ cells. This necessitated the use of longer exposures during development of the western blot depicted in Fig. 10D (lanes D–F) even though all six lanes were derived from a single membrane. A similarly diminished Gln3-Myc13 signal also occurred in Fig. 10C, lanes D and E.
Our last objective was to compare the phosphorylation profiles of proline-grown sit4Δ cells in the TB123 and BY4709 genetic backgrounds, because nuclear localization of Gln3-Myc13 was Sit4-dependent in the former and Sit4-independent in the latter (Fig. 7C). To this end, we repeated the experiment described in Fig. 9A using wild type (FV017) and sit4Δ (FV1) strains. Unfortunately, the Gln3-Myc13 signals were so diminished and of such poor quality that our observations can be considered only tentative at best. That said, we were unable to detect a difference between the phosphorylation of Gln3-Myc13 in the proline-grown wild type (FV017) and sit4Δ (FV1) strains. We could, however, detect modestly increased Gln3-Myc13 phosphorylation upon addition of rapamycin to the sit4Δ culture similar to that observed in the TB123 genetic background in Fig. 9A, lanes B and D (data not shown). In sum, although there were modest differences in the phosphorylation profiles observed in the TB123 and BY4709 genetic backgrounds, none of them appeared as drastic as the differences observed in intracellular Gln3-Myc13 distribution in the two strains.
DISCUSSION
This work was undertaken to gain a better understanding of how the type-2A-related protein phosphatases, Sit4 and Pph3, participate in the regulation of Gln3 phosphorylation and intracellular localization. Conceptually, we expected these enzymes - being multi-functional - would be active towards one or another substrate under most conditions. The pivotal question was whether they were specifically active with respect to Gln3 phosphorylation in a nitrogen source-dependent manner. In other words, was the extent of Gln3 phos-phorylation dictated by the degree to which a nitrogen source resulted in active vs. inactive Sit4 and Pph3? For Pph3, we were unable to demonstrate an active role in Gln3 control, i.e., detectable Gln3-Myc13 phosphorylation and intracellular localization were minimally if at all affected by deleting PPH3. Sit4, on the other hand, clearly influenced Gln3-Myc13 phosphorylation levels, but did not do so in a nitrogen source-dependent manner as expected. Deleting SIT4 increased Gln3-Myc13 phosphorylation irrespective of the nitrogen source provided. Sit4 was active with all nitrogen sources, and most importantly, with nitrogen sources that are the most repressive for NCR-sensitive transcription. In fact, differences in Gln3-Myc13 phosphorylation observed when comparing wild type and a sit4Δ were greatest with good nitrogen sources such as glutamine or in YPD medium, conditions where Sit4 would have been expected to be least active and therefore a sit4Δ to have the least effect. These results are just opposite of predictions emanating from the idea that Tor1,2, Tap42, and/or Tip41 control Gln3 phosphorylation and localization by regulating Sit4 activity (14, 20).
A second experimental finding, which pointed to a less direct role for Sit4 in Gln3 regulation, was its declining requirement for rapamycin- and Msx-induced nuclear Gln3 localization in response to the quality of the nitrogen source, i.e., good vs. poor (Fig. 6). Under the current view of Tor1,2 control, Sit4 is posited to be most active following loss of the positive nitrogen signal activating Tor1,2. The positive signal (glutamine or one of its metabolites) is lost when cells are provided with a poor nitrogen source, treating them with Msx, or inhibiting Tor1,2 itself with rapamycin. Therefore, Sit4 activity, and hence its requirement for nuclear Gln3-Myc13 localization, should increase as the quality of available nitrogen decreases. In contrast to these predictions, the Sit4 requirement for Msx-induced nuclear localization of Gln3 disappears as one moves from YPD to ammonia or proline media. Analogously, the Sit4-requirement is significantly reduced for rapamycin-induced nuclear Gln3 localization in proline-grown cells, i.e., Gln3 is nuclear-cytoplasmic or nuclear in the majority of rapamycin-treated sit4Δ (~60%) or sit4Δpph3Δ (~75%) cells (Fig. 6D and E). In other words, the poorer the nitrogen source the less Sit4 is required for nuclear Gln3-Myc13 localization.
Our data, describing a relationship between nitrogen source, strain background, and Sit4 requirement for Gln3-Myc13 localization, are consistent with some studies finding a Tap42-Sit4 requirement for Gln3 control (14), while others do not (15). We observed, for example, that Sit4 is necessary for Gln3 to accumulate in the nuclei of proline-grown cells in the TB123 genetic background, but not for BY4709-derived cells (Fig. 7C). Correlating with this loss of requirement, BY4709-derived FV017 is less NCR-sensitive than TB123 with at least ammonia as nitrogen source. Whether this correlation derives from a cause-effect relationship between the strains and nitrogen source provided or alternatively from an unrelated event, cannot be ascertained at present. Further, existing data do not permit us to evaluate whether the lack of difference in Gln3-Myc13 phosphorylation profiles observed for the two strains derives from phosphorylation/dephosphorylation events that might exist, but are not detected in a total phosphorylation profile.
The decreasing Sit4 requirement in glutamine vs. ammonia vs. proline medium adds to a growing list of situations in which the effects of the nitrogen source and NCR control appear to feed into the regulation of Gln3 dowstream of Tor1,2 and its inhibition by rapamycin. This relation of the nitrogen signal to Tor1,2 is also consistent with the observations that Sit4 is not required for Msx-induced nuclear localization of Gln3-Myc13. They join the earlier observation that Tor1,2 control of retrograde gene expression is also nitrogen source-dependent in that the ability of rapamycin to induce retrograde gene expression (CIT2 is the reporter) occurs with glutamine as nitrogen source, but not proline (28, 40). The separability of retrograde regulation from Tor1,2 activity has been recently confirmed by Giannattasio et al. (41). It is important to note, however, that while these observations support the contention of a nitrogen source-derived signal feeding into the Gln3 regulatory pathway downstream of the rapamycin-inhibited step, they do not exclude a more complicated possibility hypothesizing the existence of two nitrogen signals, one impinging on regulation above the rapamycin-inhibited step and the other below it.
Our investigations identify an interesting set of relationships that offer insights into the nitrogen-responsive control pathway. Earlier studies reported the only time that demonstrable dephosphorylation of Gln3-Myc13 correlated with its nuclear localization was shortly after treating cells with rapamycin (26). In ammonia- or glutamine-grown wild type cells, Gln3-Myc13 was cytoplasmic and in proline-grown cells it was nuclear. Yet Gln3-Myc13 was almost uniformly phosphorylated; Gln3-Myc13 was slightly more phosphorylated with proline than with ammonia or glutamine as nitrogen source (26, 27). In present studies, just the opposite occurred, i.e., Gln3-Myc13 was cytoplasmic in the sit4 mutant regardless of whether the nitrogen source was good or poor (Fig. 8). However, Gln3-Myc13 phosphorylation levels responded markedly to the nitrogen source provided. In other words, deleting SIT4 unmasked the response of Gln3-Myc13 phosphorylation to the nitrogen source. This is the first time Gln3 phosphorylation has been shown to be associated with a nitrogen source provided to the cells. If Sit4 was the molecule responsible for dephosphorylating Gln3-Myc13 in response to nitrogen source, then the nitrogen source-dependent signal would a priori have been expected to be lost when SIT4 was deleted. This suggests that the nitrogen source specificity of NCR-control is probably more directly connected to the response of one or more protein kinases responsible for Gln3-Myc13 phosphorylation than to the type-2A-related protein phosphatases (Sit4 and Pph3).
By this reasoning, Gln3 phosphorylation would occur in the presence of nitrogen source-independent Sit4 phosphatase activity, the latter buffering or masking the effects of nitrogen source-responsive phosphorylation from being observed. Here, type-2A-related phosphatases rather than generating the signal that results in Gln3-Myc13 accumulating in the nucleus, would serve a stabilizing role to reset the system in preparation to receive such signals. In this model, the observed Gln3-Myc13 phosphorylation would derive from the ratio of kinase to phosphatase activities acting on Gln3, the former being the one predominantly modulated by the nitrogen source provided.
Although the above ideas would explain Gln3 phosphorylation and localization in the sit4Δ, present data are insufficient to provide details of the precise link(s) between the nitrogen source, observable Gln3 phosphorylation levels and NCR-sensitive transcription. For example, they do not exclude the possibility that a nitrogen source may regulate NCR-sensitive transcription via influencing Gln3 binding to the DNA in addition to controlling its intracellular localization. Further, they do not identify the physiological advantage gained when functional Sit4 brings Gln3-Myc13 phosphorylation to the same level irrespective of the nitrogen source provided and the intracellular localization of Gln3-Myc13. And finally, they are also insufficient to distinguish the possibility that Gln3-Myc13 phosphorylation increases in a sit4Δ because Sit4 phosphatase is no longer dephosphorylating Gln3-Myc13 from the alternative that loss of Sit4 activity increases protein kinase activity which in turn increases Gln3-Myc13 phosphorylation.
Data presented in Fig. 8 also indicate that loss of Sit4 and Pph3 activities are not sufficient to abrogate the influence of Tor1,2 on Gln3-Myc13 phosphorylation level. Addition of rapamycin to YPD- glutamine- or ammonia-grown sit4Δ cells clearly decreases Gln3-Myc13 phosphorylation. The most likely candidates to mediate this dephosphorylation are Pph21 and Pph22 (19, 26, 41). Although we have not yet investigated the roles of Pph21 and Pph22 in the regulation of Gln3 due to technical difficulties derived from the severe growth defect and other difficult phenotypes of the pph21,22 mutations, the relationships are unlikely to be straightforward. One expression of this expectation is the fact that although rapamycin induced dephosphorylation of Gln3-Myc13 in the sit4Δ, i.e., a strain in which Pph3, Pph21 and Pph22 are all functional, it did not induce its nuclear localization with any of the good nitrogen sources. Further, treating cells with Msx increases Gln3-Myc13 phosphorylation and yet results in nuclear localization of Gln3-Myc13 (27).
Acknowledgments
We thank Dr. Michael Hall for strains, Drs. Florian Bauer and Dewald van Dyk for the RME1 plasmid, Fabienne Vierendeels for her excellent technical assistance, Tim Higgins for preparing the artwork, and UT Yeast Groups for suggestions to improve the manuscript. This work was supported by NIH grant GM-35642 and NSF collaborative grant DMS-0443855 to T.G.C. and by a grant from COCOF (Commission de la Communauté française) to E.D.
References
- 1.Schluter M, Schofer J. Am Heart Hosp J. 2005;3:182–186. doi: 10.1111/j.1541-9215.2005.04407.x. [DOI] [PubMed] [Google Scholar]
- 2.Boulay A, Rudloff J, Ye J, Zumstein-Mecker S, O’Reilly T, Evans DB, Chen S, Lane HA. Clin Cancer Res. 2005;11:5319–5328. doi: 10.1158/1078-0432.CCR-04-2402. [DOI] [PubMed] [Google Scholar]
- 3.Morgensztern D, McLeod HL. Anticancer Drugs. 2005;16:797–803. doi: 10.1097/01.cad.0000173476.67239.3b. [DOI] [PubMed] [Google Scholar]
- 4.Lorber MI, Mulgaonkar S, Butt KM, Elkhammas E, Mendez R, Rajagopalan PR, Kahan B, Sollinger H, Li Y, Cretin N, Tedesco H B251 Study Group. Transplantation. 2005;80:244–252. doi: 10.1097/01.tp.0000164352.65613.24. [DOI] [PubMed] [Google Scholar]
- 5.Thomas G, Sabatini D, Hall MN. TOR: Target of Rapamycin: Current Topics in Microbiology & Immunology. Vol. 279. Springer-Verlag; Berlin: 2004. [Google Scholar]
- 6.Inoki K, Ouyang H, Li Y, Guan KL. Microbiol Mol Biol Rev. 69:79–100. doi: 10.1128/MMBR.69.1.79-100.2005. [DOI] [PMC free article] [PubMed] [Google Scholar]
- 7.Hofman-Bang J. Mol Biotechnol. 1999;12:35–73. doi: 10.1385/MB:12:1:35. [DOI] [PubMed] [Google Scholar]
- 8.ter Schure EG, van Riel NA, Verrips CT. FEMS Microbiol Rev. 2000;24:67–83. doi: 10.1111/j.1574-6976.2000.tb00533.x. [DOI] [PubMed] [Google Scholar]
- 9.Cooper TG. FEMS Microbiol Rev. 2002;26:223–238. doi: 10.1111/j.1574-6976.2002.tb00612.x. [DOI] [PMC free article] [PubMed] [Google Scholar]
- 10.Cooper TG. Integrated regulation of the nitrogen-carbon interface in Topics in Current Genetics. In: Winderickx J, Taylor PM, editors. Nutrient-Induced Responses in Eukaryotic Cells. Chapter 9. Vol. 7. Springer-Verlag; Berlin: 2004. pp. 225–257. [Google Scholar]
- 11.Magasanik B, Kaiser CA. Gene. 2002;290:1–18. doi: 10.1016/s0378-1119(02)00558-9. [DOI] [PubMed] [Google Scholar]
- 12.Cox KH, Rai R, Distler M, Daugherty JR, Coffman JA, Cooper TG. J Biol Chem. 2000;275:17611–17618. doi: 10.1074/jbc.M001648200. [DOI] [PMC free article] [PubMed] [Google Scholar]
- 13.Cunningham TS, Andhare R, Cooper TG. J Biol Chem. 2000;275:14408–14414. doi: 10.1074/jbc.275.19.14408. [DOI] [PMC free article] [PubMed] [Google Scholar]
- 14.Beck T, Hall MN. Nature. 1999;402:689–692. doi: 10.1038/45287. [DOI] [PubMed] [Google Scholar]
- 15.Cardenas ME, Cutler NS, Lorenz MC, Di Como CJ, Heitman J. Genes Dev. 1999;13:3271–3279. doi: 10.1101/gad.13.24.3271. [DOI] [PMC free article] [PubMed] [Google Scholar]
- 16.Hardwick JS, Kuruvilla FG, Tong JK, Shamji AF, Schreiber SL. Proc Natl Acad Sci U S A. 1999;96:14866–14870. doi: 10.1073/pnas.96.26.14866. [DOI] [PMC free article] [PubMed] [Google Scholar]
- 17.Bertram PG, Choi JH, Carvalho J, Ai W, Zeng C, Chan TF, Zheng XF. J Biol Chem. 2000;275:35727–35733. doi: 10.1074/jbc.M004235200. [DOI] [PubMed] [Google Scholar]
- 18.Di Como CJ, Arndt KT. Genes Dev. 1996;10:1904–1916. doi: 10.1101/gad.10.15.1904. [DOI] [PubMed] [Google Scholar]
- 19.Jiang Y, Broach JR. EMBO J. 1999;18:2782–2792. doi: 10.1093/emboj/18.10.2782. [DOI] [PMC free article] [PubMed] [Google Scholar]
- 20.Jacinto E, Guo B, Arndt KT, Schmelzle T, Hall MN. Mol Cell. 2001;8:1017–1026. doi: 10.1016/s1097-2765(01)00386-0. [DOI] [PubMed] [Google Scholar]
- 21.Rohde JR, Campbell S, Zurita-Martinez SA, Cutler NS, Ashe M, Cardenas ME. Mol Cell Biol. 2004;24:8332–8341. doi: 10.1128/MCB.24.19.8332-8341.2004. [DOI] [PMC free article] [PubMed] [Google Scholar]
- 22.Crespo JL, Powers T, Fowler B, Hall MN. Proc Natl Acad Sci U S A. 2002;99:6784–6789. doi: 10.1073/pnas.102687599. [DOI] [PMC free article] [PubMed] [Google Scholar]
- 23.Magasanik B. Proc Natl Acad Sci USA 2005. 2005;102:16537–16538. doi: 10.1073/pnas.0507116102. [DOI] [PMC free article] [PubMed] [Google Scholar]
- 24.Duvel K, Santhanam A, Garrett S, Schneper L, Broach JR. Mol Cell. 2003;11:1467–1478. doi: 10.1016/s1097-2765(03)00228-4. [DOI] [PubMed] [Google Scholar]
- 25.Wang H, Wang X, Jiang Y. Mol Biol Cell. 2003;14:4342–4351. doi: 10.1091/mbc.E03-02-0072. [DOI] [PMC free article] [PubMed] [Google Scholar]
- 26.Cox KH, Kulkarni A, Tate JJ, Cooper TG. J Biol Chem. 2004;279:10270–10278. doi: 10.1074/jbc.M312023200. [DOI] [PMC free article] [PubMed] [Google Scholar]
- 27.Tate JJ, Rai R, Cooper TG. J Biol Chem. 2005;280:27195–27204. doi: 10.1074/jbc.M504052200. [DOI] [PMC free article] [PubMed] [Google Scholar]
- 28.Tate JJ, Cox KH, Rai R, Cooper TG. J Biol Chem. 277:20477–20482. doi: 10.1074/jbc.M200962200. [DOI] [PMC free article] [PubMed] [Google Scholar]
- 29.Dilova I, Powers T. FEMS Yeast Res. 2006;6:112–119. doi: 10.1111/j.1567-1364.2005.00008.x. [DOI] [PubMed] [Google Scholar]
- 30.Cox KH, Tate JJ, Cooper TG. J Biol Chem. 2002;277:37559–37566. doi: 10.1074/jbc.M204879200. [DOI] [PMC free article] [PubMed] [Google Scholar]
- 31.Cox KH, Tate JJ, Cooper TG. J Biol Chem. 2004;279:19294–19301. doi: 10.1074/jbc.M309240200. [DOI] [PMC free article] [PubMed] [Google Scholar]
- 32.Giaever G, Chu AM, Ni L, Connelly C, Riles L, Veronneau S, Dow S, Lucau-Danila A, Anderson K, Andre B, Arkin AP, Astromoff A, El-Bakkoury M, Bangham R, Benito R, Brachat S, Campanaro S, Curtiss M, Davis K, Deutschbauer A, Entian KD, Flaherty P, Foury F, Garfinkel DJ, Gerstein M, Gotte D, Guldener U, Hegemann JH, Hempel S, Herman Z, Jaramillo DF, Kelly DE, Kelly SL, Kotter P, LaBonte D, Lamb DC, Lan N, Liang H, Liao H, Liu L, Luo C, Lussier M, Mao R, Menard P, Ooi SL, Revuelta JL, Roberts CJ, Rose M, Ross-Macdonald P, Scherens B, Schimmack G, Shafer B, Shoemaker DD, Sookhai-Mahadeo S, Storms RK, Strathern JN, Valle G, Voet M, Volckaert G, Wang CY, Ward TR, Wilhelmy J, Winzeler EA, Yang Y, Yen G, Youngman E, Yu K, Bussey H, Boeke JD, Snyder M, Philippsen P, Davis RW, Johnston M. Nature. 2002;418:387–91. doi: 10.1038/nature00935. [DOI] [PubMed] [Google Scholar]
- 32a.Winzeler EA, Shoemaker DD, Astromoff A, Liang H, Anderson K, Andre B, Bangham R, Benito R, Boeke JD, Bussey H, Chu AM, Connelly C, Davis K, Dietrich F, Dow SW, El Bakkoury M, Foury F, Friend SH, Gentalen E, Giaever G, Hegemann JH, Jones T, Laub M, Liao H, Liebundguth N, Lockhart DJ, Lucau-Danila A, Lussier M, M’Rabet N, Menard P, Mittmann M, Pai C, Rebischung C, Revuelta JL, Riles L, Roberts CJ, Ross-MacDonald P, Scherens B, Snyder M, Sookhai-Mahadeo S, Storms RK, Veronneau S, Voet M, Volckaert G, Ward TR, Wysocki R, Yen GS, Yu K, Zimmermann K, Philippsen P, Johnston M, Davis RW. Science. 1999;285:901–906. doi: 10.1126/science.285.5429.901. [DOI] [PubMed] [Google Scholar]
- 33.Wach A. Yeast. 1996;12:259–265. doi: 10.1002/(SICI)1097-0061(19960315)12:3%3C259::AID-YEA901%3E3.0.CO;2-C. [DOI] [PubMed] [Google Scholar]
- 34.Schmitt ME, Brown TA, Trumpower BL. Nucleic Acids Res. 1990;18:3091–3092. doi: 10.1093/nar/18.10.3091. [DOI] [PMC free article] [PubMed] [Google Scholar]
- 35.Foury F, Talibi D. J Biol Chem. 2001;276:7762–7768. doi: 10.1074/jbc.M005804200. [DOI] [PubMed] [Google Scholar]
- 36.Sambrook J, Fristsch EF, Maniatis T. Molecular cloning: A laboratory manual. 2. New York: Cold Spring Harbor Laboratory Press; 1989. [Google Scholar]
- 37.Pringle JR, Adams AEM, Drubin DG, Haarer BK. Meth in Enzymol. 1991;194:565–602. doi: 10.1016/0076-6879(91)94043-c. [DOI] [PubMed] [Google Scholar]
- 38.Beck T, Schmidt A, Hall MN. J Cell Biol. 1999;146:1227–1238. doi: 10.1083/jcb.146.6.1227. [DOI] [PMC free article] [PubMed] [Google Scholar]
- 39.Tate JJ, Cooper TG. 2006 Submitted for Publication. [Google Scholar]
- 40.Tate JJ, Cooper TG. J Biol Chem. 2003;27:36924–36933. doi: 10.1074/jbc.M301829200. [DOI] [PMC free article] [PubMed] [Google Scholar]
- 41.Giannattasio S, Liu Z, Thornton J, Butow RA. J Biol Chem. 2005;280:42528–42535. doi: 10.1074/jbc.M509187200. [DOI] [PubMed] [Google Scholar]