Abstract
Mass spectrometric analysis of human plasma and urine revealed abundant nitrated derivatives of all principal unsaturated fatty acids. Nitrated palmitoleic, oleic, linoleic, linolenic, arachidonic and eicosapentaenoic acids were detected in concert with their nitrohydroxy derivatives. Two nitroalkene derivatives of the most prevalent fatty acid, oleic acid, were synthesized (9- and 10-nitro-9-cis-octadecenoic acid; OA-NO2), structurally characterized and determined to be identical to OA-NO2 found in plasma, red cells, and urine of healthy humans. These regioisomers of OA-NO2 were quantified in clinical samples using 13C isotope dilution. Plasma free and esterified OA-NO2 concentrations were 619 ± 52 and 302 ± 369 nM, respectively, and packed red blood cell free and esterified OA-NO2 was 59 ± 11 and 155 ± 65 nM. The OA-NO2 concentration of blood is ~50% greater than that of nitrated linoleic acid, with the combined free and esterified blood levels of these two fatty acid derivatives exceeding 1 μM. OA-NO2 is a potent ligand for peroxisome proliferator activated receptors at physiological concentrations. CV-1 cells co-transfected with the luciferase gene under peroxisome proliferator-activated receptor (PPAR) response element regulation, in concert with PPARγ, PPARα, or PPARδ expression plasmids, showed dose-dependent activation of all PPARs by OA-NO2. PPARγ showed the greatest response, with significant activation at 100 nM, while PPARα and PPARδ were activated at ~300 nM OA-NO2. OA-NO2 also induced PPARγ-dependent adipogenesis and deoxyglucose uptake in 3T3-L1 preadipocytes at a potency exceeding nitrolinoleic acid and rivaling synthetic thiazo-lidinediones. These data reveal that nitrated fatty acids comprise a class of nitric oxide-derived, receptor-dependent, cell signaling mediators that act within physiological concentration ranges.
The oxidation of unsaturated fatty acids converts lipids, otherwise serving as cellular metabolic precursors and structural components, into potent signaling molecules including prostaglandins, leukotrienes, isoprostanes, and hydroxy- and hydroperoxyeicosatetraenoates. These enzymatic and auto-catalytic oxidation reactions yield products that orchestrate immune responses, neurotransmission, and the regulation of cell growth. For example, prostaglandins are cyclooxygenase-derived lipid mediators that induce receptor-dependent regulation of inflammatory responses, vascular function, initiation of parturition, cell survival, and angiogenesis (1). In contrast, the various isoprostane products of arachidonic acid auto-oxidation exert vasoconstrictive and pro-inflammatory signaling actions via receptor-dependent and -independent mechanisms (2). A common element of these diverse lipid signaling reactions is that nitric oxide (•NO)6 and other oxides of nitrogen significantly impact lipid mediator formation and bioactivities.
The ability of •NO and •NO-derived species to oxidize, nitrosate, and nitrate biomolecules serves as the molecular basis for how •NO influences the synthesis and reactions of bioactive lipids (3–5). Interactions between •NO and lipid oxidation pathways are multifaceted and interdependent. For example, •NO regulates both the catalytic activity and gene expression of prostaglandin H synthase (6). Conversely, leukotriene products of lipoxygenases induce nitric-oxide synthase-2 expression and increase inflammatory •NO production (7). The free radical reactivity of •NO lends an ability to inhibit the autocatalytic chain propagation reactions of lipid peroxyl radicals during membrane and lipoprotein oxidation (8). Of relevance, reactions between •NO-derived species, unsaturated fatty acids, and lipid oxidation intermediates yield a spectrum of fatty acid oxidation and nitration products (3). Recently, the nitroalkene derivative of linoleic acid (LNO2) was detected in human blood at concentrations sufficient to induce biological responses (~500 nM; Refs. 9–12). Compared with other •NO-derived species such as nitrite ( ), nitrosothiols (RSNO), and heme-nitrosyl complexes, LNO2 alone represents the single most abundant pool of bioactive oxides of nitrogen in the healthy human vasculature (9, 13–16).
In vitro studies have shown that LNO2 mediates cGMP-dependent vascular relaxation, cGMP-independent inhibition of neutrophil degranulation and superoxide formation, and inhibition of platelet activation (10–12). Recently, LNO2 has been shown to exert cell signaling actions via ligation and activation of peroxisome proliferator-activated receptors (PPARs) (17), a class of nuclear hormone receptors that modulates the expression of metabolic, cellular differentiation, and inflammatory-related genes (18, 19).
The identification of the cell signaling actions of LNO2, which include (a) robust endogenous PPARγ ligand activity that acts within physiological concentrations (17), (b) an ability to decay in aqueous conditions to release •NO (20), and (c) reactivity as an electrophile, motivated a search for other nitrated fatty acids that might serve related signaling actions. Herein, we report that nitroalkene derivatives of all principal unsaturated fatty acids are present in human blood and urine. Of the fatty acid content in red cells, linoleic acid and oleic acid comprise ~8 and ~18% of total, respectively (21). Due to its prevalence and structural simplicity, oleic acid was evaluated as a potential candidate for nitration. The synthesis, structural characterization, and cell signaling activities of 9- and 10-nitro-9-cis-octadecaenoic acids are described (nitrated oleic acid, OA-NO2; Fig. 1). OA-NO2 regioisomers were measured in human blood and urine at levels exceeding those of LNO2. Furthermore, OA-NO2 activates PPARγ with a greater potency than LNO2. These data reveal that nitrated unsaturated fatty acids represent a class of lipid-derived, receptor-dependent signaling mediators.
FIGURE 1. Nitrated oleic acid (OA-NO2).
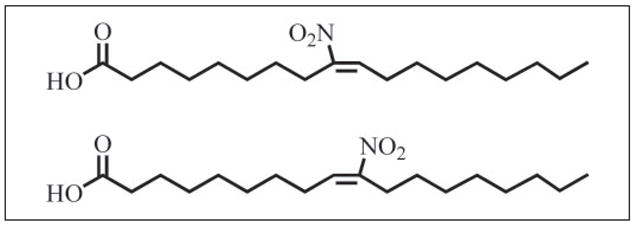
Two regioisomers of OA-NO2 were synthesized by nitrosenylation of oleic acid yielding 9- and 10-nitro-9-cis-octadecenoic acids.
MATERIALS AND METHODS
Materials
9-Octadecenoic acid (oleic acid) was purchased from Nu-Check Prep (Elysian, MN). [13C18]Oleic acid (>98% isotopic purity) was purchased from Cambridge Isotope Laboratories, Inc. (Andover, MA). OA-NO2 and [13C18]OA-NO2 were synthesized as described below. Phenylselenium bromide, HgCl2, NaNO2, anhydrous tetrahy-drofuran (THF), CH3CN, CDCl3, insulin, dexamethasone, and 3-isobutyl-1-methylxanthine were obtained from Sigma. Peroxynitrite (ONOO−) was prepared as described (22). Silica gel G and HF thin layer chromatography plates (250 and 2000 μm) were from Analtech (Newark, DE). Methanolic BF3, horseradish peroxidase-linked goat anti-rabbit IgG, and Coomasie Blue were from Pierce. Myeloperoxidase (MPO) derived from human polymorphonuclear leukocytes was obtained from Calbiochem. Synthetic solvents were of HPLC grade or better from Fisher Scientific. Solvents used for extractions and mass spectrometric analyses were from Burdick and Jackson (Muskegon, MI). Anti-PPARγ and anti-β-actin antibodies were from Santa Cruz Biotechnology (Santa Cruz, CA); anti-aP2 antibody was from Chemicon International Inc. (Temecula, CA).
Synthesis of OA-NO2
Oleic acid and [13C18]oleic acid were nitrated as described (9, 12), with modifications. Oleic acid, HgCl2, phenylselenium bromide, and NaNO2 (1:1.3:1:1, mol/mol) were combined in THF/acetonitrile (1:1, v/v) with a final concentration of 0.15 M oleic acid. The reaction mixture was stirred (4 h, 25 °C), followed by centrifugation to sediment the precipitate. The supernatant was recovered, the solvent evaporated in vacuo, the product mixture redissolved in THF (original volume), and the temperature reduced to 0 °C. A 10-fold molar excess of H2O2 was slowly added with stirring to the mixture, which was allowed to react in an ice bath for 20 min followed by a gradual warming to room temp (45 min). The product mixture was extracted with hexane, the organic phase collected, the solvent removed in vacuo, and lipid products solvated in CH3OH. OA-NO2 was isolated by preparative TLC using silica gel HF plates developed twice in a solvent system consisting of hexane/ether/acetic acid (70:30:1, v/v). The region of silica containing OA-NO2 was scraped and extracted (23). Based on this synthetic rationale, two regioisomers are generated: 9- and 10-nitro-9-cis-octadecenoic acids (generically termed OA-NO2). Preparative TLC does not adequately resolve the two isomers. [13C18]OA-NO2 was synthesized using [13C18]oleic acid as a reactant. All nitrated fatty acid stock solutions were diluted in MeOH, aliquoted, and stored under argon gas at −80 °C. Under these conditions, OA-NO2 isomers remain stable for >3 months.
The nitroalkene positional isomers are described as cis throughout this article based on the configuration of the carbon skeleton, which correlates the cis alkene stereochemistry in the nitroalkenes with the corresponding cis alkene stereochemistry in naturally occurring oleic acid. The IUPAC nomenclature of the nitroalkenes has the opposite stereochemical terminology, because it focuses on the relationship of the higher priority nitro group to the carbon substituents on the alkene. For example, the 9-nitro isomer has the carbon chains cis to each other on the nitroalkene, but the official IUPAC nomenclature designates this compound as E (or trans) because the nitro group on C-9 and the carbon chain on C-10 have the E (entgegen) or trans relationship to each other.
Quantitation of Synthetic OA-NO2
The concentrations of synthetic OA-NO2 stock solutions were determined using chemiluminescent nitrogen analysis (Antek Instruments, Houston, TX), a quantitative measure of nitrogen content in synthetic and biological samples (24, 25). Briefly, purified synthetic nitroalkene preparations were subjected to complete pyrolysis (>1000 °C). The nitrogen-containing OA-NO2 reacts with O2 to ultimately yield •NO at a ratio of one mole •NO for every mole of nitrogen present in OA-NO2. The generated •NO reacts with O3 to yield nitrogen dioxide (•NO2, O2, and hv, the latter of which is sensitively detected with a photomultiplier). Concentrations were calculated using caffeine as standard.
Stability of OA-NO2 and LNO2
The relative stabilities of OA-NO2 and LNO2 in MeOH and phosphate buffer (100 mM KiPO4 containing 100 μM DTPA, pH 7.4) were determined by electrospray ionization triple quadrupole mass spectrometry (ESI MS/MS) using the quantitative methodology detailed below. OA-NO2 and LNO2 (3 μM each) were incubated at 37 °C in either MeOH or phosphate buffer, and aliquots were taken over time. The aliquots were extracted as described (23), with 1 μM [13C18]LNO2 added during the monophase stage of the extraction procedure as an internal standard, and analyzed for non-degraded OA-NO2 and LNO2. In aqueous buffer, nitrated lipids degrade more rapidly than in organic solvents (20); thus, their stability in phosphate buffer was measured over 2 h. The stability of nitrated fatty acids solvated in MeOH at 37 °C was measured over the course of 1 month.
OA-NO2 Spectrophotometric Characterization
OA-NO2 stock solution concentrations derived from chemiluminescent nitrogen analysis were utilized to determine dilution concentrations for subsequent spectral analysis. An absorbance spectrum of OA-NO2 from 200–450 nm was generated using 23 μM OA-NO2 in phosphate buffer (100 mM, pH 7.4) containing 100 μM DTPA. The extinction coefficients (ε) for OA-NO2 and the isotopic derivative [13C18]OA-NO2 were measured (λ270) using a UV-visible spectrophotometer (Shimadzu, Japan). Absorbance values for increasing concentrations of OA-NO2 and [13C18]OA-NO2 were plotted against concentration to calculate ε.
NMR Spectrometric Analysis of OA-NO2
1H and 13C NMR spectra were acquired using a Varian INOVA 300 and a 500 MHz NMR and recorded in CDCl3. Chemical shifts are in δ units (ppm) and referenced to residual proton (7.26 ppm) or carbon (77.28 ppm) signals in deuterated chloroform. Coupling constants (J) are reported in Hertz (Hz).
Structural Characterization of OA-NO2 by ESI MS/MS
Qualitative analysis of OA-NO2 by ESI MS/MS was performed using a hybrid triple quadrupole-linear ion trap mass spectrometer (4000 Q trap, Applied Biosystems/MDS Sciex). To characterize synthetic and endogenous OA-NO2, a reverse-phase HPLC methodology was developed using a 150 × 2 mm C18 Phenomenex Luna column (3 μm particle size). Lipids were separated and eluted from the column using a gradient solvent system consisting of A (H2O containing 0.1% NH4OH) and B (CNCH3 containing 0.1% NH4OH) under the following conditions: 20–65% B (10 min); 65–95% B (1 min; hold for 3 min) and 95–20% B (1 min; hold for 3 min). OA-NO2 was detected using a multiple reaction monitoring (MRM) scan mode by reporting molecules that undergo a m/z 326/279 mass transition consistent with the loss of the nitro group ([M − (HNO2)]−). Concurrent with MRM determination, enhanced product ion analysis (EPI) was performed to generate characteristic and identifying fragmentation patterns of eluting species with a precursor mass of m/z 326. Zero grade air was used as source gas, and nitrogen was used in the collision chamber.
Red Blood Cell Isolation and Lipid Extraction
Peripheral blood from fasting, apparently healthy human volunteers was collected by venipuncture into heparinized tubes (UAB Institutional Review Board-approved protocol no. X040311001). Blood was centrifuged (1200 × g; 10 min), the buffy coat was removed, and erythrocytes were isolated. Lipid extracts were prepared from red cells and plasma and directly analyzed by mass spectrometry (23). Care was taken to avoid acidification during extraction to prevent artifactual lipid nitration due to the presence of endogenous nitrite (9). In experiments using urine as the biological specimen (UAB Institutional Review Board-approved protocol no. X040311003), extraction conditions were identical.
Detection and Quantitation of OA-NO2 in Human Blood and Urine
Quantitation of OA-NO2 in biological samples was performed as described (9), with modifications. Matched blood and urine samples were obtained after >8 h fasting; urine was collected from the first void of the day. During the monophase stage of the lipid extraction (23), [13C18]OA-NO2 was added as internal standard to correct for any losses. Nitrated fatty acids were then analyzed by HPLC ESI MS/MS in the negative ion mode. Lipids were eluted from the HPLC column using an isocratic solvent system consisting of CH3CN:H2O:NH4OH (85:15:0.1, v/v) so that the two OA-NO2 regioisomers co-elute. During quantitative analyses, two MRM transitions were monitored: m/z 326/279 (OA-NO2) and m/z 344/297 ([13C18]OA-NO2), transitions consistent with the loss of the nitro group from the respective precursor ions. The areas under each peak were integrated, the ratios of analyte to internal standard areas were determined, and OA-NO2 was quantitated using Analyst 1.4 quantitation software (Applied Biosystems/MDS Sciex). Data are expressed as mean ± S.D. (n = 10; 5 female and 5 male).
To address whether artifactual synthesis of OA-NO2 occurred during sample preparation and extraction, control studies were performed as described (9). Briefly, [13C18]oleic acid was added as a reporter molecule prior to red cell and plasma lipid purification and analysis, which permitted the MS detection of possible 13C-labeled OA-NO2 formation. Also, 200 μM was included in initial lipid extractions to determine whether separations or analysis-induced nitration reactions might be supported by physiological levels that can exceed 200 nM (14, 15). In no case did we detect artifactual nitration of oleic acid due to sample processing and analysis.
Qualitative Analysis of Nitro and Nitrohydroxy Adducts of Fatty Acids
Using HPLC ESI MS/MS in the negative ion mode, blood and urine samples were evaluated for the presence of nitroalkene derivatives other than LNO2. HPLC separations using the qualitative gradient elution methodology were performed similarly to those used to characterize OA-NO2, with some modifications. Alternative MRM transitions were used to detect other potential nitroalkene derivatives. Theoretical MRM transitions were determined for the CID-induced loss of the nitro group from nitrated palmitoleic (16:1-NO2), linolenic (18:3-NO2), arachidonic (20:4-NO2), and eicosapentaenoic (20:5-NO2) acids. MRM transitions for nitrohydroxy adducts were also monitored: 16:1(OH)-NO2; 18:1(OH)-NO2; 18:2(OH)-NO2; 18:3(OH)-NO2, 20:4(OH)-NO2, and 20:5(OH)-NO2.
In Vitro Formation of OA-NO2
Three different conditions were examined for an ability to induce nitration of oleic acid: acidic nitration, treatment with peroxynitrite, and treatment with MPO in the presence of H2O2 and nitrite. Briefly, for acidic nitration, oleic acid (1 mM) and sodium nitrite (100 μM) were prepared in phosphate buffer (50 mM, pH 7.2) in the presence of 2% sodium cholate (26). The pH was adjusted to 3.0, and the reaction mixture was incubated with stirring (40 min; 25 °C). The reaction was stopped by solvent extraction, and OA-NO2 levels were measured by HPLC ESI MS/MS. For peroxynitrite-induced nitration, oleic acid (1 mM) was suspended in phosphate buffer (100 mM, pH 7.2), and ONOO− was infused via syringe pump into a stirred chamber (100 μM/min; 15 min) (26). Decayed ONOO− (pH 7.4, 10 min) was added as a control. Products were extracted and analyzed for OA-NO2. For MPO-induced nitration, oleic acid (1 mM) was incubated in phosphate buffer (100 mM; pH 7.2) in the presence of MPO (50 nM), sodium nitrite (100 μM), and hydrogen peroxide (100 μM) as described (27). The reaction proceeded for 90 min with additional aliquots of hydrogen peroxide added at 30-min intervals. The reaction was stopped by lipid extraction, and OA-NO2 was measured by HPLC ESI MS/MS. Significance of difference between treated and control groups was determined using a one-tailed, paired Student’s t test.
PPAR Transient Transfection Assay
CV-1 cells from the ATCC (Manassas, VA) were grown to ~85% confluence in DMEM/F-12 supplemented with 10% FBS and 1% penicillin-streptomycin. Twelve hours before transfection, the medium was removed and replaced with antibiotic-free medium. Cells were transiently co-transfected with a plasmid containing the luciferase gene under the control of three tandem PPAR response elements (PPRE) (PPRE × 3 TK-luciferase and PPARγ, PPARα, or PPARδ expression plasmids, respectively (provided by Ron Evans, Salk Institute). In all cases, a green fluorescence protein (GFP) expression plasmid was co-transfected as the control for transfection efficiency. Twenty-four hours after transfection, cells were returned to Opti-MEM (Invitrogen) for 24 h and then treated as indicated for another 24 h. Reporter luciferase assay kits from Promega (Madison, WI) were used to measure the luciferase activity according to the manufacturer’s instructions with a luminometer (Victor II, PerkinElmer Life Sciences). Luciferase activity was normalized by GFP units. Each condition was performed in triplicate for each experiment (n ≥ 3).
3T3-L1 Differentiation and Oil Red O Staining
3T3-L1 preadipocytes were propagated and maintained in DMEM containing 10% FBS. To induce differentiation, 2-day post-confluent preadipocytes (designated day 0) were cultured in DMEM containing 10% FBS plus 1 and 3 μM OA-NO2 for 14 days. The medium was changed every 2 days. Rosiglitazone (3 μM) and oleic acid (3 μM) were used as positive and negative controls, respectively. Differentiated adipocytes were stained with oil red O as described previously (28).
[3H]2-Deoxy-D-Glucose Uptake Assay in Differentiated 3T3-L1 Adipocytes
[3H]2-Deoxy-D-glucose uptake was analyzed as described previously (29). 3T3-L1 preadipocytes were grown in 24-well tissue culture plates, 2-day post-confluent monolayers were treated with 10 μg/ml insulin, 1 μM dexamethasone, and 0.5 mM 3-isobutyl-1-methylxanthine in DMEM containing 10% FBS for 2 days, then cells were maintained in 10 μg/ml insulin in DMEM containing 10% FBS for 6 days (medium was changed every 3 days). Eight days after induction of adipogenesis, test compounds in DMEM containing 10% FBS were added for an additional 2 days (medium was changed every day). The PPARγ-specific antagonist GW9662 was added 1 h before other additions. After two rinses with serum-free DMEM, cells were incubated for 3 h in serum-free DMEM and rinsed at room temperature three times with freshly prepared KRPH buffer (5 mM phosphate buffer, 20 mM HEPES, 1 mM MgSO4, 1 mM CaCl2, 136 mM NaCl, 4.7 mM KCl, pH 7.4). The buffer was replaced with 1 μCi/ml of [3H]2-deoxy-D-glucose in KRPH buffer for 10 min at room temperature. Cells were then rinsed three times with cold PBS, lysed overnight in 0.8 N NaOH (0.4 ml/well), neutralized with 26.6 μl of 12 N HCl, and 360 μl of lysate was added to Scintisafe Plus™ for radioactivity determination by liquid scintillation counting.
RESULTS
Detection and Identification of Nitrated Unsaturated Fatty Acids
The discovery that LNO2 is present in vivo motivated a search for additional endogenous nitrated fatty acids that may also act as lipid signaling molecules. To survey plasma and urine for other nitrated fatty acids, plasma and urine lipid extracts from healthy human donors were analyzed by HPLC ESI MS/MS in the MRM scan mode. MRM transitions were calculated for the nitro and nitrohydroxy adducts of six fatty acids (TABLE ONE) and used to qualitatively detect nitro and nitrohydroxy adducts in plasma and urine lipid extracts using a gradient HPLC elution methodology (Fig. 2). Nitrated adducts of all monitored unsaturated fatty acids are present in blood and urine. The Michael-like addition products of these species with H2O were detected as nitrohydroxy adducts. The injection peak area was <1% of the peak areas for 18:1, 18:2, and 18:3; however, for 16:1, 20:4, and 20:5, the injection peak was significant compared with the area of the analyte (data not shown), affirming the importance of HPLC separation prior to analysis by mass spectrometry. Structural confirmation was obtained by MS/MS run concurrent to the MRM scan mode analysis (data not shown). Due to a present lack of stable isotope internal standards for all derivatives, data are presented as mass spectrometry-based structural confirmation that this array of nitrated fatty acids exists in vivo. Because of its predominant abundance and structural simplicity, oleic acid was synthesized as a standard to quantitate endogenous OA-NO2 content and signaling activity.
TABLE ONE. Multiple reaction monitoring (MRM) transitions for fatty acid nitroalkene derivatives.
MRM values for nitroalkene and nitrohydroxy adducts of fatty acids were based on the common loss of the nitro group that occurs during collision-induced dissociation of nitrated fatty acids.
| Fatty acid | Carbons:double bonds | Nitro adduct (−NO2) | Nitrohydroxy adduct (L(OH)-NO2) |
|---|---|---|---|
| Palmitoleic | 16:1 | 298/251 | 316/269 |
| Oleic | 18:1 | 326/279 | 344/297 |
| Linoleic | 18:2 | 324/277 | 342/295 |
| Linolenic | 18:3 | 322/275 | 340/293 |
| Arachidonic | 20:4 | 348/301 | 366/319 |
| Eicosapentaenoic | 20:5 | 346/299 | 364/317 |
FIGURE 2. Nitrated fatty acid derivatives in healthy human plasma and urine.
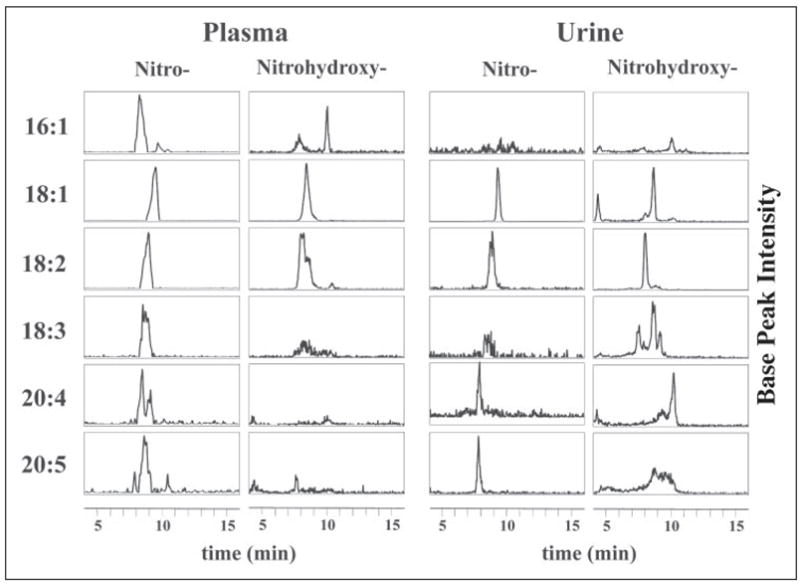
Fatty acids were extracted from clinical samples and analyzed by HPLC ESI MS/MS in the negative ion mode. Nitrated fatty acid adducts (−NO2) and their nitrohydroxy derivatives (L(OH)-NO2) were detected using the MRM scan mode (TABLE ONE) and presented as HPLC elution profiles. Six fatty acids were monitored: palmitoleic acid (16:1), oleic acid (18:1), linoleic acid (18:2), linolenic acid (18:3), arachidonic acid (20:4), and eicosapentaenoic acid (20:5). In plasma and urine, all monitored nitrated fatty acids were detectable in the HPLC elution profiles with varying degrees of intensity. Each HPLC elution profile is presented with base peak intensity and does not reflect quantity relative to the other profiles. The multiple peaks in some of the elution profiles for the nitro and nitrohydroxy adducts suggest multiple stereo and/or positional isomers.
Synthesis and Purification of OA-NO2
Nitration of oleic acid by nitrosenylation yields two potential regioisomers of OA-NO2 (Fig. 1). Analytical TLC, GC-, and LC-mass spectrometry of purified synthetic OA-NO2 indicated no contamination by oleic acid or its oxidized products following purification (data not shown). Mass spectrometric analysis of synthetic [13C18]OA-NO2 showed <2% natural isotope contamination, consistent with the >98% isotopic purity of the [13C18]oleic acid standard.
NMR Analysis of OA-NO2
The structure of synthetic OA-NO2 (a 1:1 mixture of C-9- and C-10-regioisomers) was analyzed by 1H and 13C NMR. NMR splitting patterns are designated as s, singlet; d, doublet; t, triplet; q, quartet; m, multiplet; and br, broad. 1H NMR (CDCl3): δ 11.1 (br s, 1H), 7.06 (dd, 1H, J = 7.8 Hz), 2.55 (t, 2H, J = 7.6 Hz), 2.35 (m, 2H), 2.20 (q, 2H, J = 7.3 Hz), 1.61 (m, 2H), 1.47 (m, 4H), 1.32–1.25 (m, 16H), 0.87 (t, 3H, J = 7.0 Hz).
The 1H spectrum and proposed assignments of diagnostic peaks are presented in Fig. 3A: 11.1 (COOH), 7.06 (C-9 or C-10, alkene proton, each a triplet from coupling to neighboring methylene CH2, with regioisomers superimposed on each other, appearing on one NMR spectrometer at 300 MHz as a doublet of triplets and on the other at 500 MHz as a quartet, in actuality a superimposed pair of triplets), 2.55 (C-8 or C-11, allylic methylene neighboring nitro group; nitroalkene more electron-withdrawing than carbonyl), 2.35 (C-2 methylene neighboring carbonyl), 2.20 (C-8 or C-11, allylic methylene opposite nitro group); 0.87 (C-18 terminal methyl).
FIGURE 3. 1H and 13C NMR spectrometry of synthetic OA-NO2.
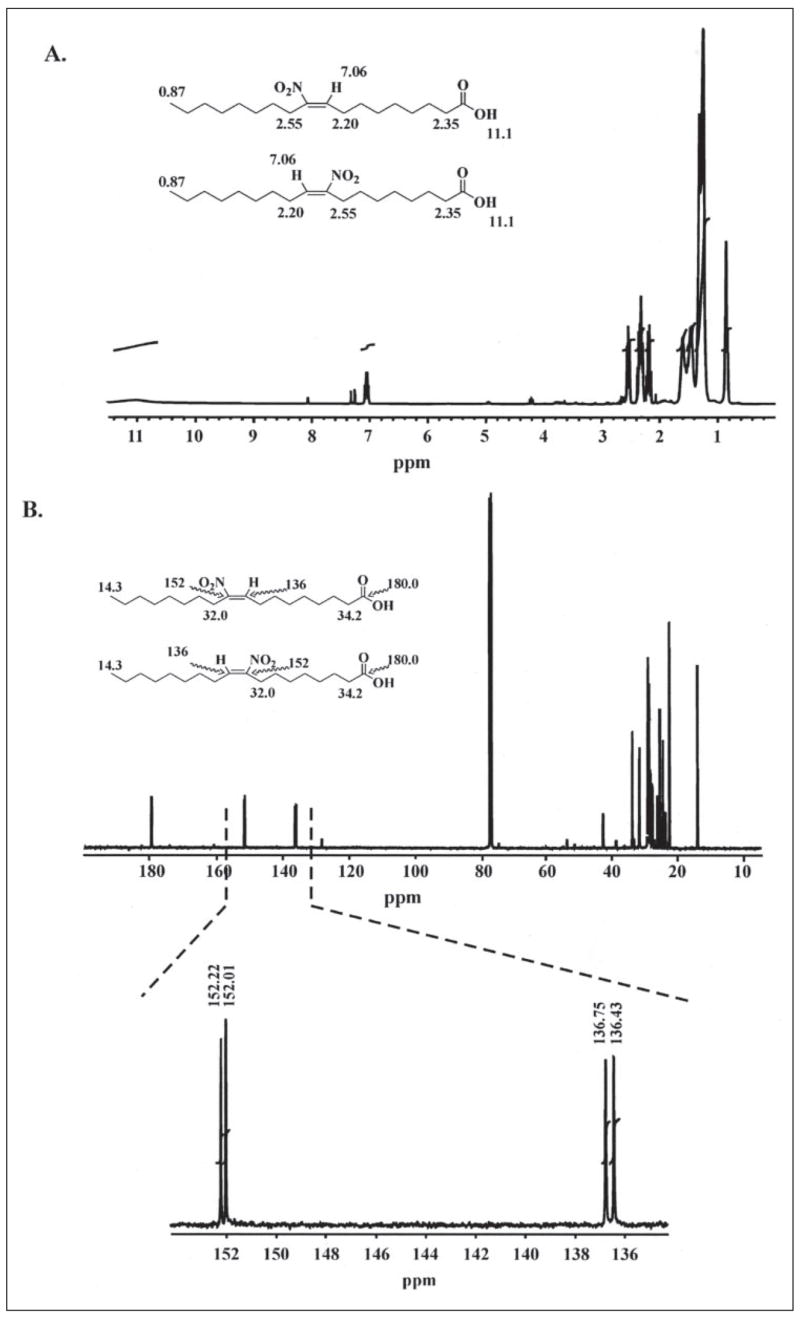
Proton (A) and 13C (B) NMR spectrometry confirmed the structure of synthetic OA-NO2. Identified protons and carbons are indicated for each regioisomer; downfield shifts are presented in ppm. 13C NMR spectrometry indicates that synthetic OA-NO2 is a mixture of two regioisomers, with most carbon peaks appearing as doublets. The equal height of the doublets indicates an equal molar ratio of the regioisomers. The peaks appearing at 152 and 136 ppm are the carbons α and β to the alkenyl nitro group, respectively.
The signal for the alkene CH is sufficient to assign the stereochemistry of the alkene. E-Nitroalkenes have characteristic chemical shifts of approximately δ 7.0 ppm, while Z-nitroalkenes have characteristic chemical shifts of approximately δ 5.8 ppm (30–32). The only alkene CH observed in the 1:1 mixture of 9- and 10-nitro isomeric OA-NO2 are centered on δ 7.06 ppm as superimposed signals from each isomer, 9-nitro and 10-nitro. No other alkene peaks are present. Thus, both the 9-nitro and the 10-nitro isomers have the E-configuration (referred to as cis-isomers herein, as detailed above). The remaining regions of the spectrum also overlap and are similar for each isomer.
Spectral Characterization of Synthetic OA-NO2
The absorbance spectrum of OA-NO2 was acquired in phosphate buffer in the presence of the iron chelator DTPA (Fig. 4A). The maximum at 270 nm was ascribed to photon absorption by pi electrons in the nitro functional group. Extinction coefficients for OA-NO2 and [13C18]OA-NO2 were determined by plotting absorbance (λ270) versus concentration, giving m = AU·cm−1·mM−1 and a calculated ε = 8.22 and 8.23 cm−1·mM−1, for OA-NO2 and [13C18]OA-NO2, respectively (Fig. 4B).
FIGURE 4. Spectrophotometric analysis of OA-NO2.
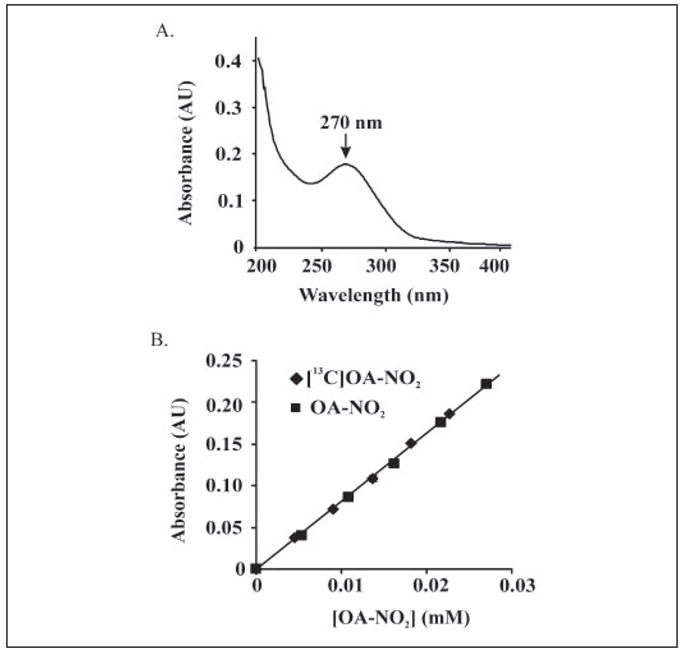
A, an absorbance spectrum of OA-NO2 from 200 – 450 nm was generated using 23 μM OA-NO2 in phosphate buffer (100 mM, pH 7.4) containing 100 μM DTPA. An absorbance maximum at 270 nm was identified. B, extinction coefficients for OA-NO2 and [13C18]OA-NO2 were determined by plotting absorbance (λ270) versus concentration, resulting in calculated values of ε = 8.22 and 8.23 cm−1·mM−1, respectively.
Stability of OA-NO2
OA-NO2 was found to be fully stable for >3 months when stored at −80 °C in MeOH (data not shown). However, some decay was observed in MeOH at 37 °C, showing ~10% decay after 1 month (Fig. 5). In phosphate buffer, OA-NO2 decayed much faster, with ~40% loss after 2 h. In both solvent environments, LNO2 was much less stable than OA-NO2, with this attributed to the greater reactivity of the bisallylic bond arrangement in LNO2.
FIGURE 5. Stability of OA-NO2 and LNO2.
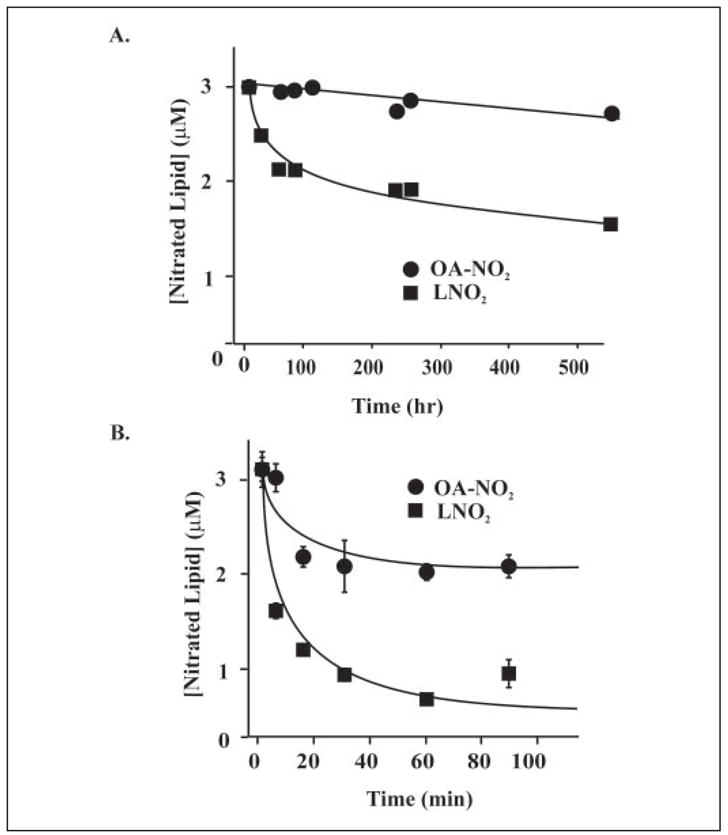
A, OA-NO2 and LNO2 (3 μM each) were incubated in MeOH at 37 °C and aliquots removed at periodic intervals for extraction and quantitation of the parent molecule. B, a similar analysis to A was performed, using phosphate buffer (100 mM KPO4, 100 μM DTPA, pH 7.4) rather than MeOH.
Characterization and Quantitation of Endogenous OA-NO2 by ESI MS/MS
Using the gradient HPLC elution protocol described under “Materials and Methods,” synthetic OA-NO2 regioisomers eluted from the reverse-phase column as two partially overlapping peaks (Fig. 6). The HPLC elution profiles for synthetic OA-NO2 and [13C18]OA-NO2 were identical (Fig. 6A, left panels). Concurrent product ion analysis of the overlapping peaks showed spectra consistent with OA-NO2-derived species (Fig. 6A, right panels), with major fragments identified in TABLE TWO. Using these same parameters and machine settings, lipid extracts of packed red cells and plasma were analyzed (Fig. 6B). The product ion spectra for the OA-NO2 present in red cells and plasma were identical to those obtained from synthetic OA-NO2, revealing that OA-NO2 is endogenously present in healthy human blood. Interestingly, the HPLC elution profiles for plasma- and blood-derived OA-NO2 acquired during qualitative analysis show single peaks rather than overlapping species as seen for the synthetic standard, suggesting the possibility that only one regioisomer is present in vivo. The peaks in the elution profiles for both urine and plasma have the same retention times as the second peak of the synthetic standard.
FIGURE 6. Identification and structural characterization of synthetic, plasma and red blood cell OA-NO2 by HPLC ESI MS/MS.
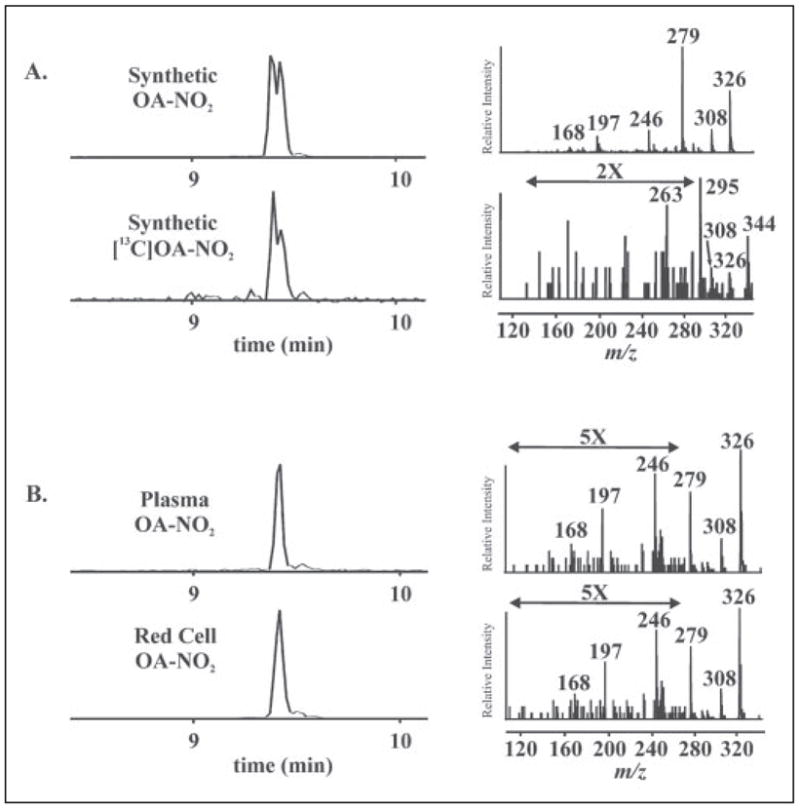
A: left panels, OA-NO2 and [13C18]OA-NO2 were characterized by HPLC ESI MS/MS in the negative ion mode. Nitrated oleic acid species were separated by HPLC and detected by acquiring MRM transitions consistent with the loss of the nitro functional group [M-HNO2]−: m/z 326/279 and m/z 344/297 for OA-NO2 and [13C18]OA-NO2, respectively. Right panels, concurrent to MRM detection, product ion analysis was performed to generate the identifying fragmentation patterns used to characterize OA-NO2 present in red cells and plasma. The predominant product ions generated by collision-induced dissociation are identified in TABLE TWO. B, total lipid extracts were prepared from packed red cell and plasma fractions of venous blood and directly analyzed by HPLC ESI MS/MS.
TABLE TWO. Collision-induced dissociation fragments of nitroalkene fatty acid derivatives.
Nitroalkene derivatives of fatty acids were analyzed by electrospray-ionization tandem mass spectrometry. Product ion spectra from synthetic standards were obtained in the negative ion mode as described under “Materials and Methods.” Major fragments generated for each standard are listed below.
| Mass/charge (m/z) | OA-NO2 | [13C18]OA-NO2 | LNO2 |
|---|---|---|---|
| 344 | [M − H] | ||
| 326 | [M − H] | [M − (H + H2O)] | |
| 324 | [M − H] | ||
| 308 | [M − (H + H2O)] | [M − (H + H2O)] | |
| 306 | [M − (H + H2O)] | ||
| 295 | [M − (H + HNO2)] | ||
| 293 | [M − (H + HNO)] | ||
| 279 | [M − (H + HNO2)] | ||
| 277 | [M − (H + HNO2)] | ||
| 263 | [M − (H + H2O + CO2)] | ||
| 246 | [M − (H + H2O + CO2)] | ||
| 244 | [M − (H + H2O + CO2)] |
To quantitate OA-NO2 content in red cells and plasma, lipid extracts were separated using an isocratic HPLC elution protocol. Analytes co-eluted and MRM transitions for OA-NO2 and [13C18]OA-NO2 were monitored (data not shown). The concentration of OA-NO2 in biological samples was determined from the ratio of analyte to internal standard peak areas using an internal standard curve that is linear over 4 orders of magnitude. The limit of quantitation (LOQ; determined as ten times the standard deviation of the noise) was calculated to be ~1.2 fmol on column (data not shown). Blood samples obtained from 10 healthy human volunteers (5 female, 5 male, ages ranging from 24 to 53) revealed free OA-NO2 in red cells (i.e. OA-NO2 not esterified to glycerophospholipids or neutral lipids) to be 59 ± 11 pmol/ml packed cells (TABLE THREE). Total free and esterified OA-NO2, the amount present in saponified samples, was 214 ± 76 pmol/ml packed cells. Thus, ~75% of OA-NO2 in red cells is esterified to complex lipids (9). In plasma, the free and esterified OA-NO2 concentrations were 619 ± 52 and 302 ± 369 nM, respectively, and thus are more abundant than linoleic acid nitration products (9). Control studies revealed that the extraction and analysis conditions do not induce OA-NO2 formation. Present data also show that saponification reactions induce loss of fatty acid nitro derivatives (data not shown), suggesting that current quantitative results may be an underestimation of actual pool sizes of esterified fatty acid nitroalkene adducts.
TABLE THREE. Nitrated oleic acid in human blood: a comparison with nitrated linoleic acid.
Plasma and red cells obtained from the venous blood from apparently healthy human volunteers and were extracted and prepared for mass spectrometric analysis as described under “Materials and Methods.” During sample preparation, [13C]OA-NO2 was added as an internal standard to correct for losses. OA-NO2 was quantitated by fitting analyte to internal standard area ratios obtained by MS to an internal standard curve. Concentration values for LNO2 in the vascular compartment were obtained from ref. 9. Data are expressed as mean ± S.D. (n = 10; 5 female and 5 male).
| Compartment | Fraction | [OA-NO2] | [LNO2] |
|---|---|---|---|
| Plasma (nM) | Free | 619 ± 52 | 79 ± 35 |
| Esterified | 302 ± 369 | 550 ± 275 | |
| Total | 921 ± 421 | 630 ± 240 | |
| Packed red cells (nM) | Free | 59 ± 11 | 50 ± 17 |
| Esterified | 155 ± 65 | 199 ± 121 | |
| Total | 214 ± 76 | 249 ± 104 | |
| Whole Blood (nM)a | Total | 639 ± 366a | 477 ± 128a |
| Urine (fmol/mg creatinine) | 5.40 ± 52 | 2.28 ± 0.84 |
Assuming a 40% hematocrit.
Characterization of Nitrohydroxy Allylic Derivatives
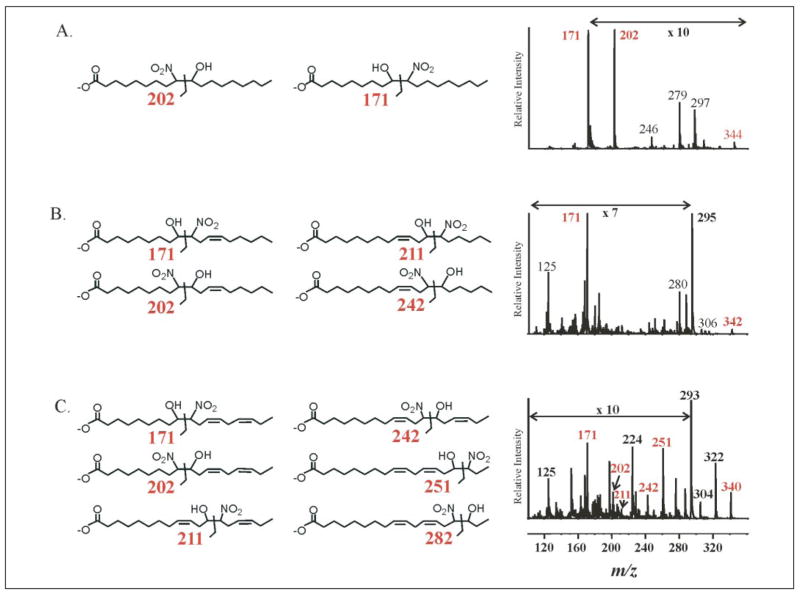
Nitrohydroxy allylic derivatives of fatty acids are also present in plasma and urine (Fig. 2). This was confirmed by product ion analysis run concomitantly with MRM detection (Fig. 7, A–C). Structures of nitrohydroxy adducts are presented with diagnostic fragments and product ion spectra for 18:1(OH)-NO2, 18:2(OH)-NO2, and 18:3(OH)-NO2. Both the 9- and 10-nitro regioisomers of 18:1(OH)-NO2 are present in urine (Fig. 7A) and plasma (data not shown), as evidenced by the intense peak corresponding to m/z 171 and to a lesser extent m/z 202 (Fig. 7A). Also present are major fragments consistent with the loss of a NO2 group and H2O (m/z 297 and 326, respectively). The product ion spectrum obtained from 18:2(OH)-NO2 shows a predominant fragment (m/z 171), consistent with a hydration product of LNO2 nitrated at the 10-carbon (Fig. 7B). Diagnostic fragments for the three other potential regioisomers were not apparent. Finally, multiple regioisomers of 18:3(OH)-NO2 are present, again with an apparent preferential nitration at C-10 (Fig. 7C).
FIGURE 7. Structural analysis of nitrohydroxy fatty acid adducts in urine.
The presence of nitrohydroxy fatty acids in urine was confirmed using HPLC ESI MS/MS in the negative ion mode by performing product ion analyses concurrent to MRM detection. Structures of possible adducts are presented along with their diagnostic fragments and product ion spectra for 18:1(OH)-NO2 (A), 18:2(OH)-NO2 (B), and 18:3(OH)-NO2 (C). Some regions of the MS/MS fragmentation patterns are amplified, as indicated, to better convey structural information. The 10-nitro regioisomer of 18:1(OH)-NO2 is present in urine, as evidenced by the intense peak corresponding to m/z 171; also present are fragments consistent with the 9-nitro regioisomer (m/z 202), loss of a nitro group (m/z 297), and water (m/z 326). 18:2(OH)-NO2 also shows a predominant m/z 171 fragment, again consistent with an oxidation product of LNO2 nitrated at the 10-carbon (B). Diagnostic fragments for the three other potential regioisomers were not apparent. Finally, multiple regioisomers of 18:3(OH)-NO2 are present (C).
In Vitro Nitration of Oleic Acid to OA-NO2
The in vivo detection of nitrated mono-unsaturated fatty acids raised question as to how these derivatives may be formed in vivo. To gain insight into potential mechanisms of formation of OA-NO2, in vitro reactions were performed to determine whether free radical or alternative mechanisms can generate this nitrated fatty acid species (Fig. 8). Treatment of oleic acid with MPO, H2O2 and yielded OA-NO2 with an HPLC elution profile identical to synthetic OA-NO2. Additionally, nitrohydroxy adducts were observed. Oleic acid treated under mild acidic conditions (pH 4.0) in the presence of also generated OA-NO2 with the same physical characteristics as OA-NO2 prepared by nitrosenylation. Relatively less nitrohydroxy adducts were generated as compared with the amount generated by MPO. Finally, treatment of oleic acid with ONOO− resulted in significant formation of OA-NO2 and nitrohydroxy adducts.
FIGURE 8. Nitration of oleic acid by inflammatory oxidants.
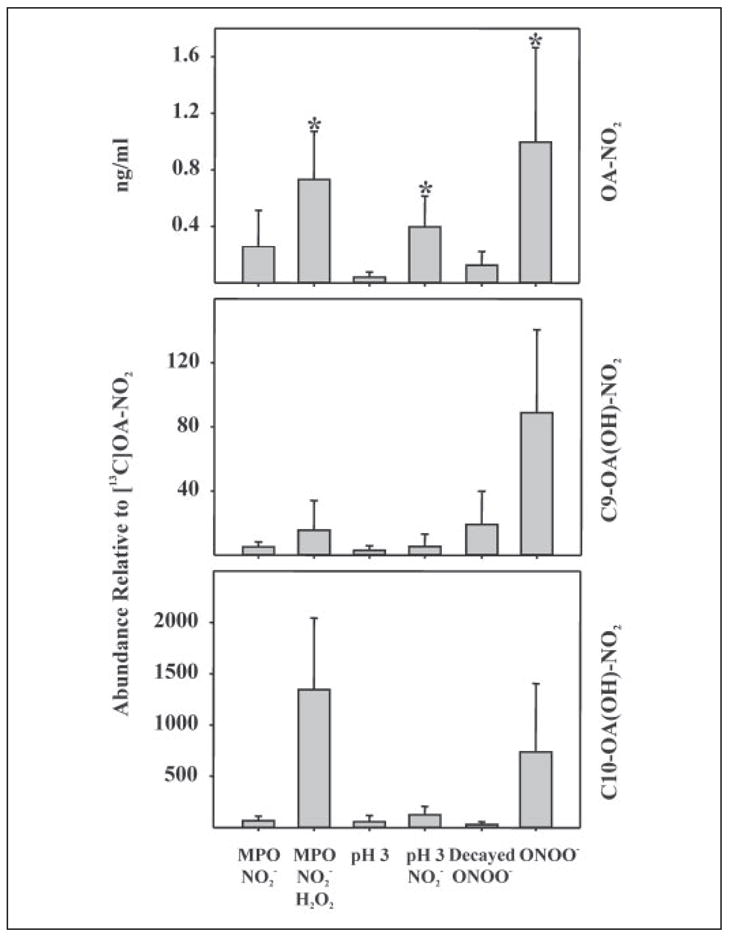
The potential nitration of the monounsaturated oleic acid by oxidants generated in an inflammatory milieu was explored by reaction with MPO, H2O2, and ; acidified , pH 4.0; and peroxynitrite (ONOO−). Each candidate nitrating condition included a negative control, as indicated. After reactions, lipids were extracted and analyzed for oleic acid nitration. Top panel, nitration reactions using MPO, acidic nitration, and ONOO− all resulted in significant extents of oleic acid nitration as compared with matched controls. Significance of difference between treated and control groups was determined using a one-tailed, paired Students t test, with p < 0.05 and indicated by *. Middle panel, by monitoring the MRM transition m/z 344/202, the generation of nitrohydroxy C-9 OA-NO2 was measured. Due to the lack of corresponding 13C internal standards, quantitative determinations were precluded, thus data were expressed as the peak ion intensity of C-9 OA(OH)-NO2 generated as a proportion of added [13C18]OA-NO2. All three reaction conditions generated the C-9 nitrohydroxy adduct and appeared to do so at greater levels than control conditions. Bottom panel, the MRM transition m/z 342/171 was monitored to detect the formation of C-10 OA(OH)-NO2. Greater peak intensities for each reaction condition suggests that the C-10 nitrated oleic acid is the predominant nitroalkene product of these reactions.
Activation of PPARs by OA-NO2
Recently, LNO2 was identified as an endogenous PPAR ligand (17). Considering the even greater levels of OA-NO2 detected in vivo, OA-NO2 was compared with LNO2 as a PPARα, PPARγ, and PPARδ ligand. CV-1 cells were transiently co-transfected with a plasmid containing the luciferase gene under regulation by three PPREs in concert with PPARγ, PPARα, or PPARδ expression plasmids. Dose-dependent activation by OA-NO2 was observed for all PPARs (Fig. 9A), with PPARγ showing the greatest response (significant activation at 100 nM). PPARα and PPARδ showed significant activation at ~300 nM OA-NO2. Nitrated oleic acid was consistently more potent than LNO2 in the activation of PPARγ. A concentration of 1 μM OA-NO2 typically induced the same degree of reporter gene expression as 3 μM LNO2 and 1 μM rosiglitazone, with these activities partially inhibited by the PPARγ antagonist GW9662 (Fig. 9B). Native fatty acids did not activate PPARs at these concentrations (data not shown). The greater potency of OA-NO2 as a PPARγ agonist, compared with LNO2, motivated evaluation of the relative stability of these molecules. Current data indicate that LNO2 decays in aqueous milieu to generate products that do not activate PPARs (17, 20). Compared with LNO2, OA-NO2 is relatively stable in aqueous conditions with only minimal decay occurring after 2 h (Fig. 5).
FIGURE 9. OA-NO2 is a PPARγ agonist.
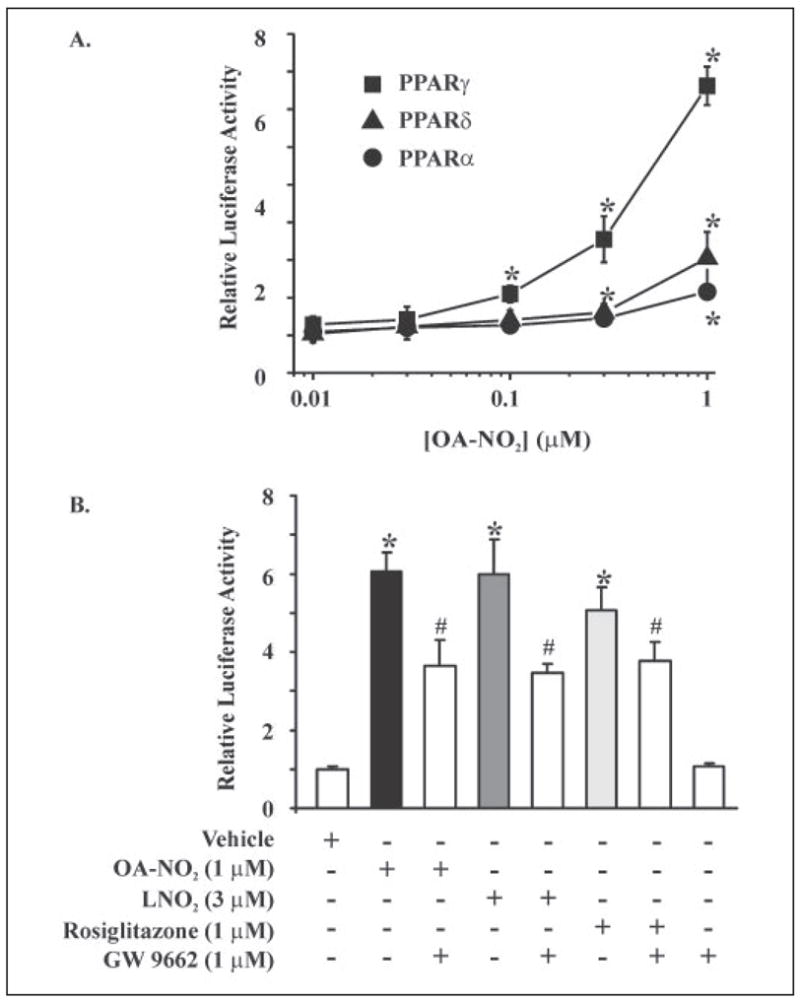
A, CV-1 cells transiently co-transfected with a plasmid containing the luciferase gene under the control of three tandem PPRE (PPRE × 3 TK-luciferase) and hPPARγ, hPPARα, or hPPARδ expression plasmids showed all three PPARs were activated by OA-NO2, with the relative activation of PPARγ > PPARδ > PPARα. All values are expressed as mean ± S.D. (n = 3). PPARγ activation was significantly different from vehicle at 100 nM OA-NO2, whereas PPARα and PPARδ activation were significantly different from vehicle at 300 nM and 1 μM OA-NO2, respectively (*, p ≤ 0.05; Student’s t test). B, nitrated oleic acid was more potent than LNO2 in the activation of PPARγ, with 1 μM OA-NO2 inducing a degree of PPARγ activation that was similar to that induced by 3 μM LNO2 versus control (*, p ≤ 0.05; Student’s t test). Nitroalkene activation of PPARγ was partially blocked by the PPARγ antagonist GW9662 (#, p ≤ 0.05; Student’s t test).
The signaling actions of OA-NO2 as a PPARγ ligand were further assessed by evaluating its impact on adipocyte differentiation, as PPARγ-dependent gene expression plays an essential role in the development of adipose tissue (28, 33). 3T3-L1 preadipocytes were treated with OA-NO2 (3 μM), LNO2 (3 μM), and negative controls for 2 weeks (Fig. 10A). Adipocyte differentiation was assessed both morphologically and via oil red O staining, which indicated the accumulation of intracellular lipids. Vehicle, oleic acid and linoleic acid did not induce adipogenesis. In contrast, OA-NO2 (3 μM) and LNO2 (3 μM) induced ~60 and ~30% of 3T3-L1 preadiopcyte differentiation, respectively. Rosiglitazone, a synthetic PPARγ ligand, also induced PPARγ-dependent preadiopcyte differentiation (Ref. 17 and data not shown). OA-NO2 and rosiglitazone-induced pre-adipocyte differentiation resulted in expression of specific adipocyte markers (PPARγ2 and aP2); oleic acid had no effect on these gene products (Fig. 10B). PPARγ ligands also play a central role in glucose uptake and metabolism, with agonists widely used as insulin-sensitizing drugs. Consistent with its potent PPARγ ligand activity, OA-NO2 induced an increase in the deoxyglucose uptake for the differentiated adipocytes (Fig. 11A). This effect of OA-NO2 (1 μM) was almost paralleled by higher concentrations of LNO2 (3 μM). The increased adipocyte glucose uptake, induced by nitrated fatty acids and the positive control rosiglitazone, was partially inhibited by GW9662 (Fig. 11B). In aggregate, these observations reveal that OA-NO2 manifests well characterized PPARγ-dependent signaling actions.
FIGURE 10. OA-NO2 induces adipogenesis in 3T3-L1 preadipocytes.
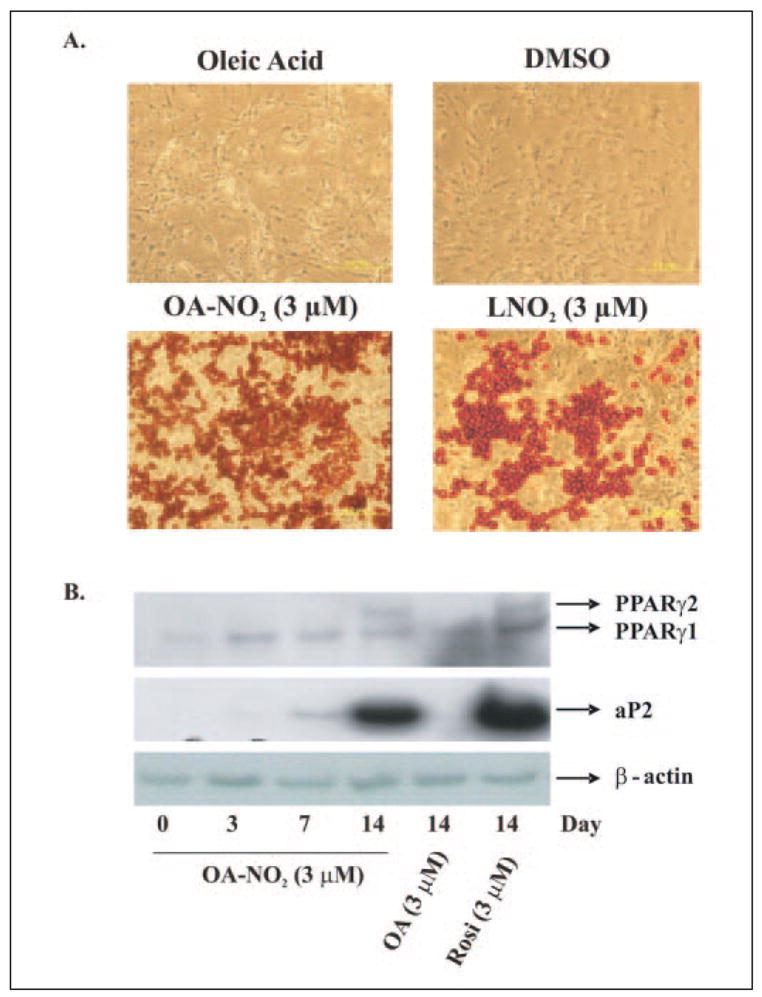
3T3-L1 preadipocytes were treated with OA-NO2, LNO2, rosiglitazone, and controls (oleic acid, and dimethyl sulfoxide (DMSO)) for 2 weeks. A, adipocyte differentiation was assessed both morphologically and via oil red O staining. Vehicle and oleic acid did not induce adipogenesis, whereas OA-NO2 (3 μM) induced ~60% of 3T3-L1 preadiopcyte differentiation; LNO2 (3 μM) induced ~30% of preadipocytes to differentiate, reflecting the greater potency of OA-NO2. B, OA-NO2- and rosiglitazone-induced preadipocyte differentiation resulted in the expression of adipocyte-specific markers (PPARγ2 and aP2), a response not detected for oleic acid.
FIGURE 11. OA-NO2 induces [3H]2-deoxy-D-glucose uptake in differentiated 3T3-L1 adipocytes.
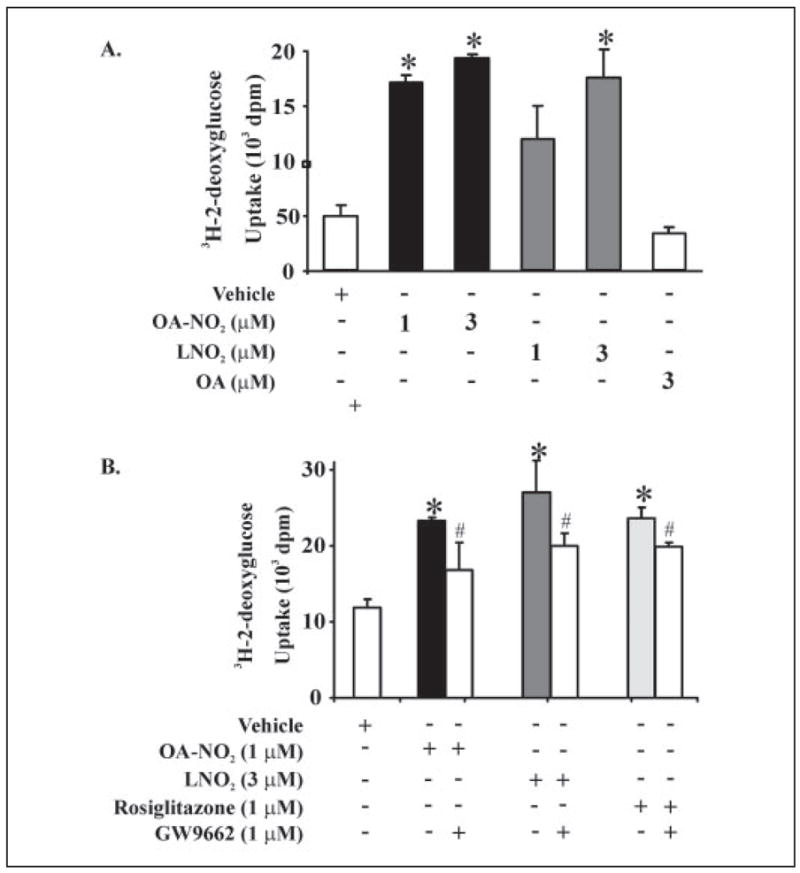
A, 3T3-L1 preadipocytes were differentiated to adipocytes and treated with OA-NO2 or LNO2 for 2 days prior to addition of [3H]2-deoxy-D-glucose. OA-NO2 (1 μM) induced significant increases in glucose uptake, with this effect paralleled by LNO2 (3 μM; p ≤ 0.05; Student’s t test). B, the increased adipocyte glucose uptake induced by nitroalkenes and the positive control rosiglitazone were significantly inhibited by the PPARγ-specific antagonist GW9662 (p ≤ 0.05; Student’s t test). All values are expressed as mean ± S.D. (n = 3).
DISCUSSION
The nitration of hydrocarbons has long been recognized (34). Following the more recent discovery of cell signaling actions of oxides of nitrogen (1, 35), it was also appreciated that ●NO-derived species can mediate the oxidation, nitrosation, nitrosylation, and nitration reactions of protein, DNA, and unsaturated fatty acids (36). These reactions frequently yield stable products that induce structural and functional modifications to target molecules that can (a) translate the signaling actions of ●NO or (b) mediate pathogenic responses when occurring in “excess.”
The reactions of ●NO and its redox-derived products with lipids are multifaceted. Model studies of photochemical air pollutant-induced lipid oxidation reveal that exceedingly high concentrations of nitrogen dioxide (●NO2) induce both oxidation and nitration of fatty acids in phosphatidylcholine liposomes and fatty acid methyl ester preparations (37–39). Subsequently, reaction systems were designed to explore the interactions of endogenous ●NO and ●NO-derived species with fatty acids, including the superoxide reaction product ONOO− and the nitrite acidification product nitrous acid (HNO2). These model studies of the inflammatory reactions of ●NO with fatty acids supported that (a) ●NO mediates potent inhibition of autocatalytic radical chain propagation reactions of lipid peroxidation (40, 41) and (b) ●NO-derived species produce both nitrated and oxidized derivatives of unsaturated fatty acids (3, 42). One product of these reaction pathways, LNO2, is present at ~500 nM concentration in healthy human red cells and plasma and serves as a ligand for the PPAR nuclear lipid receptor family (9, 17). This insight, coupled with the fact that oleic acid is the most abundant unsaturated fatty acid in living organisms, motivated the present search for other potential endogenous nitrated fatty acid derivatives that might translate tissue redox signaling reactions.
The structure of OA-NO2 (Fig. 1) was defined on the basis of the synthetic rationale and NMR analysis (Fig. 3). Proton and 13C NMR spectra indicate that synthetic OA-NO2 is comprised of two regioisomers, 9- and 10-nitro-9-cis-octadecenoic acids, with no trans-isomers apparent. Peaks characteristic of the nitroalkene and olefinic carbons in the 13C spectrum appear as doublets that are equal in intensity, indicating an equivalent distribution between regioisomers. HPLC ESI MS/MS further characterized synthetic OA-NO2. The combined fragmentation pattern of OA-NO2 regioisomers was obtained by CID, which provided a “molecular fingerprint” used to identify OA-NO2 in biological samples (Fig. 6). ESI MS/MS analysis of lipid extracts derived from plasma and red cells yielded spectra with identical HPLC retention times and major product ions, confirming that OA-NO2 exists endogenously. It is not possible from MS analysis, however, to determine the cis/trans conformation of OA-NO2 regioisomers. Quantitative analysis of plasma and red cells showed that OA-NO2 is present in the vasculature at net concentrations ~50% greater than LNO2 (TABLE THREE). The combined concentrations of free and esterified OA-NO2 and LNO2 are well above 1 μM. Multiple in vitro studies support that this is a concentration range capable of eliciting robust cell signaling responses.
The NO2 functional groups of OA-NO2 and LNO2 are located on olefinic carbons. This configuration imparts a unique chemical reactivity that enables the release of ●NO during aqueous decay of nitroalkenes via a modified Nef reaction (20). Furthermore, the β-carbon proximal to the alkenyl NO2 group is strongly electrophilic and reacts with H2O via a Michael addition-like mechanism to generate nitrohydroxy adducts (Figs. 2 and 7). Nitrohydroxyarachidonic acid species have been detected in bovine cardiac muscle (43), and nitrohydroxylinoleic acid has been identified in lipid extracts obtained from hypercholesterolemic and post-prandial human plasma, suggesting that this is a ubiquitous derivative (44). The present identification of a wide spectrum of nitrated fatty acids and corresponding nitrohydroxy fatty acid derivatives in human plasma and urine reveals that nitration reactions occur with all unsaturated fatty acids (Figs. 2 and 7). The hydroxyl moiety of nitrohydroxy fatty acid derivatives destabilizes the adjacent carbon-carbon bond, facilitating heterolytic scission reactions that generate predictable fragments during CID (Fig. 7). Present data indicate that nitrohydroxy adducts of LNO2 and OA-NO2 are not ligands for PPARγ (Ref. 17 and data not shown).
Multiple mechanisms can support the basal and inflammatory nitration of fatty acids by ●NO-derived species, including ●NO2-initiated auto-oxidation of polyunsaturated fatty acids via hydrogen abstraction from the bis-allylic carbon (26, 38, 45–48). Of relevance to cell signaling, ●NO2 is derived from multiple reactions. These include the hemolytic scission of both peroxynitrous acid (ONOOH) and the reaction product of ONOO− with CO2, nitrosoperoxocarbonate ( ). The oxidation of by heme peroxidases, such as myeloperoxidase, is also a significant source of inflammatory ●NO2 production (49, 50). These alkene nitration mechanisms yield nitrated fatty acids that are structurally similar or identical to the OA-NO2 and nitrohydroxy adducts detected clinically (Fig. 8). Nitration by a free radical mechanism might suggest that all olefinic carbons within a fatty acid would be susceptible nitration targets, with the additional likelihood of double bond rearrangement and conjugation. The discovery of OA-NO2 lends critical perspective to this issue, because monounsaturated fatty acids are less susceptible but still capable of oxidation reactions (51). In view of the present structural data regarding nitroalkene positional isomer distribution, alternative fatty acid nitration mechanisms may also occur. For example, nitration by an ionic addition reaction (e.g. nitronium ion, ) can generate singly nitrated fatty acids with no double bond-rearrangement (26). Since readily reacts with H2O, this species may require localized catalysis (e.g. reaction of ONOO− with transition metals) to serve as a biologically relevant nitrating species. Finally, data in Fig. 8 indicate that acidic nitration reactions occur with both mono- and polyunsaturated fatty acids to yield non-conjugated nitroalkene derivatives of polyunsaturated fatty acids. This precept is also supported by acidified and ●NO2-mediated fatty acid methyl ester oxidation and nitration profiles (39, 48, 52).
Of relevance to mechanisms underlying fatty acid nitration in vivo, the nitrohydroxy adducts of Δ9 unsaturated fatty acids examined in the present study (18:1, 18:2, and 18:3) all yield a predominant CID fragment of m/z 171 (Fig. 7). This mass is consistent with 9-oxo-nonanoic acid, a CID fragment generated with standards when the NO2 group is located at the 10-carbon and the hydroxyl moiety at the 9-carbon. There are several interpretations of these data. First, the differences in relative intensities of the CID products may be due to differential fragmentation efficiencies. Indeed, the m/z 171 product generated from the C-10 adduct is a 9-oxo-nonanoic anion, whereas the C-9 product (m/z 202) is 9-nitro-nonanoic anion. An alternative interpretation is that the C-10 nitrohydroxy adduct is more predominant, suggesting that either strict steric control or enzymatic mechanisms regulate the stereospecificity of biological fatty acid nitration. The nitration of Δ9 unsaturated fatty acids to C-10 nitroalkene derivatives, with retention of double bond arrangement, supports that stereospecific enzymatic reactions may mediate fatty acid nitration. It is also possible that nitrated fatty acids are made bioavailable from dietary sources consisting of stereospecific fatty acid nitroalkene derivatives. Further studies are currently under way to address this issue.
Designation of nitroalkene derivatives as a class of signaling molecules is contingent upon ascribing specific bioactivities to multiple members within the class at clinically relevant concentrations. Nitrolinoleate inhibits neutrophil and platelet function via cGMP-independent, cAMP-mediated mechanisms (10–12). Also, aqueous decay of LNO2 yields ●NO, a reaction facilitated by translocation of LNO2 from a hydrophobic to hydrophilic microenvironment, which in turn induces cGMP-dependent vessel relaxation (12, 20). LNO2 also serves as a robust ligand for PPARγ (17), a nuclear hormone receptor that binds lipophilic ligands and induces DNA binding of the transcription factor complex at DR1-type motifs in the promoter sites of target genes. Downstream effects of PPARγ activation include modulation of metabolic and cellular differentiation genes, regulation of inflammatory responses, adipogenesis, and glucose homeostasis (18, 19). In the vasculature, PPARγ is expressed in monocytes, macrophages, smooth muscle cells, and endothelium (53) and plays a central role in regulating the expression of genes related to lipid trafficking, cell proliferation, and inflammatory signaling. Herein we show that OA-NO2 also serves as a PPARγ, -α, and -δ ligand that exceeds the potency of LNO2 and rivals the potency of synthetic PPAR ligands such as fibrates and thiazo-lidinediones (Figs. 9–11). The greater potency of OA-NO2 as a PPARγ ligand relative to LNO2 is either due to increased aqueous stability (Fig. 5), increased receptor affinity, or both.
The combined blood concentrations of OA-NO2 and LNO2 in healthy humans exceeds 1 μM (TABLE THREE); thus, they are present at concentrations capable of modulating inflammatory cell function and activation of PPAR receptors. Endogenous blood concentrations of nitroalkenes also far exceed those of previously proposed endogenous PPARγ ligands (17). These data thus have broad implications for the ●NO and redox signaling reactions that play a crucial role in dysregulated cell growth and differentiation, metabolic syndrome, atherosclerosis, diabetes, and a variety of inflammatory conditions, all clinical pathologies that include a significant contribution from PPAR-regulated cell signaling mechanisms (54).
The regulation of inflammation by inhibiting eicosanoid synthesis is a well established and prevalent target of anti-inflammatory drug strategies. Much less well understood are the concerted cell signaling mechanisms by which inflammation is favorably resolved in vivo. While the composite in vivo tissue signaling activities of nitrated fatty acids remain to be defined, studies to date indicate that these pluripotent signaling mediators generally manifest salutary metabolic and anti-inflammatory actions (10–12, 17). The capability of redox-derived lipid signaling molecules to mediate the resolution of inflammation is a relatively new concept, with lipoxins and resolvins also representing new classes of lipid mediators that act in this manner (55, 56). Of note, endogenous concentrations of OA-NO2 and LNO2 are abundant and are increased by oxidative inflammatory reactions. Thus, nitrated fatty acids will exert both receptor-dependent (via PPAR ligand activity) and cyclic nucleotide-mediated roles in transducing the redox signaling actions of oxygen and ●NO, thereby regulating organ function, cell differentiation, cell metabolism, and systemic inflammatory responses.
Acknowledgments
We appreciate the helpful guidance provided by Dr. Jo Rae Wright.
Footnotes
This work was supported in part by National Institutes of Health Grants HL58115 and HL64937 (to B. A. F.) and HL068878, HL075397, HL03676, and S06GM08248 (to Y. E. C.) and by American Heart Association Grant 0450118Z and a Department of Education GAANN (Graduate Assistance in Areas of National Need) award (to B. P. B.).
This article was selected as a Paper of the Week.
The abbreviations used are: ●NO, nitric oxide; LNO2, nitrated linoleic acid; PPAR, peroxisome proliferator-activated receptor; OA-NO2, nitrated oleic acid; ONOO−, peroxynitrite; MPO, myeloperoxidase; HPLC ESI MS/MS, high performance liquid chromatography electrospray ionization triple quadrupole mass spectrometry; MRM, multiple reaction monitoring; CID, collision-induced dissociation; PPRE, PPAR response elements; DTPA, diethylenetriaminepentaacetate; DMEM, Dulbecco’s modified Eagle’s medium; FBS, fetal bovine serum.
References
- 1.Smith WL. Am J Physiol. 1992;263:F181–F191. doi: 10.1152/ajprenal.1992.263.2.F181. [DOI] [PubMed] [Google Scholar]
- 2.Montuschi P, Barnes PJ, Roberts LJ. FASEB J. 2004;18:1791–1800. doi: 10.1096/fj.04-2330rev. [DOI] [PubMed] [Google Scholar]
- 3.Rubbo H, Radi R, Trujillo M, Telleri R, Kalyanaraman B, Barnes S, Kirk M, Freeman BA. J Biol Chem. 1994;269:26066–26075. [PubMed] [Google Scholar]
- 4.Schopfer FJ, Baker PR, Freeman BA. Trends Biochem Sci. 2003;28:646–654. doi: 10.1016/j.tibs.2003.10.006. [DOI] [PubMed] [Google Scholar]
- 5.Marshall HE, Merchant K, Stamler JS. FASEB J. 2000;14:1889–1900. doi: 10.1096/fj.00.011rev. [DOI] [PubMed] [Google Scholar]
- 6.Vidwans AS, Uliasz TF, Hewett JA, Hewett SJ. Biochemistry. 2001;40:11533–11542. doi: 10.1021/bi0108960. [DOI] [PubMed] [Google Scholar]
- 7.Larfars G, Lantoine F, Devynck MA, Palmblad J, Gyllenhammar H. Blood. 1999;93:1399–1405. [PubMed] [Google Scholar]
- 8.Rubbo H, Radi R, Anselmi D, Kirk M, Barnes S, Butler J, Eiserich JP, Freeman BA. J Biol Chem. 2000;275:10812–10818. doi: 10.1074/jbc.275.15.10812. [DOI] [PubMed] [Google Scholar]
- 9.Baker PR, Schopfer FJ, Sweeney S, Freeman BA. Proc Natl Acad Sci U S A. 2004;101:11577–11582. doi: 10.1073/pnas.0402587101. [DOI] [PMC free article] [PubMed] [Google Scholar]
- 10.Coles B, Bloodsworth A, Eiserich JP, Coffey MJ, McLoughlin RM, Giddings JC, Lewis MJ, Haslam RJ, Freeman BA, O’Donnell VB. J Biol Chem. 2002;277:5832–5840. doi: 10.1074/jbc.M105209200. [DOI] [PubMed] [Google Scholar]
- 11.Coles B, Bloodsworth A, Clark SR, Lewis MJ, Cross AR, Freeman BA, O’Donnell VB. Circ Res. 2002;91:375–381. doi: 10.1161/01.res.0000032114.68919.ef. [DOI] [PubMed] [Google Scholar]
- 12.Lim DG, Sweeney S, Bloodsworth A, White CR, Chumley PH, Krishna NR, Schopfer F, O’Donnell VB, Eiserich JP, Freeman BA. Proc Natl Acad Sci U S A. 2002;99:15941–15946. doi: 10.1073/pnas.232409599. [DOI] [PMC free article] [PubMed] [Google Scholar]
- 13.Gladwin MT, Shelhamer JH, Schechter AN, Pease-Fye ME, Waclawiw MA, Panza JA, Ognibene FP, Cannon RO., III Proc Natl Acad Sci U S A. 2000;97:11482–11487. doi: 10.1073/pnas.97.21.11482. [DOI] [PMC free article] [PubMed] [Google Scholar]
- 14.Rassaf T, Bryan NS, Kelm M, Feelisch M. Free Radic Biol Med. 2002;33:1590–1596. doi: 10.1016/s0891-5849(02)01183-8. [DOI] [PubMed] [Google Scholar]
- 15.Rassaf T, Bryan NS, Maloney RE, Specian V, Kelm M, Kalyanaraman B, Rodriguez J, Feelisch M. Nat Med. 2003;9:481–482. doi: 10.1038/nm0503-481. [DOI] [PubMed] [Google Scholar]
- 16.Cosby K, Partovi KS, Crawford JH, Patel RP, Reiter CD, Martyr S, Yang BK, Waclawiw MA, Zalos G, Xu X, Huang KT, Shields H, Kim-Shapiro DB, Schechter AN, Cannon RO, III, Gladwin MT. Nat Med. 2003;9:1498–1505. doi: 10.1038/nm954. [DOI] [PubMed] [Google Scholar]
- 17.Schopfer FJ, Lin Y, Baker PR, Cui T, Garcia-Barrio M, Zhang J, Chen K, Chen YE, Freeman BA. Proc Natl Acad Sci U S A. 2005;102:2340–2345. doi: 10.1073/pnas.0408384102. [DOI] [PMC free article] [PubMed] [Google Scholar]
- 18.Lee CH, Evans RM. Trends Endocrinol Metab. 2002;13:331–335. doi: 10.1016/s1043-2760(02)00668-9. [DOI] [PubMed] [Google Scholar]
- 19.Marx N, Duez H, Fruchart JC, Staels B. Circ Res. 2004;94:1168–1178. doi: 10.1161/01.RES.0000127122.22685.0A. [DOI] [PubMed] [Google Scholar]
- 20.Schopfer FJ, Baker PR, Giles G, Chumley P, Batthyany C, Crawford J, Patel RP, Hogg N, Branchaud BP, Lancaster JR, Jr, Freeman BA. J Biol Chem. 2005;280:19289–19297. doi: 10.1074/jbc.M414689200. [DOI] [PubMed] [Google Scholar]
- 21.Dodge JT, Phillips GB. J Lipid Res. 1967;8:667–675. [PubMed] [Google Scholar]
- 22.Koppenol WH, Kissner R, Beckman JS. Methods Enzymol. 1996;269:296–302. doi: 10.1016/s0076-6879(96)69030-2. [DOI] [PubMed] [Google Scholar]
- 23.Bligh EG, Dyer WL. Can J Biochem Physiol. 1959;37:911–917. doi: 10.1139/o59-099. [DOI] [PubMed] [Google Scholar]
- 24.Deng Y, Wu JT, Zhang H, Olah TV. Rapid Commun Mass Spectrom. 2004;18:1681–1685. doi: 10.1002/rcm.1540. [DOI] [PubMed] [Google Scholar]
- 25.Pai TG, Payne WJ, LeGall J. Anal Biochem. 1987;166:150–157. doi: 10.1016/0003-2697(87)90557-4. [DOI] [PubMed] [Google Scholar]
- 26.O’Donnell VB, Eiserich JP, Chumley PH, Jablonsky MJ, Krishna NR, Kirk M, Barnes S, Darley-Usmar VM, Freeman BA. Chem Res Toxicol. 1999;12:83–92. doi: 10.1021/tx980207u. [DOI] [PubMed] [Google Scholar]
- 27.Eiserich JP, Baldus S, Brennan ML, Ma W, Zhang C, Tousson A, Castro L, Lusis AJ, Nauseef WM, White CR, Freeman BA. Science. 2002;296:2391–2394. doi: 10.1126/science.1106830. [DOI] [PubMed] [Google Scholar]
- 28.Zhang J, Fu M, Cui T, Xiong C, Xu K, Zhong W, Xiao Y, Floyd D, Liang J, Li E, Song Q, Chen YE. Proc Natl Acad Sci U S A. 2004;101:10703–10708. doi: 10.1073/pnas.0403652101. [DOI] [PMC free article] [PubMed] [Google Scholar]
- 29.Mukherjee R, Hoener PA, Jow L, Bilakovics J, Klausing K, Mais DE, Faulkner A, Croston GE, Paterniti JR., Jr Mol Endocrinol. 2000;14:1425–1433. doi: 10.1210/mend.14.9.0528. [DOI] [PubMed] [Google Scholar]
- 30.Denmark SE, Gomez L. J Org Chem. 2003;68:8015–8024. doi: 10.1021/jo034853w. [DOI] [PubMed] [Google Scholar]
- 31.Lucet D, Heyse P, Gissot A, Le Gall T, Mioskowski C. Eur J Org Chem. 2000:3575–3579. [Google Scholar]
- 32.Ono N, Maruyama K. Bull Chem Soc Jpn. 1988;61:4470–4472. [Google Scholar]
- 33.Evans RM, Barish GD, Wang YX. Nat Med. 2004;10:355–361. doi: 10.1038/nm1025. [DOI] [PubMed] [Google Scholar]
- 34.Zelinsky ND, Rosanoff MA. Z Physikal Chem. 1912;78:629–633. [Google Scholar]
- 35.Ignarro LJ, Byrns RE, Buga GM, Wood KS, Chaudhuri G. J Pharm Exp Ther. 1988;244:181–189. [PubMed] [Google Scholar]
- 36.Miranda KM, Espey MG, Jourd’heuil D, Grisham MB, Fukoto JM, Feelisch M, Wink DA. In: Nitric Oxide: Biology and Pathobiology. Ignarro LJ, editor. Academic Press; San Diego, CA: 2000. [Google Scholar]
- 37.Finlayson-Pitts BJ, Sweetman LL, Weissbart B. Toxicol Appl Pharmacol. 1987;89:438–448. doi: 10.1016/0041-008x(87)90163-3. [DOI] [PubMed] [Google Scholar]
- 38.Gallon AA, Pryor WA. Lipids. 1993;28:125–133. doi: 10.1007/BF02535776. [DOI] [PubMed] [Google Scholar]
- 39.d’Ischia M, Rega N, Barone V. Tetrahedron. 1999;55:9297–9308. [Google Scholar]
- 40.O’Donnell VB, Chumley PH, Hogg N, Bloodsworth A, Darley-Usmar VM, Freeman BA. Biochemistry. 1997;36:15216–15223. doi: 10.1021/bi971891z. [DOI] [PubMed] [Google Scholar]
- 41.Hogg N, Kalyanaraman B, Joseph J, Struck A, Parthasarathy S. FEBS Lett. 1993;334:170–174. doi: 10.1016/0014-5793(93)81706-6. [DOI] [PubMed] [Google Scholar]
- 42.Rubbo H, Parthasarathy S, Barnes S, Kirk M, Kalyanaraman B, Freeman BA. Arch Biochem Biophys. 1995;324:15–25. doi: 10.1006/abbi.1995.9935. [DOI] [PubMed] [Google Scholar]
- 43.Balazy M, Iesaki T, Park JL, Jiang H, Kaminski PM, Wolin MS. J Pharmacol Exp Ther. 2001;299:611–619. [PubMed] [Google Scholar]
- 44.Lima ES, Di Mascio P, Rubbo H, Abdalla DS. Biochemistry. 2002;41:10717–10722. doi: 10.1021/bi025504j. [DOI] [PubMed] [Google Scholar]
- 45.Baldus S, Castro L, Eiserich JP, Freeman BA. Am J Respir Crit Care Med. 2001;163:308–310. doi: 10.1164/ajrccm.163.2.ed2000c. [DOI] [PubMed] [Google Scholar]
- 46.Gallon AA, Pryor WA. Lipids. 1994;29:171–176. doi: 10.1007/BF02536725. [DOI] [PubMed] [Google Scholar]
- 47.Napolitano A, Camera E, Picardo M, d’Ischia M. J Org Chem. 2000;65:4853–4860. doi: 10.1021/jo000090q. [DOI] [PubMed] [Google Scholar]
- 48.Napolitano A, Crescenzi O, Camera E, Giudicianni I, Picardo M, d’Ischia M. Tetrahedron. 2004;58:5061–5067. [Google Scholar]
- 49.Beckman JS, Beckman TW, Chen J, Marshall PA, Freeman BA. Proc Natl Acad Sci U S A. 1990;87:1620–1624. doi: 10.1073/pnas.87.4.1620. [DOI] [PMC free article] [PubMed] [Google Scholar]
- 50.Castro L, Eiserich JP, Sweeney S, Radi R, Freeman BA. Arch Biochem Biophys. 2004;421:99–107. doi: 10.1016/j.abb.2003.08.033. [DOI] [PubMed] [Google Scholar]
- 51.Bateman L, Morris J. Trans Faraday Soc. 1953;49:1026–1032. [Google Scholar]
- 52.d’Ischia M. Tetrahedron Lett. 1996;37:5773–5774. [Google Scholar]
- 53.Wang N, Verna L, Chen NG, Chen J, Li H, Forman BM, Stemerman MB. J Biol Chem. 2002;277:34176–34181. doi: 10.1074/jbc.M203436200. [DOI] [PubMed] [Google Scholar]
- 54.Li AC, Binder CJ, Gutierrez A, Brown KK, Plotkin CR, Pattison JW, Valledor AF, Davis RA, Willson TM, Witztum JL, Palinski W, Glass CK. J Clin Invest. 2004;114:1564–1576. doi: 10.1172/JCI18730. [DOI] [PMC free article] [PubMed] [Google Scholar]
- 55.Levy BD, Clish CB, Schmidt B, Gronert K, Serhan CN. Nat Immunol. 2001;2:612–619. doi: 10.1038/89759. [DOI] [PubMed] [Google Scholar]
- 56.Bannenberg GL, Chiang N, Ariel A, Arita M, Tjonahen E, Gotlinger KH, Hong S, Serhan CN. J Immunol. 2005;174:4345–4355. doi: 10.4049/jimmunol.174.7.4345. [DOI] [PubMed] [Google Scholar]


