Abstract
The local diffusion constant of K+ inside the Gramicidin A (GA) channel has been calculated using four computational methods based on molecular dynamics (MD) simulations, specifically: Mean Square Displacement (MSD), Velocity Autocorrelation Function (VACF), Second Fluctuation Dissipation Theorem (SFDT) and analysis of the Generalized Langevin Equation for a Harmonic Oscillator (GLE-HO). All methods were first tested and compared for K+ in bulk water—all predicted the correct diffusion constant. Inside GA, MSD and VACF methods were found to be unreliable because they are biased by the systematic force exerted by the membrane-channel system on the ion. SFDT and GLE-HO techniques properly unbias the influence of the systematic force on the diffusion properties and predicted a similar diffusion constant of K+ inside GA, namely, ca. 10 times smaller than in the bulk. It was found that both SFDT and GLE-HO methods require extensive MD sampling on the order of tens of nanoseconds to predict a reliable diffusion constant of K+ inside GA.
Keywords: Ionic diffusion coefficient, Molecular dynamics simulation, Gramicidin A, Potassium
1. Introduction
There is a great deal of interest in studying biological ion channels due to the important roles that they play in the physiology of organelles, cells and tissues. With the availability of detailed atomistic structures of several ion channels (Gramicidin A (GA) [1], KcsA potassium channel [2], α-hemolysin [3], ClC chloride channel [4]) it has become feasible to do accurate theoretical modeling of ion currents in order to understand the mechanisms of ion transport through biological channels. At present, the most popular methods of ion current modeling are Poisson–Nernst–Planck (PNP) [5–10], Brownian Dynamics (BD) [11–16] and Non-equilibrium Molecular dynamics (NEMD) [17–19]. Of these methods PNP is the most primitive but fastest method. In PNP, ions are represented by continuous densities whose steady state concentrations are calculated in the electrostatic field due to partial charges on the protein and mobile ion charge densities, plus a contribution due to external electrodes, by solving Poisson's equation self-consistently with a Nernst–Planck equation for each ion species [5]. In BD, ions are modeled explicitly but water is treated implicitly as a continuous medium characterized by dielectric and friction constants. In BD, ions move in the electrostatic field of partial charges on the protein, surface charges induced on dielectric boundaries within the system, externally applied electric fields, pairwise electrostatic interactions with other ions and steric overlap interactions with other ions and the walls of the protein/membrane system [12]. In NEMD the entire system, including water, is modeled explicitly and the dynamics of all atoms is computed by numerical integration of Newton's second law using an atomistic force field [17–19]. Therefore, NEMD is the most accurate method, but very slow compared to PNP and BD and still not very practical.
For calculating ion currents, both PNP and BD methods rely heavily on the magnitude of the diffusion constant inside the channel, which is a phenomenological input into these theories. To date, there are no direct experimental measurements of diffusion constants of ions inside narrow pores. Therefore, one must rely on simulations to predict diffusion constants, and, indeed, several theoretical methods have been developed for this purpose. They are widely used for calculating diffusion properties of ions and molecules in bulk phases [20–22], but the applicability of some of these methods to narrow ion channels (e.g., Gramicidin A) is questionable. Currently, there is no consensus in the biophysics literature about the magnitude of diffusion constants of ions inside narrow channels [6,23–28]. Different methods and authors have predicted a wide range of diffusion constants. Therefore, it is imperative to test and compare different methods to assess their applicability in narrow channels and to estimate the value of the diffusion constants of ions inside such channels.
An important question that has to be addressed first is how to define the diffusion constant. In fact, the diffusion constant can be defined in many different ways depending on the model used to describe transport of ions across the channel. In Brownian (Smoluchowski) Dynamics and PNP-like models the flux of ion species i is expressed as
| (1) |
where Di is the diffusion constant for this species, ci(r→ , t) is its concentration and ψi(r→ ) is its free energy or potential of mean force (PMF); furthermore, (kB is Boltzmann's constant and T is absolute temperature). The free energy of an ion at a given position in space arises from its interactions with the protein, membrane, and water molecules. In particular, these interaction forces can be attributed to electrostatic interactions of the ion with the partial charges of the protein and membrane, rotational polarization of water, rotational/ translational polarization of protein and membrane groups as well as electronic polarization of the protein, membrane and water. It has been shown in several studies that translational/ rotational polarization of protein groups is important in electrostatic stabilization of ions inside narrow channels [6,29]. This is manifested in the flexibility of key protein groups that relax locally around the ion and stabilize it, ultimately rendering permeation more favorable.
Let us briefly review what has been done to date to calculate diffusion constants of ions inside narrow channels. The most widely employed methods for calculating diffusion constants are based on extracting the mean square displacement (MSD) or the velocity autocorrelation function (VACF) from MD simulations. In Ref. [23], the diffusion constants inside smooth cylindrical channels with repulsive walls of different width and length were calculated using the MSD method for Na+, K+, Cs+, Ca2+, F−, Cl− and I− ions. It was observed that the diffusion constants decreased as the radius of the channel decreased. In a 3 Å radius channel the diffusion constant of K+ was found to be ca. 5 times smaller than in the bulk water. This decrease was attributed to two main factors, one being an increase in the mean square of random forces on the ions as the channel gets narrower and the second an increase in time scale of random force correlations. In Ref. [24], the diffusion constants of K+ and Na+ were estimated using the MSD method from MD simulations in hydrophobic cylindrical channels with varying radii, as well as in the KcsA potassium channel. In a 3 Å radius hydrophobic channel the diffusion constants for both K+ and Na+ were ca. 12% of the bulk value. In Ref. [25] mobilities of K+ and Cl− were studied by extracting MSD and VACF functions from MD simulations inside five different channels with radii ranging from 2 Å to 6 Å. It was found that the diffusion constants were 2–10 times smaller than in the bulk solution depending on the channel width and the position where the probe ion was released. In a 2 Å radius channel the diffusion constant was found to be on average 10 times smaller than in the bulk. In Ref. [30], friction coefficients of K+ and Na+ ions were evaluated by fitting the analytical expression for the VACF of a Brownian harmonic oscillator to the VACF obtained from MD simulations inside the KcsA potassium channel. The authors of this study found diffusion constants of K+ and Na+ ca. 3 times smaller inside the channel. In Ref. [28] the effective diffusion constant of K+ and Na+ ions was estimated inside a Gramicidin-like β-helix using two methods. The first method utilized the effect that the dependence of the terminal velocity on the external weak force applied to the ion is proportional to the diffusion constant. The other methods used in Ref. [28] were based on the second fluctuation dissipation theorem. Both methods predicted that the effective diffusion constant of K+ is 3–5 times smaller inside the β-helix compared to the bulk value. In our earlier study [6] the diffusion constant of K+ inside the Gramicidin A (GA) channel was calculated using the fluctuation dissipation theorem by extracting the force autocorrelation function (FACF) from MD simulations. A reduction of 8.5 times in diffusion constant compared to the bulk value was found inside the channel.
A different approach to calculation of diffusion constants is based on fitting the diffusion constant to reproduce experimental ion currents using BD or PNP. In Ref. [27] the potential energy well depth and barrier height as well as the internal diffusion constant were fit for the GA channel: a best fit was obtained when the diffusion constant inside the channel was taken to be 10 times smaller than in the bulk. It was found that the model did not reproduce the experimentally observed saturation of ion current with ionic concentration when the diffusion contant of K+ inside the channel was larger than 0.3 times the bulk value, implying that the value of this constant may critically influence the saturation properties of the channel. In Ref. [7] the internal diffusion constant of Cs+ (K+) had to be decreased 11 (17) times compared to the bulk in calculations of ion currents via the PNP model in order to get agreement with experimental results. The overall conclusion drawn from these studies is that diffusion constants of ions in narrow channels are roughly 3–10 times smaller than in the bulk. In contrast to this conclusion, it was found in Ref. [26] that the diffusion constant of K+ inside the GA channel is not much different from the bulk. These authors used MD simulations of K+ restrained with a harmonic potential and mapped this microscopic dynamics to the generalized Langevin equation (GLE). They estimated that the internal diffusion constant was 66% of its bulk value.
The goal of the present study is to calculate the diffusion constant of K+ ion inside the GA channel using four different methods based on MD simulations. The paper is organized in the following way. The theoretical basis of the methods and their computational implementation are described in Methods. The main results of our study are reported in the Results and discussion, and our main conclusions are summarized in the Conclusions.
2. Methods
2.1. Theory
We will compare four methods for calculating diffusion constants of ions in bulk water and inside the GA channel. The first method is based on the MSD of a particle from its initial position [31]:
| (2) |
where D is the one dimensional diffusion constant1, and 〈Δz(t)2〉 is the mean square displacement at elapsed time t calculated as an average over all possible time origins along the MD trajectory.
The second method is based on calculation of the VACF [31]:
| (3) |
where v(t) is the ion's velocity.
The final two methods are based on the Generalized Langevin Equation (GLE) [31]:
| (4) |
where m is the ion's mass, Fsys is the systematic force, R(t) is the random force acting on the ion and M(t) is the appropriate memory function.
According to the second fluctuation dissipation theorem (SFDT), the memory function is related to the random force autocorrelation function (FACF) [20,32] according to
| (5) |
Using Einstein's relation and the connection between friction constant and memory function , then:
| (6) |
The last method [26,33,34] is based on an analysis of the GLE for a harmonic oscillator (GLE-HO). In Eq. (4) Fsys can be replaced with the harmonic oscillator force −kΔz(t), where Δz(t) is the displacement of the oscillator from its equilibrium position, and k is an appropriate Hooke's Law spring constant. The GLE then reads:
| (7) |
Using and various properties of the random force and equilibrium velocity distribution, one finds:
| (8) |
where is the normalized VACF of the ion. Laplace transforming this equation with gives:
| (9) |
The diffusion constant is related to the s→0 limit of the Laplace transform of the memory function through the Einstein relation:
| (10) |
Substituting M̂ (s) from Eq. (9) into Eq. (10) the following expression is obtained:
| (11) |
The Equipartition Theorem [31] for a harmonic oscillator implies that, and ; hence Eq. (11) can be rewritten as
| (12) |
The diffusion constant is then the s→0 limit of D̂ (s):
| (13) |
2.2. MD simulations
Molecular dynamics (MD) simulations of K+ ion in bulk water and inside the GA channel were carried out to calculate the diffusion constant of K+ using the four methods described in Theory. Two systems were built for the MD simulations: one consisted of K+ in bulk water, the other one was comprised of a K+ ion inside the GA channel. For the first system one K+ ion was solvated by 1077 SPC/E [35] water molecules. For the second system one K+ ion was placed inside the GA channel, embedded in a slab of 235 randomly positioned neutral Lennard-Jones spheres to mimic the hydrophobic environment of a membrane and solvated by 1020 SPC/E water molecules. One Cl− ion was placed outside the channel to neutralize the charge of the K+ ion (see Fig. 1). For the starting configuration, we used the NMR structure of GA downloaded from the Protein Data Bank (www.rcsb.org) with pdb code 1GRM [1]. Both systems were equilibrated first at constant volume, then at a constant pressure of 1 atm at 300 K. For all MD simulations, the SANDER module of the AMBER7 software package [36] was used. The modified Cornell et al. force field (parm99.dat) [37,38] was used for the ions and GA. The coordinates of the Lennard-Jones spheres were fixed during all MD simulations. To prevent drifting and misfolding of GA during long MD simulations a weak 1.0 kcal/mol/A2 harmonic restraining potential was applied to all backbone peptide carbon atoms. The Cl− ion was also restrained during MD simulations so as to keep it in the middle of the reservoir and thus prevent direct influence on the K+ motion.
Fig. 1.
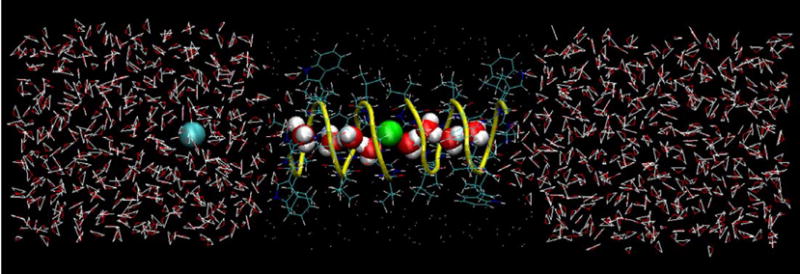
A snapshot from an MD simulation of Gramicidin A embedded in a model hydrophobic membrane and solvated by 1020 SPC/E water molecules. Potassium ion is shown in green, chloride ion in blue, peptide backbone in yellow, protein side chains in blue and neutral Lennard-Jones spheres (that constitute the membrane mimetic) as white dots. (For interpretation of the references to colour in this figure legend, the reader is referred to the web version of this article.)
For the MSD MD simulations, K+ was released and its coordinates collected every 10 fs for 4–6 ns of equilibrium simulation. The diffusion constant was calculated from the slope of the MSD versus time plot according to Eq. (2).
For the VACF MD simulations, K+ was released and the Cartesian components of its velocity were collected every 10 fs for 4–6 ns. VACFs were calculated from the velocity components and then numerically integrated to find the diffusion constant according to Eq. (3).
For the SFDT MD simulations, K+ was fixed at a particular point along the channel axis and the Cartesian components of the total force on the ion collected every 1 fs for 15–27 ns depending on the location. By fixing the ion we employed the infinitely heavy particle approximation [39] to satisfy a condition of the Generalized Langevin equation that the random force does not correlate with the velocity [32]. The random force acting on the ion was extracted by subtracting the time-averaged force from the instantaneous force value. From the random force, the FACF was calculated, numerically integrated and the diffusion constant found according to Eq. (6).
For the GLE-HO MD simulations, a harmonic restraint was applied to K+ in three–dimensions and the Cartesian components of the coordinate and velocity of K+ were collected every 10 fs for 27–42 ns depending on the location and the strength of the harmonic restraint employed. Then the normalized VACF was computed and Laplace transformed numerically to find D̂ (s) according to Eq. (12). The effect of the harmonic restraint strength on the ion diffusion constant was tested in the 4≤k≤40 kcal/mol/Å2 range (vide infra).
The potential of mean force (PMF) of K+ inside GA was calculated using the Umbrella Sampling technique [40] by restraining the ion in 3D via a harmonic potential of 4 kcal/mol/ Å2 with umbrella windows separated by 0.5 Å. The initial configurations for the umbrella windows were created by placing K+ at a particular position along the channel and checking for overlapping water molecules. If the ion–water and water–water steric overlaps disappeared in the energy minimization then the system was accepted for further equilibration; otherwise, overlapping water molecule(s) were manually moved to the bulk reservoir and the whole system was energy minimized again. These simulations were carried out for the ion restrained along one monomer only so that a total region of 16 Å was covered with umbrella windows. This was done because the GA channel system is symmetrical relative to the middle of the channel, and thus there is no need to repeat the simulations for the other monomer. For each umbrella window the coordinate of the ion was collected every 10 fs over a 1 ns interval. The PMF profile of K+ in the z direction was reconstructed using Weighted Histogram Analysis Method (WHAM) [41].
These simulations were carried out on 15 Dual AMD Athlon computer nodes and it took 30 h to complete 1 ns MD simulation on 2 CPUs.
3. Results and discussion
3.1. Calculation of diffusion constant of K+ in bulk water
The main results of applying the four methods described in Theory for K+ in bulk water are reported in Fig. 2 and Table 1. MSDs versus time plots of K+ in x, y and z are illustrated in Fig. 2A. The VACF of K+ in one dimension (the z direction) is shown in Fig. 2B. The correlation time of the VACF is ca. 1.5 ps. The FACF of K+ in the z direction is shown in Fig. 2C. The correlation time of the FACF is ca. 1 ps. The function D̂ (s) calculated using the GLE-HO method (Eq. (12)) is shown in Fig. 2D. The harmonic restraining force strength was varied over the range of 4≤k≤40 kcal/mol/A2 and found to have little effect on the shape of D̂ (s) in this case. Namely, at s<10 ps−1 the D̂ (s) function bends down as s→0+. In the 10<s<30 range it has a relatively linear shape and bends up at s>30 ps−1. We found that at very small s the smooth shape of D̂ (s) function is corrupted by a singularity near s=0, as has been observed previously [42]. We observed that the location of the singularity depends on the amount of MD sampling: longer simulations shifted the singularity to smaller s. For a 30 ns MD simulation the onset of the singularity went down to s=0.05 ps−1. Such dependence of the singularity on the length of the sampling suggests that it arises from numerical errors. Close inspection of Eq. (12) shows that at small s the final result depends critically on a delicate balance of arithmetic operations involving small and large numbers in the denominator. Therefore, small numerical errors in Ĉ(s), 〈v(0)2〉 or 〈 Δz(0)2〉 may get significantly amplified and lead to large errors in the final result. This assumption was further tested by calculating D̂ (s) analytically based on a functional fit to MD data for M(t), so that its shape should not be affected by numerical errors in Ĉ(s), 〈v(0)2〉 or 〈Δz(0)2〉. Results of this test are discussed in the next subsection. In practice, we extrapolated D̂ (s) to s=0 from the 0.05<s<0.2 range by ignoring the numerical singularity at s<0.05. This resulted in a diffusion constant of 0.19 Å2/ps, i.e., the same as predicted by the other three methods (Table 1).
Fig. 2.
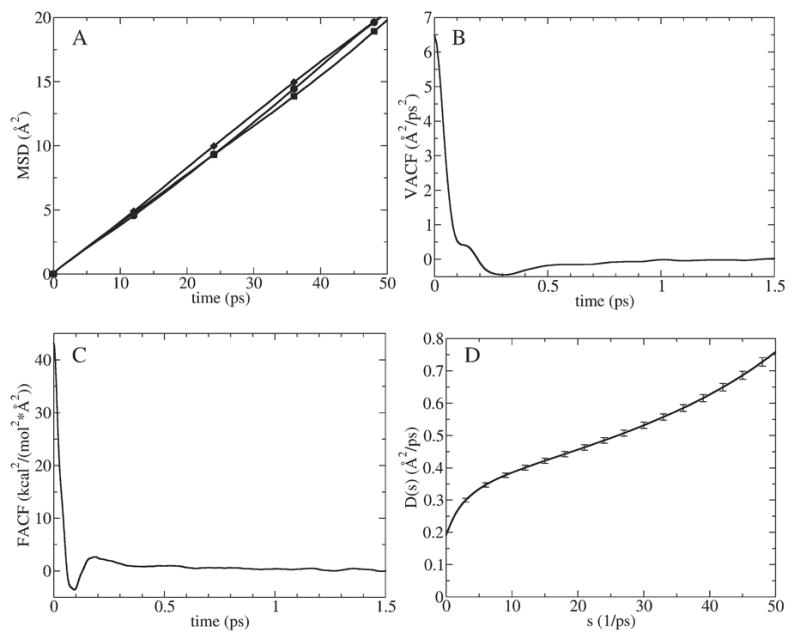
Calculation of K+ diffusion constants in bulk water using four methods described in Theory. (A) MSD plots in x (circles), y (squares) and z (diamonds) directions. (B) VACF in z direction. (C) FACF in z direction. (D) D̂ (s) function (with error bars) in z direction.
Table 1.
Diffusion constants of K+ in bulk water calculated using the four methods described in “Theory”
| MSD | VACF | SFDT | GLE-HO | |
|---|---|---|---|---|
| D (Å2/ps) | 0.2 | 0.19 | 0.18 | 0.19 |
Recently, Hummer [43] proposed an alternative form of expression for Eq. (12), which in the limit of an overdamped harmonic oscillator uses the position autocorrelation function 〈Δz(t)Δz(0)〉 instead of C(t) and avoids this singularity. However, this procedure also requires a long MD simulation, because the position autocorrelation function and its time integral depend delicately on the simulation length.
3.2. Analytic test of D̂ (s) behavior at small s in bulk water
The behavior of D̂ (s) as s→0 has been further investigated by extracting it analytically from an appropriate functional representation of the memory function according to Eq. (10). In particular, an analytic form for M(t) was determined by fitting the memory function extracted from MD simulation of the force autocorrelation function with the ion fixed in space; cf. Eq. (5). A function composed of two damped cosine waves with six parameters M(t) ≅ a0e−a1 t cos(a2t)+ a3e−a4 t cos(a5t) was found to give a good fit (cf. Fig. 3A) using the regression analysis feature of the GRACE program (http://plasma-gate.weizmann.ac.il/Grace/). The optimal fit parameters for this fitting function are given in Table 2. D̂ (s) obtained from MD using the GLE-HO method (Eq. (12)) is compared in Fig. 3B with the version of D̂ (s) obtained by analytical Laplace transformation of our functional fit to M(t) (cf. Eq. (10)), which we will term the “analytic” D̂ (s). Both D̂ (s) functions have the same linear shape in the 10<s<30 range and bend down towards the same value at s=0. No singularity was observed for the analytic D̂ (s) function, which provides further evidence that the singularity obtained in Fig. 2D is a numerical artifact.
Fig. 3.
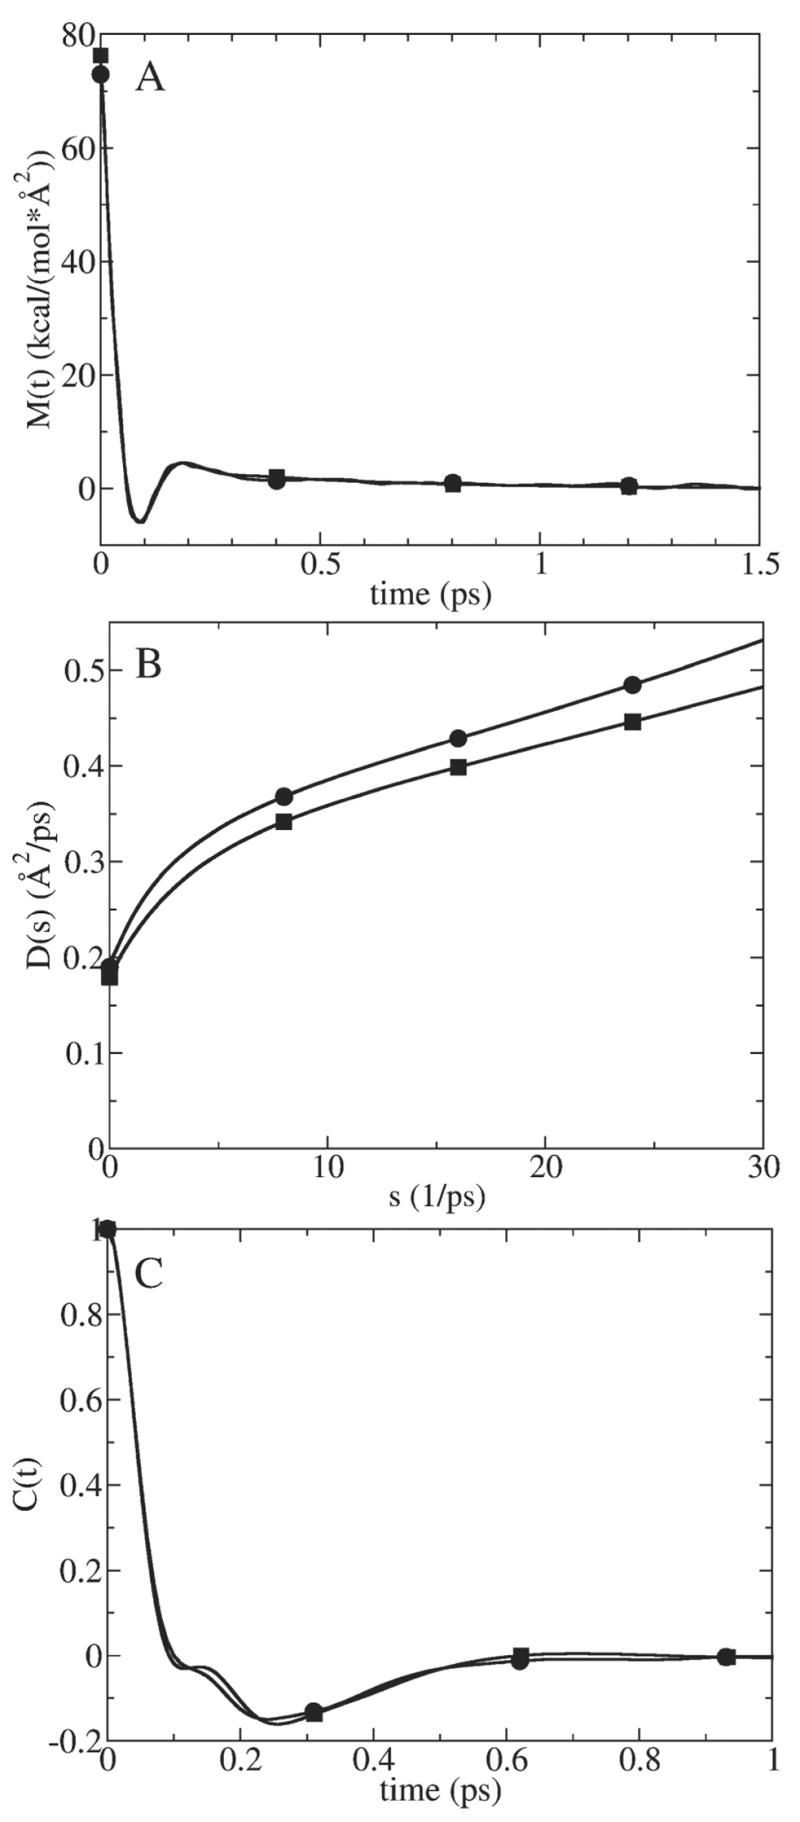
Analytic test of D̂ (s) behavior at small s for K+ in bulk water. (A) Memory function calculated using SFDT method, i.e. Eq. (5), from fixed ion MD simulations (circles) (corresponds to FACF illustrated in Fig. 2C) and its analytically fitted analog (squares). (B) D̂ (s) function calculated from MD using GLE-HO method, i.e. Eq. (12) (circles) and analytically derived using Eq. (10) from analytic M̂ (s) (squares). (C) C(t) calculated directly from MD for a harmonically restrained K+ (circles) and analytically derived using GLE-HO analysis, i.e. Eq. (14) from analytic M̂ (s) (squares).
Table 2.
Best fit parameters for analytic memory function of K+ in bulk SPC/E water fitted from fixed ion MD simulations (cf. Eq. (5))
| a0 | a1 | a2 | a3 | a4 | a5 |
|---|---|---|---|---|---|
| 70.92 | 19.86 | −28.97 | 5.343 | 2.472 | −0.0007743 |
Using Eq. (9) associated with the GLE-HO method, the normalized VACF C(t) can be found by inverse Laplace transformation of a function that contains the Laplace transform of the memory function, namely:
| (14) |
We calculated C(t) using the above equation with the analytic form of M̂ (s) described above. Alternatively, C(t) was calculated directly from MD simulations of K+ restrained with the same harmonic force constant as used to calculate C(t) analytically (i.e., Eq. (14)). These functions compare well, as shown in Fig. 3C.
3.3. Calculation of K+ PMF in the GA channel
The PMF profile of K+ along the z (channel) axis inside GA is shown in Fig. 4: z=0 corresponds to the middle of the channel. It can be seen that there is some periodicity in the PMF profile, which is related to the helical structure of the GA channel. The maximum barrier for a K+ ion inside the channel is 7.5 kcal/mol. The PMF of K+ inside GA has been calculated previously using the CHARMM PARAM27 force field and TIP3P water model [26]. Both PMFs exhibit similar features such as periodicity and a maximum barrier of approximately 7 kcal/mol. This demonstrates that both force fields predict similar behavior for K+ inside the GA channel.
Fig. 4.
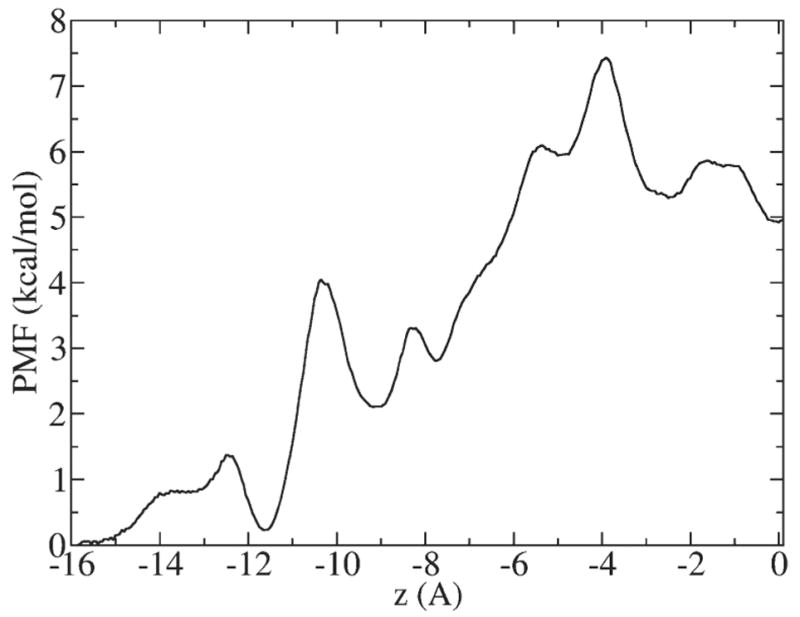
PMF profile of K+ along z (channel) direction inside GA. The origin of the coordinate system coincides with the center of the channel.
According to the Smoluchowski equation, in the absence of an externally applied electric field and ion–ion interactions an ion diffuses in the force field implied by its PMF. Thus, it is instructive to consult the PMF when calculating the position-dependent diffusion constant as will be described in the next subsection.
3.4. Calculation of the K+ diffusion constant inside the GA channel
The main results of our calculations of K+ diffusion constants inside the GA channel are summarized in Table 3. MSDs in x, y and z directions are illustrated in Fig. 5A. At short times up to 1 ps all MSDs have the same slope. This is the average time over which K+ is unconstrained by the cage formed by the walls of the channel in the x and y directions and neighboring water molecules in the z direction. This “free diffusion” time period is nearly the same because the size of the cage is similar in x, y and z directions. A diffusion constant calculated from these data reflects the (nearly) free diffusion properties of the ion inside the cage and therefore cannot be used to represent its long time behavior. MSDs in the x and y direction (perpendicular to the channel) reach a plateau at several picoseconds because of the channel wall constraints. The MSD curve in the z direction continues to increase with time. We tested how the shape of the MSD in the z direction depends on the location at which K+ is released inside GA. MSD plots in z direction of K+ released at five different locations are illustrated in Fig. 5B. All MSDs have the same slope up to ca. 10 ps and then diverge at longer time. This strong dependence of MSD on the ion's release location reflects the spatial inhomogeneity of the PMF (see, Fig. 4) which governs motion of the ion inside the channel.
Table 3.
Diffusion constants of K+ inside the Gramicidin A channel calculated using the four methods described in Theory
| MSD | VACF | SFDT | GLE-HO | |
|---|---|---|---|---|
| D (Å2/ps) | ~0–0.0145 | 0.000035–0.0075 | 0.019±0.008 | 0.016±0.004 |
Fig. 5.
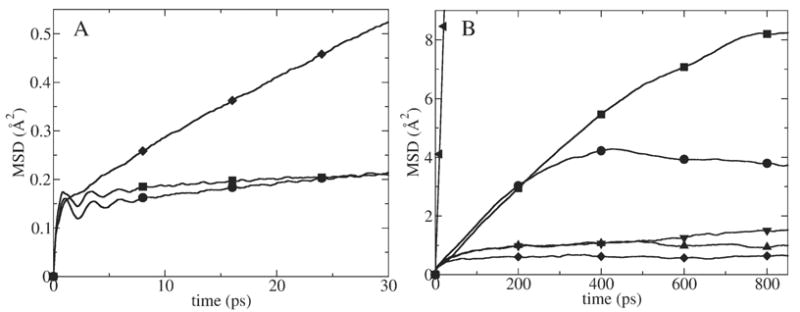
MSDs of K+ released at several different locations inside GA. (A) MSD in x (circles), y (squares) and z (diamonds) directions when K+ was released in the center of the channel. (B) MSDs in z (channel) direction for K+ released in the center (circles), 2.4 Å away from the center (squares), 5 Å away from the center (diamonds), 8.4 Å away from the center (triangles up) and 9.2 Å away from the center (triangles down) of the channel. They are compared to one dimensional MSD of K+ in bulk water (triangles left).
When the ion was released at the center and at 2.4 Å from the middle of the channel, the MSD in z direction had the same shape for up to 250 ps (Fig. 5B) because the ion moved in the same free energy basin (see, Fig. 4). These MSDs deviate from each other after 250 ps because in the 2.4 Å release case the ion traveled further away from the release location. The long time dynamics saturates with time for all these MSDs. Due to strong position dependence of the MSD functions, estimation of diffusion constants is difficult. We estimated the lower and the upper limit of the calculated diffusion constant. An upper limit for the diffusion constant, calculated from the largest MSD slope corresponding to the 10–250 ps region (i.e., prior to saturation of the MSD for the ion released at the center and 2.4 Å away from the center of the channel), was found to be 0.0146 Å2/ps—approximately 14 times smaller than in the bulk. A lower limit of the diffusion constant was calculated from the slope of the 200–1000 ps region of the MSD function for the K+ ion released 5 Å away from the middle of the channel. The diffusion constant in this case is close to zero because the ion remained within a narrow local free energy well during the whole simulation time.
Now let us examine the results of applying the VACF method, i.e. Eq. (3), for calculating the diffusion constant of K+ inside GA. In Fig. 6A the VACF of the ion inside the channel is compared with its bulk water analog. The z-component of the VACF inside the channel has a more complex shape characterized by two major minima, one occurring at 0.07 ps and the other at 0.18 ps. The negative part of the VACF is more pronounced than in bulk water. This suggests that there is a larger back scattering of the ion from the neighboring water molecules although the decorrelation time is the same, ca. 1 ps. Comparison of the VACF inside the channel in the z direction with that in the x and y directions is shown in Fig. 6B. Again, the VACF in the z direction has a more complex shape: the VACFs in the x and y directions have only one minimum and do not have a flat region. The complex shape of the VACF in the z direction compared to bulk water analog and the internal ion VACF in the x and y directions suggest a more complex character of the correlations between particles moving in single file where the motions of individual molecules are coupled in a non-trivial way with the motion of the single file chain.
Fig. 6.
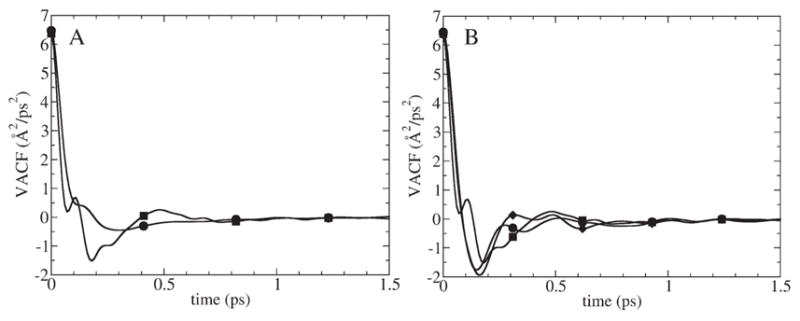
(A) Velocity Autocorrelation Function (VACF) of K+ in z direction in bulk water (circles) and in the center of GA (squares). (B) VACF in x (circles), y (diamonds) and z (squares) directions for K+ released in the center of GA.
Diffusion constants calculated using the VACF method for K+ released at different locations inside GA are reported in Table 4. When the ion is released in the center and at 2.4 Å the diffusion constants are the same, namely, ca. 26 times smaller compared to the bulk. When the ion is released 5 Å away from the middle of the channel the diffusion constant is 550 times smaller (nearly zero) than in the bulk. When the ion is released at 8.2 Å and 9.2 Å away from the center the diffusion constants are the same and ca. 72 times smaller than in the bulk. This dependence of the diffusion constant on the location of release has the same trend as calculated using MSD method, although the absolute value of the diffusion constants calculated by VACF method is on average two times smaller (Table 3).
Table 4.
Diffusion constants of K+ inside GA calculated using the VACF method with the ion released at different locations inside the channel
| Distance from the center of GA | 0 Å | 2.4 Å | 5 Å | 8.2 Å | 9.2 Å |
|---|---|---|---|---|---|
| D (Å2/ps) | 0.0075 | 0.0075 | 0.000035 | 0.0027 | 0.0027 |
FACFs and integrals of the FACF for K+ fixed at three different locations inside GA are shown in Fig. 7. We found that the FACFs inside the channel have much longer correlation tails (namely, ca. 80 ps) than in the bulk. This suggests that there are much longer correlation (or memory) effects inside the channel. Comparison of the mean values of the squared random forces in bulk and in the channel is provided in Table 5. We found that the mean squared random force in the channel is ca. 1.6 times larger than in the bulk. This is another manifestation of stronger interactions between K+ and water molecules in the channel. It was found that the error bars for integrals of the FACFs are very large (also shown in Fig. 7) although they were calculated from long MD simulations of ca. 40 ns. (We could not do much longer MD sampling due to computer time limitations.) The diffusion constant calculated as the arithmetic average of three integrals (corresponding to three positions along the channel axis, as described in Fig. 7) is 9 times smaller compared to bulk with the lower limit being 5.7 and the upper limit 12.3 times smaller than in the bulk. We have identified that the two main reasons for such a large depression of the diffusion constant inside the channel are larger mean square random forces and longer random force correlation time. Other workers have reached the same conclusion about the depression of diffusion constants of ions inside model hydrophobic channels [23].
Fig. 7.
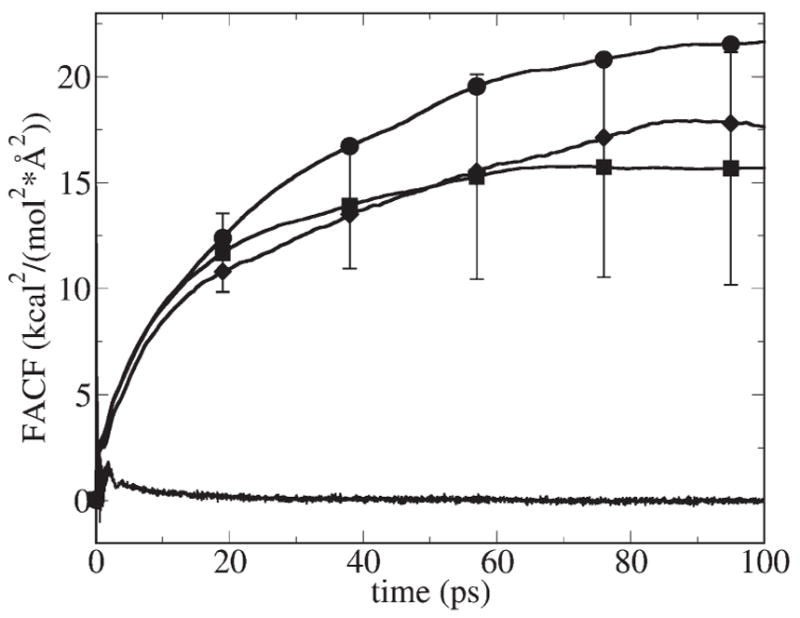
Force Autocorrelation Function (FACF) (jagged line on the bottom) for K+ fixed in the center of GA, and integrals of the FACF with error bars for K+ fixed in the center of the channel (squares), 2.5 Å away from the center of the channel (circles), and 11.5 Å away from the center of the channel (diamonds).
Table 5.
Comparison of the mean value of the squared random force in bulk SPC/E water and inside GA
| Bulk water | Center of GA | |
|---|---|---|
| 〈R2〉 (kcal2/mol2/Å2) | 43.1 | 69.5 |
Now let us look at the results calculated using the GLE-HO method, i.e. Eq. (12). The D̂ (s) function of K+ restrained in the center of GA is compared with the one in bulk water in Fig. 8. For both systems the D̂ (s) function bends down at s<10 ps−1. We encountered the same singularity of D̂ (s) function at small s as in the bulk water simulations and were able to shift it to smaller s by increasing the simulation time. As our analytical test above showed, this singularity is almost certainly a numerical artifact and therefore is ignored in extrapolating the numerical D̂ (s) function to s→0.
Fig. 8.
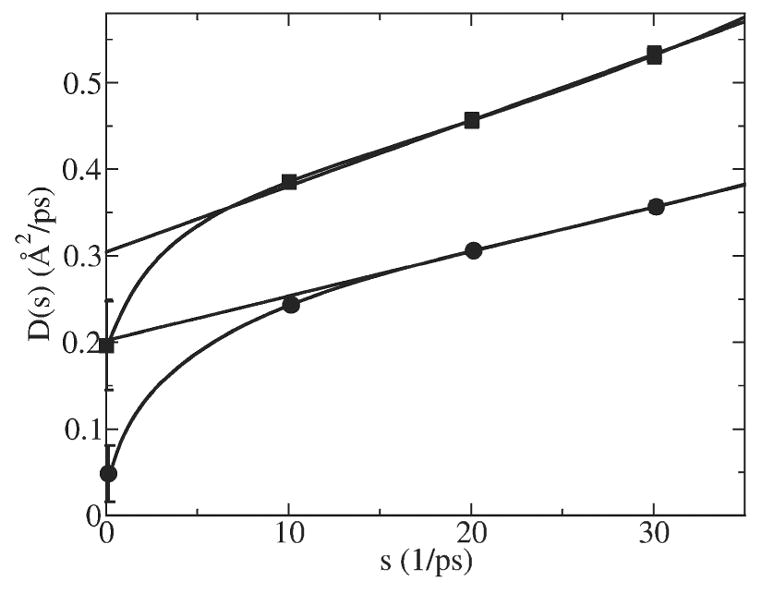
D̂ (s) function calculated using GLE-HO method for K+ in bulk water (squares) and in the center of GA (circles) along with extrapolations from the 15<s<35 range (the extrapolation range used in Ref. [26]).
We tested how the strength of the harmonic restraint in the 4≤k≤40 kcal/mol/Å2 range affects the behavior of D̂ (s) function, as illustrated in Fig. 9. It was found that a harmonic restraint of k<20 kcal/mol/Å2 resulted in a low diffusion constant, ca. 40 times smaller than in the bulk (Fig. 9A). When a stronger harmonic restraint was used, 20≤k≤40 kcal/mol/Å2, then the diffusion constant was found to be ca. 13 times smaller compared to bulk (Fig. 9B). The purpose of a harmonic restraint is to overwhelm the influence of the actual systematic force on the dynamics of the ion by a harmonic force. The reason for this is that it is difficult to accurately calculate the actual position dependent systematic force. It is thus advantageous to replace the full systematic force by a known harmonic oscillator force that can later be easily unbiased using GLE-HO analysis to extract a diffusion constant. If the harmonic restraint is weak it cannot effectively overcompensate for the effect of the systematic force. This can lead to a large error in diffusion constant.
Fig. 9.
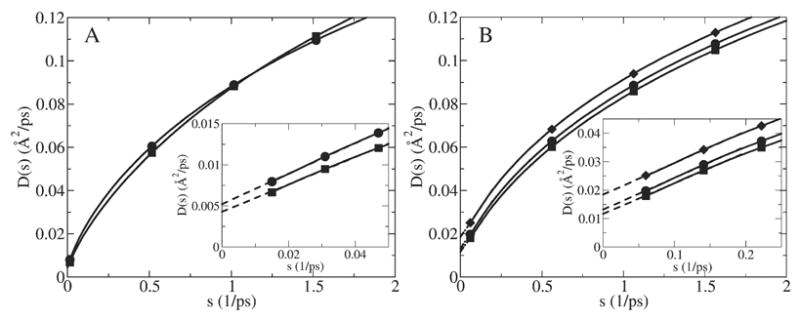
D̂ (s) function calculated using GLE-HO method, i.e. Eq. (12), for K+ restrained with different harmonic restraints in the center of GA. (A) k=4 kcal/mol/Å2 (squares) and k=8 kcal/mol/Å2 (circles). (B) k=24 kcal/mol/Å2 (diamonds), k=32 kcal/mol/Å2 (squares) and k=40 kcal/mol/Å2 (circles). A blowup of the D̂ (s) functions at small s is shown in the insets. The broken line represents where the D̂ (s) function was linearly extrapolated to s=0 (broken lines).
We also calculated the D̂ (s) function for harmonic restraints applied at several different locations inside the channel, as illustrated in Fig. 10. At all locations it leads to a diffusion constant significantly (4–13 times) smaller than in the bulk.
Fig. 10.
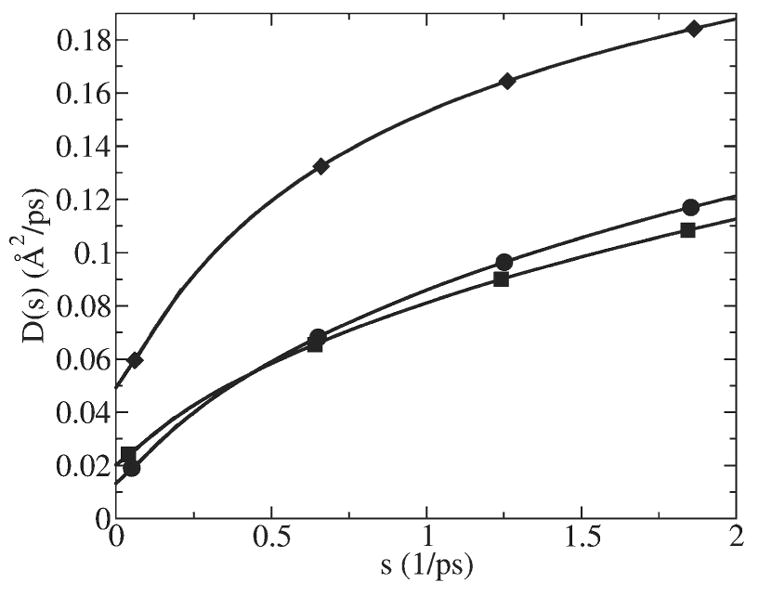
D̂ (s) function calculated using GLE-HO method for K+ restrained at three different locations along the channel (z axis) with harmonic constant of 40 kcal/mol/Å2: 5.2 Å away from the center (diamonds), 2.4 Å away from the center (squares) and in the center of the channel (circles).
Calculation of the diffusion constant of K+ in bulk TIP3P water and inside GA channel has been carried out by other researchers [26]. In their work a 10 kcal/mol/Å2 harmonic restraint was used for K+ and the function D̂ (s) was extrapolated to s=0 from the 15<s<35 range. They found that the diffusion constant inside GA is 66% of the bulk value. Our computations show that the D̂ (s) function significantly bends down at s<15 and thus that extrapolation from the 15<s<35 range results in a significant overestimation of the diffusion constant, namely, a value about 66% of the bulk—the same as in Ref. [26]. Such an extrapolation of D̂ (s) from the 15<s<35 range to s ≅ 0 is shown in Fig. 8 for K+ in bulk water (squares) and in the center of GA (circles). The fact that this function bends to such small values of D̂ (s) is another manifestation of long time correlation effects inside GA.
As noted above, the diffusion constants of K+ inside GA predicted by the different methods are collected in Table 3. For MSD and VACF methods we give the lower and the upper limits of the diffusion constant. Of the methods investigated here, SFDT and GLE-HO predicted a similar diffusion constant roughly 10 times smaller compared to the bulk. This value of the diffusion constant is in good agreement with results predicted by other workers as noted in the Introduction [23,27]. The results of our study strongly suggest that SFDT and GLE-HO are the two most reliable extant methods for calculating the diffusion constant of ions inside narrow ion channels. We found that MSD and VACF methods are not reliable because of their strong dependence on the position along the channel from which the ion is released. But, perhaps surprisingly, the upper limit (0.0145 Å2/ps) predicted by MSD method is not very far from the diffusion constant predicted by SFDT and GLE-HO methods.
4. Conclusions
There are two main conclusions of this study. The first conclusion is that all four methods predict that diffusion constant of K+ inside the GA channel is significantly (at least 4 times) smaller than in bulk water. We have identified a possible explanation for the large diffusion constant of K+ inside GA calculated by GLE-HO method reported recently [26], namely extrapolation of D̂ (s) to s=0, based on its “intermediate s” behavior (which misses critical details of D̂ (s) near s=0; see Fig. 8).
The second conclusion is that of the four methods considered here, SFDT and GLE-HO predict a similar diffusion constant which is ca. 10 times smaller than in bulk water. The other two methods, MSD and VACF, predict a much smaller diffusion constant compared to the bulk. We attribute this to the fact that SFDT and GLE-HO methods correctly unbias the influence of the systematic force on the diffusion properties of the ion, while MSD and VACF do not. Therefore, the MSD and VACF methods inject unwanted information about the systematic force (manifested in the PMF), resulting in predicted diffusion constants which are quite different than when calculated by SFDT and GLE-HO methods.
Acknowledgments
The work of ABM and RDC was supported in part by grants from NSF (Grant CHE0092285) and ARO-MURI (Grant DADD19-02-1-0227). MGKs research was supported in part by the NIH (Grant GM067962).
Footnotes
We will consider only one dimensional diffusion because diffusion of ions inside the GA channel is essentially a one dimensional phenomenon. Subscripts x, y or z will be dropped throughout: when necessary it will be explicitly noted in the text which direction is relevant.
References
- 1.Lomize AL, Orekhov V, Arsenev AS. Refinement of the spatial structure of the gramicidin A ion channel. Bioorg Khim. 1992;18:182–200. [PubMed] [Google Scholar]
- 2.Doyle DA, Morais Cabral J, Pfuetzner RA, Kuo A, Gulbis JM, Cohen SL, Chait BT, MacKinnon R. The structure of the potassium channel: molecular basis of K+ conduction and selectivity. Science. 1998;280:69–77. doi: 10.1126/science.280.5360.69. [DOI] [PubMed] [Google Scholar]
- 3.Song L, Hobaugh MR, Shustak C, Cheley S, Bayley H, Gouaux JE. Structure of staphylococcal alpha-hemolysin, a heptameric transmembrane pore. Science. 1996;274:1859–1866. doi: 10.1126/science.274.5294.1859. [DOI] [PubMed] [Google Scholar]
- 4.Dutzler R, Campbell EB, Cadene M, Chait BT, MacKinnon R. X-ray structure of a ClC chloride channel at 3.0 A reveals the molecular basis of anion selectivity. Nature. 2002;415:287–294. doi: 10.1038/415287a. [DOI] [PubMed] [Google Scholar]
- 5.Kurnikova MG, Coalson RD, Graf P, Nitzan A. A lattice relaxation algorithm for three-dimensional Poisson–Nernst–Planck theory with application to ion transport through the gramicidin A channel. Biophys J. 1999;76:642–656. doi: 10.1016/S0006-3495(99)77232-2. [DOI] [PMC free article] [PubMed] [Google Scholar]
- 6.Mamonov AB, Coalson RD, Nitzan A, Kurnikova MG. The role of the dielectric barrier in narrow biological channels: a novel composite approach to modeling single-channel currents. Biophys J. 2003;84:3646–3661. doi: 10.1016/S0006-3495(03)75095-4. [DOI] [PMC free article] [PubMed] [Google Scholar]
- 7.Cardenas AE, Coalson RD, Kurnikova MG. Three-dimensional Poisson–Nernst–Planck theory studies: influence of membrane electrostatics on gramicidin A channel conductance. Biophys J. 2000;79:80–93. doi: 10.1016/S0006-3495(00)76275-8. [DOI] [PMC free article] [PubMed] [Google Scholar]
- 8.Barcilon V, Chen DP, Eisenberg RS. Ion flow through narrow membrane channels: part II. SIAM J Appl Math. 1992;52:1405–1425. [Google Scholar]
- 9.Noskov SY, Im W, Roux B. Ion permeation through the alpha-hemolysin channel: theoretical studies based on Brownian dynamics and Poisson–Nernst–Plank electrodiffusion theory. Biophys J. 2004;87:2299–2309. doi: 10.1529/biophysj.104.044008. [DOI] [PMC free article] [PubMed] [Google Scholar]
- 10.Hollerbach U, Eisenberg RS. Concentration-dependent shielding of electrostatic potentials inside the gramicidin A channels. Langmuir. 2002;18:3626–3631. [Google Scholar]
- 11.Ermak DL, McCammon JA. Brownian dynamics with hydrodynamic interactions. J Chem Phys. 1978;69:1352–1360. [Google Scholar]
- 12.Graf P, Nitzan A, Kurnikova MG, Coalson RD. A dynamic lattice Monte Carlo model of ion transport in inhomogeneous dielectric environments: method and implementation. J Phys Chem, B. 2000;104:12324–12338. [Google Scholar]
- 13.Chung SH, Allen TW, Hoyles M, Kuyucak S. Permeation of ions across the potassium channel: Brownian dynamics studies. Biophys J. 1999;77:2517–2533. doi: 10.1016/S0006-3495(99)77087-6. [DOI] [PMC free article] [PubMed] [Google Scholar]
- 14.Corry B, Allen TW, Kuyucak S, Chung SH. Mechanisms of permeation and selectivity in calcium channels. Biophys J. 2001;80:195–214. doi: 10.1016/S0006-3495(01)76007-9. [DOI] [PMC free article] [PubMed] [Google Scholar]
- 15.Im W, Seefeld S, Roux B. A grand canonical Monte Carlo-Brownian dynamics algorithm for simulating ion channels. Biophys J. 2000;79:788–801. doi: 10.1016/S0006-3495(00)76336-3. [DOI] [PMC free article] [PubMed] [Google Scholar]
- 16.Cheng MH, Cascio M, Coalson RD. Theoretical studies of the M2 transmembrane segment of the Glycine receptor: models of the open pore structure and current–voltage characteristics. Biophys J. 2005;89:1669–1680. doi: 10.1529/biophysj.105.060368. [DOI] [PMC free article] [PubMed] [Google Scholar]
- 17.Crozier PS, Henderson D, Rowley RL, Busath DD. Model channel ion currents in NaCl-extended simple point charge water solution with applied-field molecular dynamics. Biophys J. 2001;81:3077–3089. doi: 10.1016/S0006-3495(01)75946-2. [DOI] [PMC free article] [PubMed] [Google Scholar]
- 18.Crozier PS, Rowley RL, Holladay NB, Henderson D, Busath DD. Molecular dynamics simulation of continuous current flow through a model biological membrane channel. Phys Rev Lett. 2001;86:2467–2470. doi: 10.1103/PhysRevLett.86.2467. [DOI] [PubMed] [Google Scholar]
- 19.Aksimentiev A, Schulten K. Imaging alpha-hemolysin with molecular dynamics: ionic conductance, osmotic permeability, and the electrostatic potential map. Biophys J. 2005;88:3745–3761. doi: 10.1529/biophysj.104.058727. [DOI] [PMC free article] [PubMed] [Google Scholar]
- 20.Koneshan S, Lynden-Bell RM, Rasaiah JC. Friction coefficients of ions in aqueous solution at 25 °C. J Am Chem Soc. 1998;120:12041–12050. [Google Scholar]
- 21.Chang TM, Dang LX. Detailed study of potassium solvation using molecular dynamics techniques. J Phys Chem, B. 1999;103:4714–4720. [Google Scholar]
- 22.Koneshan S, Rasaiah JC, Dang LX. Computer simulation studies of aqueous solutions at ambient and supercritical conditions using effective pair potential and polarizable potential models for water. J Chem Phys. 2001;114:7544–7555. [Google Scholar]
- 23.LyndenBell RM, Rasaiah JC. Mobility and solvation of ions in channels. J Chem Phys. 1996;105:9266–9280. [Google Scholar]
- 24.Allen TW, Kuyucak S, Chung SH. Molecular dynamics estimates of ion diffusion in model hydrophobic and KcsA potassium channels. Biophys Chemist. 2000;86:1–14. doi: 10.1016/s0301-4622(00)00153-8. [DOI] [PubMed] [Google Scholar]
- 25.Smith GR, Sansom MSP. Effective diffusion coefficients of K+ and Cl−ions in ion channel models. Biophys Chemist. 1999;79:129–151. doi: 10.1016/s0301-4622(99)00052-6. [DOI] [PubMed] [Google Scholar]
- 26.Allen TW, Andersen OS, Roux B. Energetics of ion conduction through the gramicidin channel. Proc Natl Acad Sci U S A. 2004;101:117–122. doi: 10.1073/pnas.2635314100. [DOI] [PMC free article] [PubMed] [Google Scholar]
- 27.Edwards S, Corry B, Kuyucak S, Chung SH. Continuum electrostatics fails to describe ion permeation in the gramicidin channel. Biophys J. 2002;83:1348–1360. doi: 10.1016/S0006-3495(02)73905-2. [DOI] [PMC free article] [PubMed] [Google Scholar]
- 28.Roux B, Karplus M. Ion transport in a gramicidin-like channel: dynamics and mobility. J Phys Chem. 1991;95:4856–4868. [Google Scholar]
- 29.Allen TW, Andersen OS, Roux B. On the importance of atomic fluctuations, protein flexibility, and solvent in ion permeation. J Gen Physiol. 2004;124:679–690. doi: 10.1085/jgp.200409111. [DOI] [PMC free article] [PubMed] [Google Scholar]
- 30.Burykin A, Kato M, Warshel A. Exploring the origin of the ion selectivity of the KcsA potassium channel. Proteins: Struct, Funct, Genet. 2003;52:412–426. doi: 10.1002/prot.10455. [DOI] [PubMed] [Google Scholar]
- 31.McQuarrie DA. Statistical Mechanics. Harper and Row; New York: 1976. [Google Scholar]
- 32.Kubo R. Many-body Theory. Syokabo and Benjamin; Tokyo: 1966. [Google Scholar]
- 33.Straub JE, Borkovec M, Berne BJ. Calculation of dynamic friction on intramolecular degrees of freedom. J Phys Chem. 1987;91:4995–4998. [Google Scholar]
- 34.Crouzy S, Woolf TB, Roux B. A molecular dynamics study of gating in dioxolane-linked Gramicidin A channels. Biophys J. 1994;67:1370–1386. doi: 10.1016/S0006-3495(94)80618-6. [DOI] [PMC free article] [PubMed] [Google Scholar]
- 35.Berendsen HJ, Grigera JR, Straatsma TP. The missing term in effective pair potentials. J Phys Chem. 1987;91:6269–6271. [Google Scholar]
- 36.Pearlman DA, Case DA, Caldwell JW, Ross WS, Cheatham TE, Debolt S, Ferguson D, Seibel G, Kollman P. Amber, a package of computer-programs for applying molecular mechanics, normal-mode analysis, molecular-dynamics and free-energy calculations to simulate the structural and energetic properties of molecules. Comput Phys Commun. 1995;91:1–41. [Google Scholar]
- 37.Wang JM, Cieplak P, Kollman PA. How well does a restrained electrostatic potential (RESP) model perform in calculating conformational energies of organic and biological molecules? J Comput Chem. 2000;21:1049–1074. [Google Scholar]
- 38.Cornell WD, Cieplak P, Bayly CI, Gould IR, Merz KM, Ferguson DM, Spellmeyer DC, Fox T, Caldwell JW, Kollman PA. A second generation force field for the simulation of proteins, nucleic acids, and organic molecules. J Am Chem Soc. 1995;117:5179–5197. [Google Scholar]
- 39.Wilson MA, Pohorille A, Pratt LR. Molecular dynamics test of the Brownian description of Na+ motion in water. J Chem Phys. 1985;83:5832–5836. [Google Scholar]
- 40.Torrie GM, Valleau JP. Nonphysical sampling distributions in Monte Carlo free-energy estimation: umbrella sampling. J Comput Phys. 1977;23:187–199. [Google Scholar]
- 41.Kumar S, Bouzida D, Swendsen RH, Kollman PA, Rosenberg JM. The weighted histogram analysis method for free-energy calculations on biomolecules: I. The method. J Comput Chem. 1992;13:1011–1021. [Google Scholar]
- 42.Schumaker MF, Pomes R, Roux B. A combined molecular dynamics and diffusion model of single proton conduction through gramicidin. Biophys J. 2000;79:2840–2857. doi: 10.1016/S0006-3495(00)76522-2. [DOI] [PMC free article] [PubMed] [Google Scholar]
- 43.Hummer G. Position-dependent diffusion coefficients and free energies from Bayesian analysis of equilibrium and replica molecular dynamics simulations. New J Phys. 2005;7:1–14. [Google Scholar]


