

Abstract
The incidence of hip fracture has been studied extensively, but there is still some doubt whether the age-specific incidence is increasing. The proportion of trochanteric fractures has varied and has also been said to be increasing. We studied data on 1,730 prospectively registered cases from 1998–2003 and computed age- and gender-specific incidence rates for intracapsular and trochanteric fractures. The incidence of hip fracture for women over 50 years was 1,263 and for men 452 per 100,000. The proportion of trochanteric fractures was 38% for women and 41% for men. There was no significant difference in the proportion of trochanteric fractures either between or within the genders, and the proportion did not exceed 50% in any age group. These findings confirm the high incidence of hip fracture in Norway but do not indicate any increase. The proportion of trochanteric fractures also seems to be stable.
Résumé
L’incidence des fractures de la hanche a été souvent étudiée mais il persiste des doutes au sujet de l’accroissement avec l’âge. La proportion des fractures trochantériennes , variable, a été considéré en augmentation. Nous avons étudié 1730 cas enregistrés prospectivement de 1998 à 2003 en relevant l’incidence de l’âge et du sexe pour les factures intra-capsulaires et les fractures trochantériennes. L’incidence des fractures de la hanche chez les femmes de plus de 50 ans était de 1263/100 000 et pour les hommes de 452/100 000. La proportion de fractures trochantériennes était de 38% pour les femmes et de 41% pour les hommes. Il n’y avait pas de différence significative dans la proportion de fractures trochantériennes ni entre les sexes ni au sein d’un même sexe et la proportion n’excédait pas 50% dans chaque groupe. Ces chiffres confirment la grande incidence des fractures de la hanche en Norvège mais ne montrent pas d’augmentation. La proportion des fractures trochantériennes semble, elle aussi, stable.
Introduction
The incidence of hip fracture differs between and within continents [1–5], between rural and urban areas [6–8], between races within one country [9] and also between regions within countries [10, 11]. It has even been shown that there are significant differences in the incidence within a single city [12].
The highest rates in the world were found in studies from Oslo, Norway [12]. In two retrospective studies, Finsen et al. [8, 13] determined that the incidence of hip fractures in central Norway reached a plateau in 1997–1998. In their studies they also found a dramatic and unexplained increase in the proportion of trochanteric fractures from 32% in 1972–1984 to 68% in 1997–1998. We have conducted a prospective study to determine the age-specific incidence of hip fractures in a predominately urban area in southeastern Norway and to assess the proportion of trochanteric fractures.
Patients and methods
From 1 September 1998 to 31 August 2003 all hip fractures treated at the Østfold Hospital Fredrikstad were included in a prospective hip-fracture audit. For this study, we included fractures sustained by individuals 40 years or older. We obtained data pertaining to the characteristics of the population from the Norwegian Central Bureau of Statistics web pages [14].
The three large municipalities consisted of a predominantly urban population, whereas the three smaller municipalities consisted of mainly rural populations. We have calculated the incidence rates per 100,000 persons for each gender and age bracket including 95% confidence intervals. When calculating the proportion of trochanteric fractures we elected to include all subtrochanteric fractures (67) among the trochanteric fractures and because in our experience, the lateral cervical fractures most often are extracapsular, we have included those (19) among the trochanteric fractures as well.
Statistics
When determining the confidence intervals, the standard error (SE) of a proportion was calculated [15]. Data were then multiplied by 100,000 to be presented as incidence per 100,000.
Results
A total of 1,730 fractures occurred during the study period, 460 in men and 1,270 in women. Of these, 676 were trochanteric and 1,054 were intracapsular. The number of fractures in each age bracket and incidence per 100,000 is shown in Table 1. There were significant differences as evidenced by non-overlapping confidence intervals between several age groups within each gender. For men there was an increasing incidence for each 5-year age bracket between 60–64 and 85–89 except for the 65–69 age bracket. For women there was a significant increase between each age group from 65–69 to 85–89. We did not find any increased incidence in the group of patients 90 years and older compared to the preceding age group for men or for women. This exponential increase in incidence is illustrated in Fig. 1. There were also significant differences between genders in most age brackets. The total incidences for men and women age 50 and over as well as for 50–74 years and 75 and older are presented in Tables 2 and 3.
Table 1.
Number of fractures and population at risk with incidence rate and 95% confidence interval for each gender and age group (T trochanteric, I intracapsular)
| Confidence interval | |||||||
|---|---|---|---|---|---|---|---|
| Men | At risk | T | I | Fractures | Incidence rate | Lower limit | Upper limit |
| 40–44 | 28,140 | 1 | 3 | 4 | 14 | 0 | 28 |
| 45–49 | 27,573 | 3 | 1 | 4 | 15 | 0 | 29 |
| 50–54 | 28,909 | 3 | 9 | 12 | 42 | 18 | 65 |
| 55–59** | 22,953 | 2 | 5 | 7 | 30 | 8 | 53 |
| 60–64 | 17,541 | 8 | 14 | 22 | 125* | 73 | 178 |
| 65–69** | 15,912 | 11 | 14 | 25 | 157 | 96 | 219 |
| 70–74** | 15,179 | 28 | 31 | 59 | 389* | 290 | 488 |
| 75–79** | 12,774 | 40 | 61 | 101 | 791* | 637 | 944 |
| 80–84** | 7,440 | 37 | 68 | 105 | 1,411* | 1,143 | 1,679 |
| 85–89** | 3,281 | 41 | 46 | 87 | 2,652* | 2,102 | 3,201 |
| 90+ | 1,044 | 15 | 19 | 34 | 3,257 | 2,180 | 4,333 |
| Women | |||||||
| 40–44 | 28,053 | 0 | 0 | 0 | 0 | 0 | 0 |
| 45–49 | 27,064 | 0 | 7 | 7 | 26 | 7 | 45 |
| 50–54 | 28,347 | 2 | 9 | 11 | 39 | 16 | 62 |
| 55–59 | 23,246 | 2 | 21 | 23 | 99 | 59 | 139 |
| 60–64 | 19,033 | 8 | 18 | 26 | 137 | 84 | 189 |
| 65–69 | 17,692 | 21 | 36 | 57 | 322* | 239 | 406 |
| 70–74 | 18,542 | 48 | 79 | 127 | 685* | 566 | 804 |
| 75–79 | 17,912 | 91 | 155 | 246 | 1,373* | 1,203 | 1,544 |
| 80–84 | 14,161 | 133 | 202 | 335 | 2,366* | 2,115 | 2,616 |
| 85–89 | 8,205 | 118 | 183 | 301 | 3,668* | 3,262 | 4,075 |
| 90+ | 3,457 | 64 | 73 | 137 | 3,963 | 3,313 | 4,613 |
*Significant difference compared to preceding age bracket as evidenced by non-overlapping confidence intervals
**Significant difference between genders as evidenced by non-overlapping confidence intervals
Fig. 1.
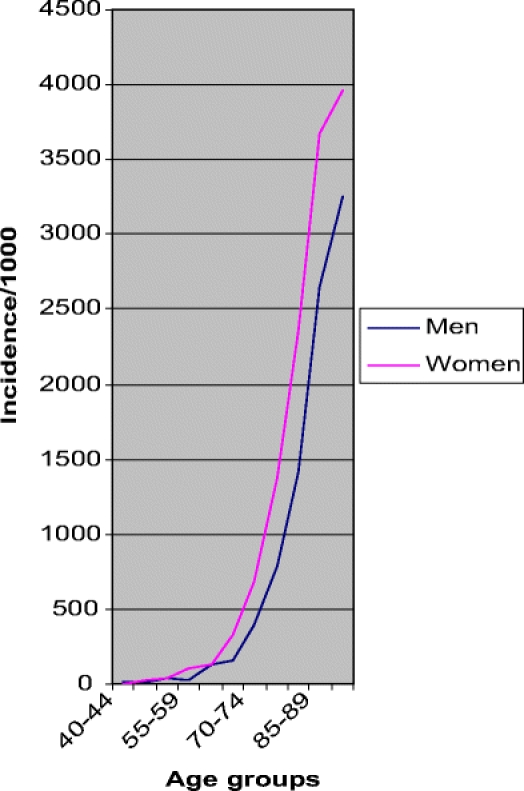
Incidence rates for men and women depicted as line diagrams indicate rising rates with advancing age as well as the difference between genders
Table 2.
Incidence of hip fractures in women from the present study, Finsen et al. [13], Falch et al. [11], and Nymark et al. [16]. Data were adjusted to similar age groups
| Age | Person-years | Number of fractures | Incidence | Confidence interval | ||
|---|---|---|---|---|---|---|
| Southeastern Norway 1998–2003a (present study) | 50–74 | 106,860 | 244 | 228 | 200 | 257 |
| 75+ | 43,735 | 1,019 | 2,330 | 2,189 | 2,471 | |
| Total | 150,595 | 1,263 | 839 | 793 | 885 | |
| Central Norway 1997–1998b [13] | 50–74 | 40,697 | 193 | 236 | 189 | 282 |
| 75+ | 16,339 | 746 | 2,283 | 2,054 | 2,512 | |
| Total | 57,036 | 939 | 823 | 749 | 897 | |
| Western Norway 1988–1989b [11] | 50–74 | 12,184 | 37 | 308 | 209 | 406 |
| 75+ | 5,386 | 93 | 1,736 | 1,387 | 2,085 | |
| Total | 17,570 | 131 | 746 | 618 | 873 | |
| Oslo 1988–1989b [11] | 50–74 | 62,714 | 503 | 401 | 352 | 450 |
| 75+ | 29,140 | 839 | 2,879 | 2,687 | 3,071 | |
| Total | 91,854 | 1,091 | 1,187 | 1,117 | 1,257 | |
| Funen, Denmark 1996–2003c [16] | 50–69 | 109,550 | 147 | 134 | 113 | 156 |
| 70+ | 65,323 | 1,180 | 1,806 | 1,704 | 1,909 | |
| Total | 174,873 | 1,327 | 759 | 718 | 800 | |
aPopulation at risk for the entire 5-year study period
bPopulation shown for a single year, number of fractures for the 2-year study period
cSimilar age brackets not possible due to the method of presenting original data. Includes first and second fracture 1996–1999 and 2000–2003
Table 3.
Incidence of hip fractures in men from the present study, Finsen et al. [13], Falch et al. [11], and Nymark et al. [16]. Data were adjusted to similar age groups
| Age | Person-years | Number of fractures | Incidence | Confidence interval | ||
|---|---|---|---|---|---|---|
| Southeastern Norway 1998–2003a (present study) | 50–74 | 100,494 | 125 | 124 | 103 | 146 |
| 75+ | 24,539 | 327 | 1,333 | 1,189 | 1476 | |
| Total | 125,033 | 452 | 362 | 328 | 395 | |
| Central Norway 1997–1998b [13] | 50–74 | 39,076 | 93 | 119 | 85 | 153 |
| 75+ | 9,889 | 280 | 1,416 | 1,183 | 1,649 | |
| Total | 48,965 | 373 | 381 | 326 | 435 | |
| Western Norway 1988–1989b [11] | 50–74 | 11,990 | 36 | 300 | 202 | 398 |
| 75+ | 3,959 | 81 | 2,046 | 1,605 | 2,487 | |
| Total | 15,949 | 117 | 734 | 601 | 866 | |
| Oslo 1988–1989b [11] | 50–74 | 50,136 | 316 | 630 | 561 | 700 |
| 75+ | 12,096 | 349 | 2,885 | 2,587 | 3,184 | |
| Total | 62,232 | 665 | 1,069 | 988 | 1,149 | |
| Funen, Denmark 1996–2003c [16] | 50–69 | 50,315 | 44 | 80 | 63 | 96 |
| 70+ | 21,544 | 180 | 888 | 799 | 976 | |
| Total | 151,354 | 471 | 311 | 283 | 339 | |
aPopulation at risk for the entire 5-year study period
bPopulation shown for a single year, number of fractures for the 2-year study period
cSimilar age brackets not possible due to the method of presenting original data. Includes first and second fracture 1996–1999 and 2000–2003
The proportion of trochanteric fractures was 41% for men and 38% for women. There was no significant difference in the proportion of trochanteric fractures between age groups or between genders. The proportion of trochanteric fractures was 75% for men between 45 and 49 years, but the number of fractures was very small. In the other age groups the proportion reached a maximum at 47% and never exceeded 50%.
Discussion
We have compared the results of this prospective study to the results of previous Norwegian investigations as well as a recent study from Denmark [16].
As shown in Tables 2 and 3, the overall rates found in Oslo in 1988–1989 [11] were significantly higher than the rates in our study as well as in the one from central Norway [13].
The very high rates from Oslo were not reproduced by later studies from Norway. In part this might be explained by the 10-year interval between the studies. An assumed downturn in hip-fracture incidence in the late 20th century might not include the rates from Oslo. Also the rates from Oslo stem from a city population whereas the other Norwegian populations are more mixed. The very low rates from western Norway might be due to this population being largely rural, but the high rates for men in western Norway are hard to explain.
We have not been able to identify any trend in the incidence of hip fracture during the study period. This might be due to the relatively small study population that might not reveal trends that transcend the natural fluctuations. Also we elected to include both first and second fractures for each patient. In a short study period like ours, this will lead to some accumulation of fractures toward the end of the study period, which could conceal a downward trend.
The latest study from Denmark, which showed decreasing rates, included only first fractures, and the rates were significantly lower than the rates from our study [16].
In this study, the proportion of trochanteric fractures was 39%, which is lower than in some studies [17, 18, 13], but comparable to others [11]. Part of the discrepancy between studies might be explained by methodological variations as well as by problems in classification of fractures. But the discrepancy between the 68% proportion in the study from central Norway and our study is hard to explain. It has been suggested that trochanteric fractures are more closely related to osteoporosis and advancing age [19]. In our study we even included subtrochanteric fractures as well as basocervical fractures among the trochanteric fractures in order not to underestimate the proportion of trochanteric fractures, whereas Finsen et al. did the opposite. The proportion of trochanteric fractures has been seen to be rising [20, 21], but this was not confirmed by our study.
Incidence rates from five different areas spanning the time from 1988 to 2003 vary. However, as Norway is a small country with only five million inhabitants, the confidence intervals are large. Thus it is concluded that the incidence of hip fracture in Norway seems to have been stable geographically and over time during the past 15 years.
Acknowledgements
This work was supported by grants from Stiftelsen Sofies Minde, The Norwegian Medical Association, The Orthopaedic Association and Gjensidige Nor.
Reference
- 1.Chie WC, Yang RS, Liu JP, Tsai KS (2004) High incidence rate of hip fracture in Taiwan: estimated from a nationwide health insurance database. Osteoporos Int 15(12):998–1002 [DOI] [PubMed]
- 2.Boufous S, Finch CF, Lord SR (2004) Incidence of hip fracture in New South Wales: are our efforts having an effect? Med J Aust 180(12):623–626 [DOI] [PubMed]
- 3.Castro da Rocha FA, Ribeiro AR (2003) Low incidence of hip fractures in an equatorial area. Osteoporos Int 14(6):496–499 [DOI] [PubMed]
- 4.Lee CM, Sidhu JS, Pan KL (1993) Hip fracture incidence in Malaysia 1981–1989. Acta Orthop Scand 64(2):178–180 [DOI] [PubMed]
- 5.Elffors I, Allander E, Kanis JA, Gullberg B, Johnell O, Dequeker J, Dilsen G, Gennari C, Lopes Vaz AA, Lyritis G (1994) The variable incidence of hip fracture in southern Europe: the MEDOS Study. Osteoporos Int 4(5):253–263 [DOI] [PubMed]
- 6.Sanders KM, Nicholson GC, Ugoni AM, Seeman E, Pasco JA, Kotowicz MA (2002) Fracture rates lower in rural than urban communities: the Geelong Osteoporosis Study. J Epidemiol Community Health 56(6):466–470 [DOI] [PMC free article] [PubMed]
- 7.Chevalley T, Herrmann FR, Delmi M, Stern R, Hoffmeyer P, Rapin CH, Rizzoli R (2002) Evaluation of the age-adjusted incidence of hip fractures between urban and rural areas: the difference is not related to the prevalence of institutions for the elderly. Osteoporos Int 13(2):113–118 [DOI] [PubMed]
- 8.Finsen V, Benum P (1987) Changing incidence of hip fractures in rural and urban areas of central Norway. Clin Orthop Relat Res 218:104–110 [PubMed]
- 9.Bauer R (1988) Ethnic differences in hip fracture: a reduced incidence in Mexican Americans. Am J Epidemiology 127(1):145–149 [DOI] [PubMed]
- 10.Norton R, Yee T, Rodgers A, Gray H, MacMahon S (1997) Regional variation in the incidence of hip fracture in New Zealand. N Z Med J 110(1039):78–80 [PubMed]
- 11.Falch JA, Kaastad TS, Bohler G, Espeland J, Sundsvold OJ (1993) Secular increase and geographical differences in hip fracture incidence in Norway. Bone 14:643–645 [DOI] [PubMed]
- 12.Kaastad TS, Meyer HE, Falch JA (1998) Incidence of hip fracture in Oslo, Norway: Differences within the city. Bone 22:175–178 [DOI] [PubMed]
- 13.Finsen V, Johnsen LG, Trano G, Hansen B, Sneve KS (2004) Hip fracture incidence in Central Norway: a followup study. Clin Orthop Relat Res 419:173–178 [DOI] [PubMed]
- 14.Statistics Norway (2006) Population studies. Interactive Web report. http://statbank.ssb.no/statistikkbanken/
- 15.Altman DG (1991) Practical statistics for medical research. Chapman and Hall, London
- 16.Nymark T, Lauritsen JM, Ovesen O, Rock ND, Jeune B (2006) Decreasing incidence of hip fracture in the Funen County, Denmark. Acta Ortop 77:109–113 [DOI] [PubMed]
- 17.Lawton JO, Baker MR, Dickson RA (1983) Femoral neck fractures-two populations. Lancet 2(8341):70–72 [DOI] [PubMed]
- 18.Michelson JD, Myers A, Jinnah R, Cox Q, Van Natta M (1995) Epidemiology of hip fractures among the elderly. Risk factors for fracture type. Clin Orthop Relat Res 311:129–135 [PubMed]
- 19.Mautalen CA, Vega EM, Einhorn TA (1996) Are the etiologies of cervical and trochanteric hip fractures different? Bone 18(3 Suppl):133S–137S [DOI] [PubMed]
- 20.Rogmark C, Sernbo I, Johnell O, Nilsson JA (1999) Incidence of hip fractures in Malmo, Sweden, 1992–1995. A trend-break. Acta Orthop Scand 70:19–22 [DOI] [PubMed]
- 21.Nungu S, Olerud C, Rehnberg L (1993) The incidence of hip fracture in Uppsala County. Change of time trend in women. Acta Orthop Scand 64(1):75–78 [DOI] [PubMed]