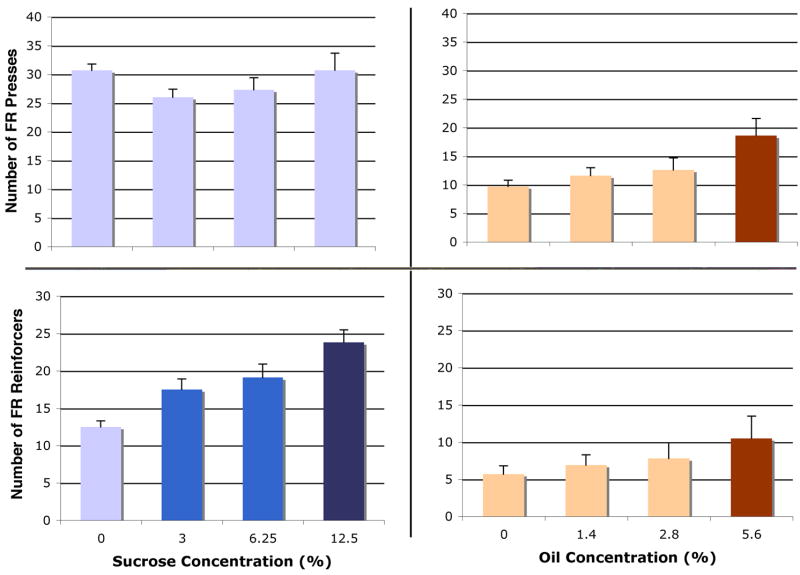
Figure 1.
Concentration-dependent increase in FR consumption of sucrose or oil. Left panel: Top, FR active presses for sucrose. Bottom, sucrose reinforcers received. Right panel: Top, FR active presses for oil. Bottom, oil reinforcers received. Within each graph, each bar color indicates significant difference (p < 0.05) from bars of other colors. Bars represent means ± SEM; repeated-measures, n = 15 in sucrose condition, n = 23 in oil condition.

