Abstract
We have developed a general electron paramagnetic resonance (EPR) method to measure electrostatic potential at spin labels on proteins to millivolt accuracy. Electrostatic potential is fundamental to energy-transducing proteins like myosin, because molecular energy storage and retrieval is primarily electrostatic. Quantitative analysis of protein electrostatics demands a site-specific spectroscopic method sensitive to millivolt changes. Previous electrostatic potential studies on macromolecules fell short in sensitivity, accuracy and/or specificity. Our approach uses fast-relaxing charged and neutral paramagnetic relaxation agents (PRAs) to increase nitroxide spin label relaxation rate solely through collisional spin exchange. These PRAs were calibrated in experiments on small nitroxides of known structure and charge to account for differences in their relaxation efficiency. Nitroxide longitudinal (R1) and transverse (R2) relaxation rates were separated by applying lineshape analysis to progressive saturation spectra. The ratio of measured R1 increases for each pair of charged and neutral PRAs measures the shift in local PRA concentration due to electrostatic potential. Voltage at the spin label is then calculated using the Boltzmann equation. Measured voltages for two small charged nitroxides agree with Debye-Hückel calculations. Voltage for spin-labeled myosin fragment S1 also agrees with calculation based on the pK shift of the reacted cysteine.
Keywords: EPR, accessibility, electrostatics, paramagnetic relaxation, transition metal complex
1. Introduction
1.1. Importance of protein electrostatics
Electrostatics is fundamental to protein structure, dynamics, interactions and function (1, 2). In particular, proteins that mediate energy or signal transduction must transmit electrostatic energy from substrate hydrolysis (3) or ligand binding (4, 5) across their structures. In myosin, for example, the release of ATP hydrolysis energy results in conformational changes over distances of 5 nm or more (6), which involve torsional and translational movements of specific alpha helices of the myosin head (7). These inter-orbital forces are electrostatic(8, 9) and generate highly localized potentials. To date, protein spectroscopy has focused on describing changes in structure and dynamics generated primarily by these electrostatic forces. In the present study, we develop a method to measure these electrostatic forces quantitatively, as a step toward explaining the observed structural changes.
1.2. Dynamic range and sensitivity needed
What is the magnitude of electrostatic potential change that must be measured? One estimate comes from sidechain ionization, which is typically within one pK unit (10-12), corresponding to +/−59 mV for a single charge ionization at 25°C, based on the Tanford-Roxby equation (13). The SH1 cysteine of myosin S1 has an unusually large pK shift of 2.27, corresponding to +135mV (14, 15), which we use later. Another estimate comes from the energetics of ATP hydrolysis, where 7.3 kcal/mol in energy is liberated with a loss of 1 electron charge, corresponding to a 300 mV potential change. Assuming 50% efficiency, this suggests that a fully general method should measure potentials over a range of +/− 150 mV. In most cases probes will be remote from such centers, so they must discern small changes with millivolt precision.
1.3. Calculating electrostatic potential from high-resolution structure
In principle, structures obtained from x-ray crystallography or NMR can be used to calculate the electrostatic potential at any point within the molecule, using the Poisson-Boltzmann equation. However, the uncertainty of these calculations has been estimated to be about 40 mV in proteins (2, 16, 17). Furthermore, crystal-trapped structures can differ significantly from solution structures, which are likely to be less ordered and more dynamic, especially in energy-transducing proteins (18, 19). Thus, when available, an ensemble of NMR solution structures can give a more accurate computational voltage than that derived from an X-ray crystal structure (20). Some of the most critical conformational states are transient or flexible and are thus not easily trapped in crystals (21, 22)(21, 22), and most supramolecular assemblies (e.g., actomyosin) have not been crystallized and are too large for high-resolution NMR analysis. There is clearly a need for a general method that measures electrostatic potential accurately in solution under functional conditions. Also, electrostatic modeling programs such as DelPhi and APBS are geared toward the calculation of relatively large potential distributions produced by surface charges, not the highly localized potential distributions that report energy transmission through proteins. Collisional spin exchange offers the prospect of measuring these potentials directly, going beyond these current limitations.
1.4. Site-directed probe techniques
Site-directed mutagenesis, usually producing single-cysteine mutants, is the most general method of obtaining site-specific structural information in solution. Electrostatic potentials have been estimated using cysteine reactivity to charged reagents (4, 23), but this has low time resolution and these reactions can involve many influences. Cysteine pK shift on a protein surface can be measured potentiometrically (14), but ionization can also depend on hydrogen bonding and hydrophobic interactions in addition to electrostatic potential (24). Perhaps more importantly, it requires varying pH, a variable often important to biochemical state. Hydrogen exchange has been used to estimate the electrostatic potential near metal binding sites in proteins, but is limited to proteins with metal centers with ∼20 mV electrostatic potentials and above (10).
A more promising approach involves spectroscopic measurements of the accessibility of charged relaxation agents to a site-directed probe. Electrostatic forces perturb local agent concentration, so changes in probe relaxation rate are related to the local voltage through the Boltzmann equation. For example, collisional fluorescence quenching (25-27) and diffusion-enhanced resonance energy transfer (27-34), using charged relaxation agents in solution, provide direct spectroscopic measurements of electrostatic potential at specific probe sites. In most cases, the large optical probes required limit spatial resolution and can disrupt protein function, and the ns lifetimes of most fluorescent probes require the addition of high concentrations of relaxation agent (> 100 mm), which can disrupt protein structure and function. NMR has been used to make electrostatic measurements on proteins, using charged nitroxides as relaxation agents (35, 36), but these measurements are dominated by long-distance dipolar relaxation and an unknown amount of collisional relaxation, limiting accuracy. NMR signals are also 700 times smaller than those of EPR, making NMR less sensitive, especially in measuring small voltages (35).
EPR accessibility experiments that emphasize electrostatics have been performed previously (16, 17, 37-42), but studies that actually measured electrostatic potentials at nitroxide spin labels, utilizing paramagnetic relaxation agents (PRAs) form a smaller set (16, 17, 40, 42, 43). Shin and Hubbell made pioneering measurements using electron-electron double resonance (ELDOR) with charged and neutral 15N nitroxides as PRAs against 14N nitroxide labels (16, 17). They estimated an electrostatic potential at the surface of a charged lipid membrane by fitting measured values of R1 from ELDOR as ionic strength was varied, and they found agreement with a previously estimated value. However, neither the 15N nitroxide PRAs nor the instrumentation for ELDOR measurements is commonly available, and ELDOR is an indirect measure of accessibility because it relies on perturbing the cross-coupling between 14N nuclear states with slowly relaxing PRAs (44, 45) (42) . Also, when they measured the more localized electrostatic potential at a spin label intercalated in DNA, it was 14% of the value expected based on modeling. This underestimate may be due in part to the slow (μs) R1 relaxation time of nitroxide PRAs, resulting in measurement of a spatial average of the potential distribution.
The electrostatic potentials at nitroxide spin labels on phospholipase A2, complexed over a charged lipid membrane, has been measured from increases in R2 with the addition of chromium oxalate (CrOx aka Cr(C2O4)33-) as a PRA (40, 43). These measurements are important precursors to ours, but absolute accuracy remains unknown primarily because they remain based on measurements over a large complex system (charged membrane) having a large uniform electrostatic potential distribution. Calibrations are needed on small molecules carrying single charges to ensure that relaxation agents do indeed operate collisionally to measure localized potential distributions. There is also a need to account for differences in steric accessibility between labeling sites.
In the present study, we use PRA's with ps relaxation times to ensure that the relaxation enhancement is due entirely to collisional spin exchange (46), and we use small nitroxide spin labels of known structure and charge to calibrate these for accurate voltage measurements. Saturation recovery EPR, using pulsed excitation and detection, is a viable alternative to conventional EPR for accessibility measurements (47, 48), but the present study uses the more widely available conventional EPR technology. We perform these EPR experiments on a set of PRAs which encompass all charge states (−, 0, +). The PRA spin-exchange rate is proportional to the collision rate, and this is proportional to local concentration. We employ the Boltzmann equation to estimate electrostatic potential from the shift in charged PRA concentration relative to bulk as observed through relaxation due to spin exchange. Finally, we apply the method to spin-labeled myosin to show that it can measure small electrostatic potentials on proteins with an accuracy of a few mV.
2. Methods
2.1 Spin exchange as a bimolecular chemical reaction
Collisional spin exchange can be described through the kinetics of a bimolecular reaction:
| Eq. 1 |
Solving this equation leads to the expression for the spin exchange reaction rate:
| Eq. 2 |
PRA concentration bears the subscript “NO” to emphasize that it is sampled at the nitroxyl group. We selected PRAs with spin-lattice relaxation rates R1 (1/T1) much greater than the nitroxide resonance frequency to eliminate dipolar relaxation (46) and show that it is insignificant by calculations done in the Discussion section. So collisional spin exchange is the only mechanism that increases R1 in our measurement system as given by
| Eq. 3 |
Strong collisional spin exchange (k2 >> k−1 in Eq. 1, Eq. 2), is diffusion-controlled with ke = k1 ≈ 3.6 MHz/mM for PRAs in water at 25°C, p154 in (49). For real PRAs, ke is less than k1, due to dependence on electronic, steric, and magnetic factors (49). For example ke ≈ 0.2 k1 was measured for Fe(CN)63- in aqueous solution with a nitroxide spin label (50). We determine ke directly from changes in R1 for each PRA by measuring spin exchange rates against small nitroxides of known structure and charge (described below).
2.4 Calculating voltage from relaxation enhancement
The concentration of PRA with charge Z at r, [PRA](r), due to electrostatic potential V(r) is related to the bulk solution concentration [PRA]∞ through the Boltzmann equation (2, 16, 17, 38, 40, 42)
| Eq. 4 |
where F is the Faraday constant, R is the gas constant and T is temperature. Here we assume an electrostatic potential of mean force (51) acting on each PRA and that any short range forces act to change PRA ke values (Eq. 3). The two relevant short-range forces are Van der Waals forces underlying protein site accessibility and nitroxyl group hydration. By choosing small PRAs of the same diameter, the ratios between ke values remain constant for a spin label in a tight protein crevice. Nitroxyl group hydration has been hypothesized to explain nitroxide-nitroxide ke values that are half as large in aqueous compared to organic solutions (49). We later account for this water by defining the nitroxyl oxygen surface from which position r in Eq. 4 is set. The key concept is that while ke values may vary between aqueous experiments, the ke ratios remain the same, allowing correction factors to be defined in Eq. 6.
Relaxivity χ is calculated by combining Eq. 3 and Eq. 4 (38):
| Eq. 5 |
There is a similar equation for χ2, but our primary interest is χ1. Thus when the nitroxyl oxygen resides in a neutral electrostatic potential (V = 0), relaxivity χ is the second-order rate constant ke unique to each PRA (Eq. 3). We calibrated three PRAs of positive, negative and neutral charge (section 2.1) against charged and ionically neutral small nitroxides by measuring their relaxivities in aqueous buffer to derive calibration factors K1 for each charged PRA with respect to the neutral:
| Eq. 6 |
The + and − superscripts denote PRA charge state. The potential at a nitroxide is then calculated by combining Eq. 5 and Eq. 6 :
| Eq. 7 |
Here charge values Z+/− carry sign and RT/F = 25.68 mV at 25°C. If both charged PRAs sensed their concentration at the same r then these voltages would agree. The r values for our charged PRAs differ by several angstroms. Once the calibration is established, Eq. 7 is used to determine voltage, usually with relaxivities χ1 are replaced by changes in R1 by adding charged and neutral PRAs at the same concentration.
2.1 Selecting PRAs for an EPR voltmeter
To measure electrostatic potential through collisional spin exchange, we chose the PRAs in Figure 1. These have comparable small diameters and magnetic properties, are stable in aqueous solution, and are either commonly available or easily made. The selected PRAs have spin-lattice relaxation rates R1 > 100 GHz, (Table 4). Because these rates are substantially above the nitroxide resonance frequency, relaxation through dipolar coupling is insignificant, leaving only relaxation through collisional spin exchange. This relaxation rate is also fast compared with the intermolecular collision frequency for the small nitroxides tested here at 0.5 mM. So PRA addition does not cause cross-coupling between different nuclear spin states of the 14N nitroxide (49, 52), which would complicate analysis.
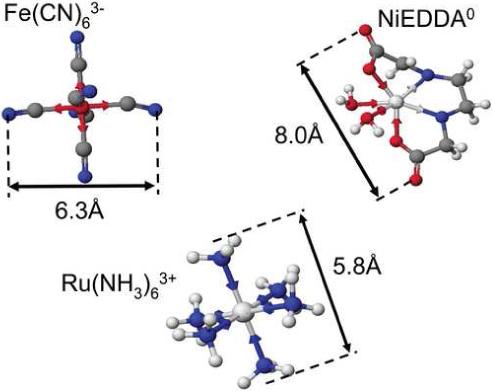
Table 4.
Aqueous PRA magnetic properties at 25°C.
| paramagnet | spin S | TPRA (ns) | μeff (μB) |
|---|---|---|---|
| Cr(C2O4)33- | 1.5 | 0.5 (a) | 3.44 (f) |
| Fe(CN)63- | 0.5 | 0.0001 (b) | 2.33 (g) |
| NiEDDA0 | 1 | 0.0043 (c) | 3.21 (h) |
| Ru(NH3)63+ | 0.5 | 0.0025 (d) | 2.15 (i) |
| O2 | 1 | 0.0075 (e) | 1.2 (j) |
| Nitroxide | 0.5 | ∼1000 | 1.73 |
TPRA is PRA spin-lattice relaxation time and μeff is PRA magnetic moment in Bohr magnetons.
(a) table 8, p.105 in (93) (b) by NMRD (94) (c) hexaqua Ni complex (59) (d) by NMR (55) (e) by NMR (95) (f) (96) (g) p.935 (61) (h) (54) (i) (97) (j) (98)
The PRAs in Figure 1 have comparable steric accessibility. The diameter of 5.8 Å shown for Ru(NH3)63+ ignores a second coordination sphere of 8 water molecules at its octahedral faces, so we use its hydrated radius, as measured by Waysbort and Navon, of 3.9 ± 0.3Å (53), for both steric accessibility and the distance r from the nitroxyl oxygen surface at which it senses concentration upon collisional spin exchange (Eq. 4). Fe(CN)63- is the smallest, with a steric radius of 3.1Å. Because of its negative shell/positive core structure, we take its distance r as zero during collisional spin exchange. NiEDDA0 is hexadentate, similar to the charged PRAs with waters completing two ligand positions (54).
PRA magnetic properties relevant to collisional spin exchange are spin quantum number S, effective magnetic moment μ, spin-lattice relaxation rate R1PRA, and unpaired spin density in orbitals that overlap during a collision (49) (Table 4). Both Ru(NH3)63+ and Fe(CN)63- have S = ½, matching that of the unpaired nitroxide spin. They have spin-lattice relaxation rates of 400 and 10,000 GHz, respectively, and unpaired spin density of ∼0.4% coupled to their outermost atoms (55-57). Even though NiEDDA0 has S = 1, we chose it as neutral because it has performed well in other accessibility studies (58) and because of its relaxation rate of 250 GHz (59).
Unlike these transition metal PRAs, nitroxide spin density resides on the nitroxyl group alone (60) and only the oxygen is sterically accessible. As a result only ∼25% of the small nitroxide surface presents spin density for spin exchange, based on simple modeling.
Finally, our voltmeter PRAs are stable during experiments (easily past 20 hours) with respect to ligand or central ion substitution as well as redox reactions (58, 61-63) in aqueous buffer at pH 7 and 25°C.
2.2 PRA calibration
Electrostatic potential measurements based on collisional spin exchange occur at atomic dimensions. If all the charge sources for the measured electrostatic potential reside within a Debye length of the nitroxyl oxygen surface then the ionic strength of the medium will not affect this potential. Calibrations made upon the highly localized electrostatic potentials of small nitroxides (Figure 2) should indeed be possible and prove the high degree of accuracy achievable with appropriate PRAs. The PRA set (Figure 1) was calibrated to determine the factors K1+ and K1− (Eq. 6) in a series of experiments with small nitroxides in solution. Several uncharged nitroxides were measured first to determine first-order calibrations, and these were then refined by matching experimental values of V (Eq. 7) for charged nitroxides TEMPO-choline (+1 charge) and carboxy-TEMPO (−1 charge) (Figure 2) with those determined from Debye-Hückel theory.
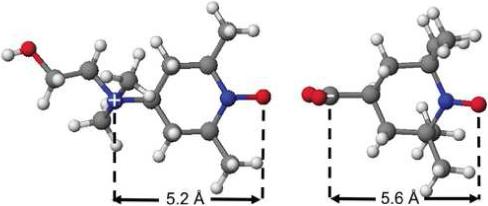
The model distances shown in Figure 2 are measured to the center of the nitroxyl oxygen. We define a nitroxyl oxygen reference surface as the patch on the nitroxide surface through which all excited spin state transfers occur. The oxygen diameter of 1.5 Å and 1.0 Å for coordinated water are added to the model distance from the test charge to reach this surface in voltage calculations.
Our nitroxide test charges are approximately ellipsoids (Figure 3A). For lower limit of the electrostatic potential, Vs, the nitroxide structure is ignored and the test charge is screened by point charge ions across the distance d + r, i.e. the distance d from test charge to nitroxyl oxygen surface (Figure 3B) plus distance r from this surface at which the charged PRA senses concentration:
| Eq. 8 |
The Debye length λD is set to 10Å here using Eq. 9 (see equation 12.1−27 p.162 of (64)), based on the 90mM ionic strength (μ) typically used in our experiments.
| Eq. 9 |
For a high limit of electrostatic potential, Vf, from each test charge finite ion sizes are assumed to calculate the “internal” electrostatic potential (Eq. 10 e.g., see p.327 in (65)), where a = d + aI and aI are the steric radii of Fe(CN)63- and Ru(NH3)63+ (Figure 3C).
| Eq. 10 |
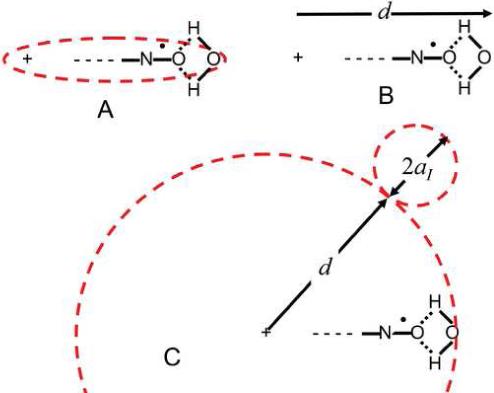
Eq. 10 should reflect voltages measured with Fe(CN)63- more closely, because the intense electric field of its negatively charged shell partially saturates the water dielectric near its point of collision. Ru(NH3)63+ has a less intense electric field and measures several angstroms away from the oxygen surface, so values calculated with Eq. 8 should be closer to these measurements. Because these charged PRAs sense concentration at different r distances, they provide information about the gradient of the electrostatic potential near the nitroxide.
2.6 Separating R1 and R2 for small nitroxides
In the simplest analysis, nitroxide R1 and R2 increase linearly with added PRA (38).
| Eq. 11 |
We use these expressions to explain why lineheight saturation analysis is inadequate for our calibrations with small nitroxides. Some recent investigators have used that χ1 = χ2 (38, 43) as assumed in original spin exchange work (49).
In the conventional EPR accessibility experiment on spin-labeled protein, lineheights Y are measured from derivative peaks of progressive saturation spectra and the resulting curve is fit to a semi-empirical equation (58, 66, 67):
| Eq. 12 |
Here P is the power incident to the resonator, C is the cavity factor defined in Eq. 13 which converts this power to microwave magnetic field in the sample and γ = 1.76 × 10⁷ s−1G−1.
| Eq. 13 |
A, P1/2 and ε are constants determined by fitting the lineheight curve. Constant ε ranges from 0.5 for completely inhomogeneous to 1.5 for completely homogeneous spectral lines (67, 68). Half saturation power P1/2 is the power P at which the denominator in Eq. 12 equals 2.
| Eq. 14 |
Since P1/2 is proportional to R1R2, it is proportional to
| Eq. 15 |
For fast-tumbling small nitroxides, R1 ≈ R2, making all terms important. This leads to a quadratic dependence of P1/2 on PRA concentration, which we observe. At the other extreme, rigidly labeled proteins make the nitroxide tumble slowly in solution, so R1<<R2, p413 in (69). Also, χ1,2[PRA] << R2 for our PRAs, added from 0 to 10 mM. In this limit Eq. 15 is
| Eq. 16 |
This differs slightly from the approximation presented in (38). Here P1/2 is proportional to R1. Thus when experiments are performed to measure voltage at spin labels on proteins the change in P1/2 is used in place of the change in R1 (which replaces χ1) in Eq. 7 with the same concentration of added charged and neutral PRA and under the assumption that ε and R20 remain constant. For very floppy spin labels on protein loops, this approximation may be poor.
The quadratic dependence of P1/2 for small nitroxides makes it impossible to determine changes in R1 (χ1) separately for the general case of a partially homogeneous (0.5 < ε < 1.5) spectrum with lineheight fitting. Also, we wish to avoid approximating changes in R1 as being proportional to changes in the square root of P1/2, based the fast tumbling limit assumption that R1 = R2, because these calibrations are fundamental measurements that demand the least number of assumptions and the highest achievable accuracy. Therefore, we performed global lineshape analysis on progressive saturation spectra to directly separate R1, R2 and inhomogeneous linewidth ΓG with PRA concentration across sets of saturation spectra for the central line (I=0) of small 14N nitroxides in this study. More et al. (70) pioneered global lineshape fitting and applied it to estimate R1 and R2 changes for a spin-labeled porphyrin with and without high-spin Fe(III) chelated. They fitted the central line as we do, but used an inhomogeneous broadening function that included proton hyperfine splitting explicitly to the first order. More recently, Nielsen et al. (43) employed similar detailed global fitting for 8 spectral aspects of the central line of tempol to compare R1 and R2 measurements from CW progessive saturation and pulsed saturation recovery. Our focus is on the measurement of accurate relaxivity changes. So we are less concerned about accurate absolute relaxation rates and employ a simpler model for inhomogeneous broadening which has proven to be acceptable.
Nitroxide inhomogeneous broadening is caused by static local magnetic fields (71, 72). In small rapidly tumbling nitroxides, this broadening is dominated by the static dipolar interactions of the 12 methyl protons (superhyperfine splitting) (73). We focus on the 14N central line (I=0) and assume that inhomogeneous lineshape can be accounted for by a single Gaussian:
| Eq. 17 |
In global lineshape fitting we convolve this inhomogeneous lineshape with the derivative Lorentzian lineshape, equation 4 p.589 in (74):
| Eq. 18 |
where ALL is the lineshape constant, ΔH as the offset from resonant field center. Thus the lineshape V(ΔH) that is fit to the data is
| Eq. 19 |
It should be clear that the experimental line acquired across a set of ten powers of progressive saturation, is fit by a single Gaussian line and a single Lorentzian line with global lineshape fitting.
Adding power P as a new dimension provides enough information to determine R1, in addition to R2, and ΓG (73, 75-81), thus achieving our primary goal of accurately determining relaxivities χ1. Small nitroxides in deoxygenated solution exhibit discrete superhyperfine splitting. The effect of this partially resolved structure on fitting is reduced by setting nitroxide concentration at 0.5 mM (45) and by setting the field modulation amplitude close to the central linewidth in order to obtain the most accurate measurements of changes in R1 and R2 as PRA concentration is changed (relaxivities).
2.7 Experimental
Standard aqueous buffer for these experiments contained 20 mM Tris-HCl, 30 mM KCl, 5 mM MgCl2, 0.1 mM EDTA, pH 7.5, 25°C.
Sigma-Aldrich stocks
tempone = 4-oxo-TEMPO, IASL = 4-(2-iodoacetimido)-TEMPO, MSL = 4-maleimido-2,2,6,6-tetramethyl-1-peridinyloxy, 4-Carboxy-TEMPO, IAPCPSL = 3-(3-(2-iodoacetimido)-propyl-carbamoyl)-proxyl, N-Acetyl-L-cysteine methyl ester, Cr(C2O4)33- from potassium chromium (III) oxalate trihydrate, Co(CN)63- from potassium hexacyanocobaltate(III), Fe(CN)63- from potassium hexacyanoferrate(III), Co(NH3)63+ from hexamine cobalt(III) chloride, Ru(NH3)63+ from hexaammine ruthenium(III) chloride.
Other stocks
perdeuterated tempone = 4-Oxo-2,2,6,6-tetramethylpiperidine-d16−1-oxyl from C/D/N Isotopes, TEMPO-choline = 4-(N,N-dimethyl-N-(2-hydroxyethyl)) ammonium-2,2,6,6-tetramethylpiperidine-1-oxyl chloride from Invitrogen, N-acetyl-L-cysteine allyl ester from Toronto Research Chemicals, PEG derivatized resin beads are Novabiochem 01−64−0100 PEGA amino resin, NiEDDA0 was prepared by Tara Kirby as described previously (67).
Labeling
ASL-cys-methyl and ASL-cys-allyl cases were formed by adding fresh cysteine stocks at 0.2M in DMF to equimolar amounts of 0.2M IASL DMF stocks, diluting these mixtures to 1mM with standard buffer shifted to pH9 with KOH for labeling at 25°C for 4 hours and then on ice for 20 hours to ensure complete labeling. At the end of labeling pH was returned to 7.5 with HCl. PEG beads have ∼2×10¹⁴ PEG chains per cross-linked resin bead with an amine on the distal end of each chain. These were swelled in MeOH to ∼3mM and labeled by adding 0.2M MSL in DMF at high concentration. The beads were then washed in MeOH and packed over glass wool in a segment of 22 gauge thin-wall teflon to form a 22mm long column over which buffer solutions with different PRA concentrations were washed for experiments achieving ∼1 label per bead as judged by spin counting. ASL-S1 was rabbit myosin S1 obtained by chymotryptic digestion and aliquots labeled with the procedure in (82), with stocks stored for use in LN2 with 20% added glycerol. Aliquots of ASL-S1 were cleaned and concentrated with 0.5ml 50kD MWCO PES Millipore Ultrafree spin concentrators on the day of the experiment to put EPR sample concentration at 0.36mM after mixing with PRA stocks.
Sample handling
To keep relaxivity contrast high between PRAs, small nitroxide concentration was set to 0.5 mM, and each sample was deoxygenated for at least 10 minutes in nitrogen gas at ∼2 atmospheres pressure (flow rate 100 L/hr) before recording spectra. This gas flow was also used to control temperature at 25.0°C during acquisition, limiting temperature rise to 0.040°C/mW of incident power, as calibrated by the EPR-detected shift in the phase transition of DMPC vesicles (83). Spectra were acquired with a Bruker E500 spectrometer using a 4122shq cavity with quartz cavity dewar insert. Aqueous sample length was limited to 13±1 mm in a ∼45 mm segment of 22 gauge thin-wall Teflon, critosealed on each end. This length limits the increase in P1/2 due to nonuniform saturation to less than 15% based on a squared cosine function model of the resonator standing wave. Sample depth is set to ±0.1 mm accuracy by impaling one end of the teflon segment on 22 gauge wire, friction fit in a custom depth gauge that clips atop the cavity dewar. This segment is aligned within the quartz dewar by an insert made from 100μL wiretrol capillary with nested P200 pipette tips on each end cut to fit and parafilmed at the top, to force all cooling gas over the segment containing the sample.
Calibration
A cavity factor C (Eq. 13) of 1.91 G/W1/2 was determined by PADS calibration with modulation amplitude set at ¼ of the peak-to-peak linewidth (84). The sensitivity of relaxivity to modulation amplitude was tested by varying CrOx concentration from 0 to 10 mM against 0.5 mM tempone, finding that relaxivities χ1 and χ2 were independent of modulation amplitude over the range from 0.1 and 0.5 G.
Spectral Acquisition
Progressive saturation spectra of each 14N nitroxide derivative central line were acquired at 10 values for P from 0.6 to 40 mW (0.076 to 0.606 Gauss H1) for several concentrations of each PRA with modulation amplitude set to approximately half the low-power linewidth. Global lineshape fitting to Eq. 19, to determine both R1 and R2 for rapidly tumbling nitroxides, was performed using a program designed in Visual Basic by Igor V. Negrashov. Simple lineheight fitting to Eq. 14, which is sufficient only for slowly tumbling nitroxides, was done in the standard way (67, 85).
3. Results
Measured small nitroxide relaxivities χ1 (and χ2), as defined in Eq. 11 for each PRA, are the central findings of this investigation (Table 2). These come from the observed linear dependence of nitroxide R1 and R2 on PRA concentration between 0 to 10mM, as illustrated in Figure 6 through Figure 10. Some nonlinearity is observed in a few R2 cases at low [PRA]. We assume that this is due to “short circuiting” of the coupling between hyperfine lines due to nitroxide-nitroxide collisions by the added PRA. At the other end of the PRA concentration range, tempone with added Fe(CN)63- and MSL-PEG with added Fe(CN)63- are the only cases where divergence from linearity occurs at ∼8 mM and above (Figure 9). In particular, the relaxation rates become extremely large for tempone with added Fe(CN)63- above 10 mM, suggesting coordination forces that are strong enough between these two smallest agents to form a complex. This may be similar to the evidence for a hydrophobic interaction between oxygen and small nitroxides found by Diakova and Bryant (86). Nevertheless, in all cases there is an extensive linear range over which relaxivities can be measured (Table 2). In all small nitroxide cases, χ2 is larger (by 10% to 70%) than χ1.
Table 2.
PRA relaxivities from nitroxide experiments. Cr = Cr(C2O4)33-, Fe = Fe(CN)63-, Ni = NiEDDA0 and Ru = Ru(NH3)63+. * indicates NiEDDA0 values included diamagnetics in solution.
| Experiment |
PRA |
χ1 [MHz/mM] |
χ2 [MHz/mM] |
|
|---|---|---|---|---|
| tempone |
Cr |
1.9±.1 |
2.94±.05 |
1.5 |
| tempone | Fe | 0.72±.02 | 0.91±.03 | 1.3 |
| Ni | 0.67±.02 | 0.95±.01 | 1.4 | |
| |
Ru |
0.92±.02 |
1.28±.02 |
1.4 |
| IASL | Fe | 1.62±.02 | 2.06±.03 | 1.3 |
| Ni | 0.61±.01 | 0.77±.01 | 1.3 | |
| |
Ru |
0.81±.02 |
1.01±.05 |
1.2 |
| IAPCPSL | Cr | 1.36±.06 | 2.30±.04 | 1.7 |
| Fe | 0.71±.01 | 0.86±.02 | 1.2 | |
| * | Ni | 0.68±.01 | 0.89±.02 | 1.3 |
| |
Ru |
1.14±.03 |
1.42±.05 |
1.2 |
| ASL-cys-allyl | Fe | 1.01±.07 | 1.58±.03 | 1.6 |
| Ni | 0.58±.01 | 0.93±.01 | 1.6 | |
| |
Ru |
0.91±.01 |
1.36±.01 |
1.5 |
| ASL-cys-methyl | Fe | 1.04±.01 | 1.60±.03 | 1.5 |
| Ni | 0.61±.01 | 0.91±.01 | 1.5 | |
| |
Ru |
0.90±.01 |
1.35±.02 |
1.5 |
| deuterated tempone | Cr | 1.76±.02 | 2.84±.01 | 1.6 |
| Fe | 1.17±.04 | 1.34±.03 | 1.1 | |
| Ni | 0.65±.01 | 0.90±.01 | 1.4 | |
| |
Ru |
0.91±.04 |
1.17±.02 |
1.3 |
| TEMPO choline + charge | Fe | 4.7±.1 | 6.5±.1 | 1.4 |
| Ni | 0.62±.01 | 1.02±.01 | 1.6 | |
| |
Ru |
0.54±.01 |
1.06±.01 |
2.0 |
| carboxy TEMPO - charge | Fe | 0.180±.005 | 0.22±.01 | 1.2 |
| Ni | 0.60±.02 | 0.94±.02 | 1.6 | |
| |
Ru |
1.56±.06 |
2.17±.02 |
1.4 |
| MSL-PEG bead column | Fe | 1.4±.2 | 0.45±.02 | 0.32 |
| Ni | 0.58±.01 | 0.42±.03 | 0.72 | |
| |
Ru |
0.528±.005 |
0.54±.01 |
1.0 |
| ASL-S1 Myosin S1 labeled at Cys707 | Cr | 0.040±.002 | ||
| Fe | 0.069±.001 | |||
| * | Ni | 0.044±.001 | ||
| Ru | 0.052±.004 |
Measured χ1 for NiEDDA0 is essentially constant across the small nitroxide experiments, supporting the assumption that it is neutral. Tempone and IAPCPSL values are the furthest from the rest, being about 10% higher. IAPCPSL is the only proxyl small nitroxide tested. A few Cr(C2O4)33- (CrOx) experiments are reported (Table 2) because it is often used in EPR accessibility studies. CrOx small nitroxide χ values are indeed 2 to 3 times larger than corresponding values of Fe(CN)63- (87). We avoided CrOx because of its slow relaxation rate (Table 4) and because with hydration, its diameter would be a few angstroms larger than our other PRAs. The abnormally low ASL-S1 χ1 results for CrOx confirm its larger size.
3.1 Correction factors and voltages
To find the most neutral nitroxide case the ratios of charged-to-neutral PRA relaxivity in Table 3 are used in expression |ln(χ1-/χ1+)| to find a minimum. The minimum occurs because charged PRA concentrations shift in opposite senses when a voltage is present. The IASL-labeled cysteine cases (ASL-cys-allyl/methyl) come closest to having the nitroxyl oxygen at neutral potential, providing initial K factors (Eq. 6) of 1.70 for Fe(CN)63- and 1.50 for Ru(NH3)63+. Applying these to TEMPO-choline and carboxy-TEMPO (Figure 2), Fe(CN)63- measured voltages are +12.3mV and −14.8mV, respectively, while Ru(NH3)63+ voltages are +4.7mV and −4.7mv. The Fe(CN)63- values match finite ion model (Eq. 10) voltages in Table 1 within 3mV. By adding an offset of +1.9mV, both are just 6% lower than calculated. Similarly, the Ru(NH3)63+ voltages agree with the point charge model (Eq. 8) shown in Table 1 to 0.2mV. We refine the K+ factor to add +0.2 mV offset. The refined K factors are then 1.35 for Fe(CN)63- and 1.54 for Ru(NH3)63+. These are used to determine measured voltages in the last column of Table 3 and future measurements using Eq. 7.
Table 3.
Charged-to-neutral PRA (NiEDDA0) R1 relaxivity ratios and corresponding voltages indexed by charged PRAs indexed as in Table 2. Voltages distorted by short ranges forces, as specified in the text, are given in parentheses.
| Experiment |
± PRA |
|
|
V [mV] |
|---|---|---|---|---|
| tempone |
Cr |
2.85 |
|
+1.5 |
| tempone | Fe | 1.08 | 0.24 | (−1.9) |
| |
Ru |
1.37 |
|
+1.0 |
| IASL | Fe | 2.58 | 0.63 | +5.5 |
| |
Ru |
1.37 |
|
+1.0 |
| IAPCPSL | Cr | 2.11 | −1.0 | |
| Fe | 1.04 | 0.47 | −2.2 | |
| |
Ru |
1.67 |
|
−0.7 |
| ASL-cys-allyl | Fe | 1.70 | 0.09 | +2.0 |
| |
Ru |
1.55 |
|
+0 |
| ASL-cys-methyl | Fe | 1.70 | 0.15 | +2.0 |
| |
Ru |
1.46 |
|
+0.5 |
| deuterated tempone | Cr | 2.70 | +1.1 | |
| Fe | 1.79 | 0.24 | +2.4 | |
| |
Ru |
1.41 |
|
+0.7 |
| TEMPO choline (+1) | Fe | 7.12 | 2.1 | +14.2 |
| |
Ru |
0.87 |
|
+4.9 |
| carboxy TEMPO (−1) | Fe | 0.30 | 2.1 | −12.9 |
| |
Ru |
2.6 |
|
−4.5 |
| MSL-PEG column | Fe | 2.4 | 0.38 | +4.9 |
| |
Ru |
0.91 |
|
+4.5 |
| ASL-S1 | Cr | 1.1 | (−6.6) | |
| Fe | 2.0 | 0.36 | 3.4 | |
| Ru | 1.4 | 0.8 |
Table 1.
Model voltages in [mV] at the nitroxyl oxygen surface for the two charged PRAs.
Because measured results, determined from Eq. 7, match those from simple Debye-Hückel theory so closely, they support the model that charged PRAs are completely dissociated when they collide at the nitroxyl oxygen reference surface. In most cases Fe(CN)63- voltages are significantly larger than Ru(NH3)63+ voltages. This fits our simple model that it measures concentration at r = 0 distance from the oxygen surface while Ru(NH3)63+ measures concentration at r = 4 Å. Using IAPCPSL and deuterated tempone results, we estimate the correction factor for CrOx, KCrOx = 2.4 and use this to present voltages measured with this PRA in Table 3.
Even small nitroxides selected to be ionically neutral display small voltages at their nitroxyl oxygen, probably due to dipoles from coordinated water. Most notable is IASL at 5 mV, an ionically neutral six membered ring nitroxide which should present the positive pole of an electrostatic dipole at its nitroxyl oxygen in response to strongly electronegative Iodine. IAPCPSL is the lone proxyl showing slightly negative voltage whereas the remaining neutrals show slightly positive voltages. The MSL-PEG column case has one MSL nitroxide label reacted out of a sea of 2×10¹⁴ amines that reside at the distal ends of PEG chains attached to each resin bead, which explains why Ru(NH3)63+ and Fe(CN)63- both measure a +5 mV potential.
Considering all the calculated voltages an overall accuracy of 1 mV is evident for our voltmeter PRAs against small nitroxides.
3.2 Comparing ASL-S1 voltages from lineshape and lineheight fitting
Rabbit myosin S1 labeled at Cys707 (SH1) with no nucleotide present (ASL-S1) has turned out to be a good choice to validate our PRAs for three reasons. First, the label resides in a tight crevice such that its spectrum indicates strong immobilization. So the site tests our PRAs at the low-accessibility limit (88) and provides an extreme test of global lineshape fitting, as Figure 12 and Table 2 indicate. The Fe(CN)63- R1 and R2 results from lineshape fitting are distinct and as expected since it is the smallest agent, while those of the remaining PRAs show more scatter in Figure 12. Second, the pK of the SH1 thiol is known to be 6.28 (15) which explains the high reactivity that favors its specific labeling. Third, this region of S1 is relatively thin so there is water above and below the site, which allows the potential causing the thiol pK shift to be estimated at the nitroxyl oxygen surface using simple models (Eq. 10).
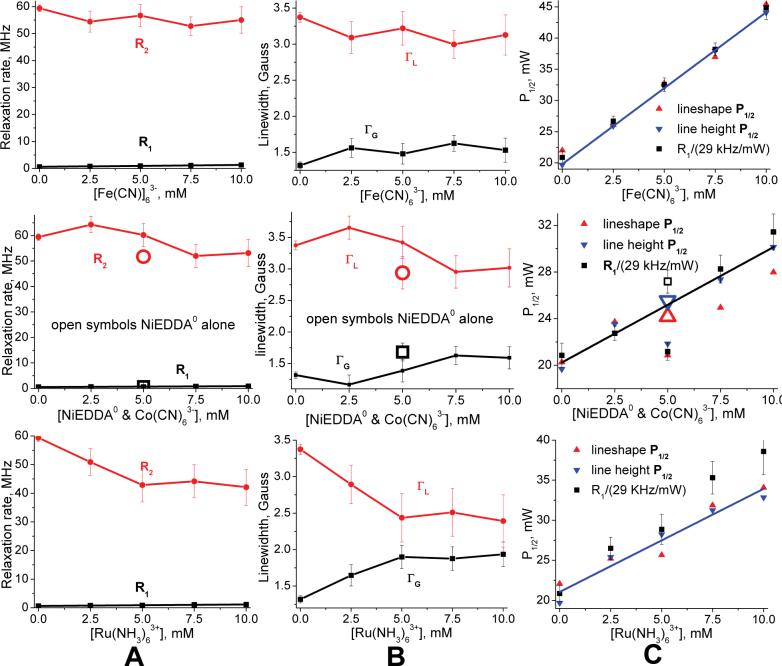
Voltages for ASL-S1 in the apo state at the spin label are +3 and +1mV for Fe(CN)63- and Ru(NH3)63+ from lineshape fitting (Table 3). These voltages are +4 and +3mV, respectively, using more accurate lineheight fitting based on PRA concentrations set to 5mM.
Taking the in situ pK of a cysteine thiol in an electrostatically neutral region to be 8.55 +/− 0.03 (14), the voltage responsible for the pK shift to 6.28 at SH1 is Vs = 135 mV, based on the Tanford-Roxby equation (89) at 25°C:
| Eq. 20 |
This 135mV potential results from essentially one positive charge. Molecular modeling indicates that the distance from the cysteine thiol to the nitroxyl oxygen for a spin label reacted at Cys707 is 9.0 Å. Using Eq. 10 we calculate that the potential measured by Fe(CN)63- should be +6 mV (observed +4 mV) and by Ru(NH3)63+ +4 mV (observed +3 mV). So even in this extreme case measurements are accurate to within a few mV.
3.3 Measured R10 and R20
All small nitroxide R10 relaxation rates are around 1 MHz as expected. In this fast-tumbling limit R20/R10 ranges from 1.4 to 3.3 in our global lineshape fitting results. As expected, this ratio increases to 100 for the rigid spectrum of IASL reacted at cys707 on myosin S1 in the apo state (ASL-S1). The mobile spectrum of MSL tethered to a bead with a polyethylene glycol segment (MSL-PEG) has a ratio of 3 and provides a lower limit for the mobile spectra from labels on protein loops. This low ratio suggests that lineshape may be more appropriate than lineheight fitting to determine voltages from mobile spectra with conventional EPR.
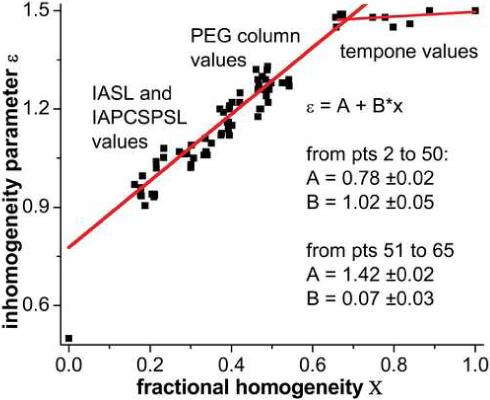
3.4 Scatter plot between inhomogeneity parameter and fractional homogeneity
Haas et al estimated the effects of inhomogeneous broadening on lineheight fitting with simulated spectra (90). Our goal is simpler here in that we wish to show consistency between lineshape and lineheight results by discerning the functional relationship of inhomogeneous and homogeneous aspects of small nitroxide spectra. We assume that this relationship is valid for all nitroxide spectra. In Figure 6 through Figure 12, half-saturation power P1/2 curves from lineheight fitting are compared to P1/2 curves based on Eq. 14 using R1 and R2 derived from global lineshape fitting. To set the inhomogeneity parameter ε, we determine its relationship with the ratio of ΓL = R2/γ to total linewidth across the data set, which we term the fractional homogeneity X. Experimental values of fractional homogeneity are determined by combining ΓL = R2/γ and ΓG in the linewidth relation found by Dobryakov and Lebedev to recapitulate the total peak-to-peak linewidth Γpp without saturation broadening (91) in Eq. 21. These values (not shown) are just below all experimental linewidths. We define the ratio of the Lorentzian component to this total linewidth as the fractional homogeneity in Eq. 22.
| Eq. 21 |
| Eq. 22 |
The scatter plot in Figure 4 combines fractional homogeneity from lineshape analysis with the inhomogeneity parameter ε determined from lineheight fits using the same set of progressive saturation spectra, selecting cases with lineheight peaks below 40mW and ε values that increase or remain the same as PRA concentration increases. The resulting scatter plot fits provides ε values to generate P1/2 curves from lineshape R1 and R2 using Eq. 14. P1/2 curves match well in all cases within a constant, column C of Figure 6 through Figure 12 provide specific examples.
3.5 Absence of dipolar broadening checked
A control experiment was performed to verify that total dipolar broadening was low for our fast-relaxing PRAs. The increase in half-saturation power, ΔP1/2, due to 5mM Fe(CN)63- against IASL-labeled myosin S1 at 25°C changed from 33.7mW at 1cP viscosity to 3.32mW at 10cP. The 10cP case was created by adding 60% glycerol by weight in solution.
3.6 Lineshape vs saturation recovery R1 values
R1 data from lineshape fitting agrees with that from saturation recovery for deuterated tempone and IAPCPSL with NiEDDA0 added from 0 to 10 mM (Figure 5).
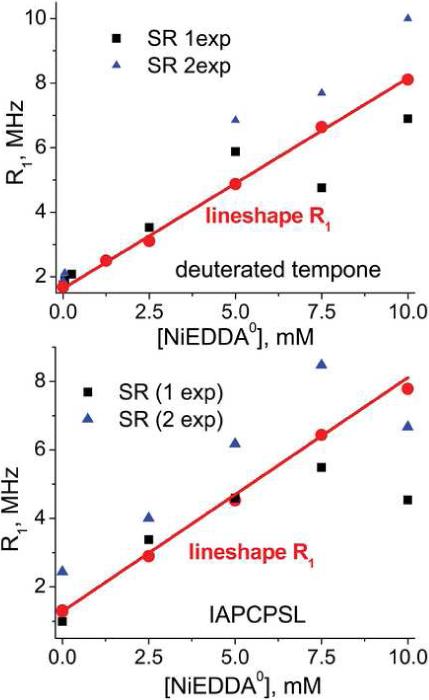
Pulsed saturation recovery measurements were made at the National Biological EPR Center in Milwaukee. They were performed with a 300 nS excitation pulse at microwave field amplitude from 1.0 to 2.0 G and a low power microwave observing field of ∼50 μG. Decays were acquired for 2 μS.
4. Discussion
4.1 Dipolar broadening error limits for PRAs
Nitroxide relaxation can occur through both collisional spin exchange and magnetic dipolar interactions. Dipolar interactions come in the form of field heterogeneity (increasing R2 alone) and resonant relaxation (assumed to increase R1 and R2 equally) and are often assumed to be insignificant for paramagnetic ions in solution (92), but some effects have been reported (46). By selecting fast-relaxing PRAs here, we ensure that collisional spin exchange is strongly favored over dipolar interactions. Since X-band EPR involves resonant absorption at 1010 Hz, PRAs that relax at significantly faster rates should produce no observable dipolar broadening. Resonant relaxation could only be significant when PRAs have significant spectral density overlapping that of the nitroxide label. Small paramagnetic metal complexes, such as the PRAs tested here, should only exhibit dipolar broadening. We wish to estimate the broadening for each . To do so, we extrapolate experiments between 0.5mM tempone and the paramagnetic complex Cu(en)2(H2O)22+ done by Anisimov (59). Table 3.3 on p.133 of (49) recapitulates this work with corrections.
In those experiments glycerol-water mixtures were used at 25°C to decrease translational diffusion and so minimize spin exchange. The residual tempone linewidth due to the combination of static dipolar broadening and broadening from dipolar relaxation was limited to 12% of that found in water with Cu(en)2(H2O)22+ added from 0 to 50 mM, i.e. ΓD/ΓSE < 0.12. We extrapolate from this limit to calculate corresponding limits for our PRAs using the relevant dipolar term from theory of proton relaxation enhancement with dissolved paramagnetic ions formulated by Bloembergen and Morgan (99, 100), repeated in Eq. 23.
| Eq. 23 |
We normalize for linewidth using 1.47 G for 10 mM Cu(en)2(H2O)22+ with 0.5mM tempone in water, p.133 in (49) and use measured linewidths of 10 mM [Cr(C2O4)33-, Fe(CN)63-, NiEDDA0, Ru(NH3)63+] from our 0.5 mM tempone experiment = [1.64, 0.53, 0.55, 0.72] G. Then Cu(en)2(H2O)22+ values μeff = 1.9 (61) and TPRA = 2.7×10⁻⁹ sec (59) are combined with values from Table 4 to form ratios based on Eq. 23 (ωs = 5.9×10¹⁰rad/s) for upper bounds on broadening due to dipolar relaxation as [Cr(C2O4)33-, Fe(CN)63-, NiEDDA0, Ru(NH3)63+] = [32, 0.0015, 0.15, 0.04]%.
4.2 Effective spin exchange rates compared to diffusion-controlled model
The spin exchange rate constants for NiEDDA0, Fe(CN)63-, Ru(NH3)63+ and Cr(C2O4)33- are 0.60, 0.81, 0.92 and 1.4 MHz/mM, respectively, against small six-membered ring nitroxides in aqueous buffer at 25°C. These come from measured increases in R1 (χ1) and so represent complete transfers of the excited spin state, much lower than the 3.6 MHz/mM rate anticipated for aqueous diffusion controlled reactions, p.154 in (49). These values are reasonable considering other ke measurements for transition metal complexes against nitroxides as given on p7 in (49). We determine the probability of spin exchange for Fe(CN)63- collisions with nitroxides is 0.81/3.6 = 0.22, matching the value of 0.2 found by (50).
4.3 Application ranges for lineheight and global lineshape fitting
In future voltage measurements approximate forms of Eq. 7 will be used based on ratios of parameters between charged and neutral PRAs. In the fast tumbling limit R1 = R2 proves adequate, allowing the ratio to be between square roots of P1/2 changes from lineheight fitting. In the slow tumbling limit R2 >> R1 making direct ratio of the P1/2 changes the most accurate approximation. Lineshape fitting may be used to find the ratio between the changes in R1 for such pairs across the whole range of cases, being less accurate that lineheight fitting only in the slow tumbling limit. We believe that it will be an important tool for accurate determination of voltage in intermediate cases where a label is floppy on a protein site.
4.4 Error between P1/2 curves
P1/2 curves derived from lineshape must be multiplied by constants from 1.0 for deuterated tempone to 1.4 for ASL-cys-allyl, with added Co(CN)63- or Co(NH3)63+ ions, to match those from lineheight, with specific examples in Figure 6 through Figure 12. The constant reveals an error that correlates with the degree of inhomogeneity in spectra. We attribute this to the absolute value of R1 from lineheight fitting being more sensitive than the R1 obtained from lineshape fitting to errors associated with discrete superhyperfine splitting and its averaging by setting the modulation amplitude close to peak-to-peak linewidth. Since our goal here has been to determine accurate relaxivities we are less concerned about this absolute value R1, which is not determined directly in lineheight measurements on proteins anyway.
5. Conclusions
We have calibrated a set of fast-relaxing PRAs for voltage measurements on spin labeled proteins with conventional EPR. We found correction factors of 1.35 for Fe(CN)63- and 1.54 for Ru(NH3)63+, to account for their higher spin exchange rates with respect to NiEDDA0. Using these correction factors, measured voltages for TEMPO-choline and carboxy-TEMPO lie within 1 mV of values calculated with Debye-Hückel theory. We validated the voltages measured with our PRAs on rabbit myosin S1 labeled at Cys707 with IASL, finding a match between measured voltages determined through lineheight fitting and those calculated based on the pK shift at Cys707 (thiol SH1) to about 1mV. R1 values were determined for small nitroxides from progressive saturation spectra through global lineshape fitting to perform these calibrations. The method and PRA set works even in the extreme case of a rigid label in a protein crevice as our measured voltages from lineshape and lineheight fitting on ASL-S1 show. We conclude that our method measures voltage with 1 mV accuracy for all nitroxides in buffer solution, from freely tumbling small molecules to spin-labeled proteins.
6. Acknowledgements
This work has been supported from grants to DDT from NIH (AR32961, GM27906). We are grateful to Karol Subczynski and Joutyna Widomska in the National Biological EPR Center in Milwaukee (NIH center grant # EB001980) for assistance in R1 measurements using saturation recovery. We thank Igor V. Negrashov for excellent programming assistance. We thank Yuri Nesmelov and Adam Burr for helpful discussions. All small molecule modeling was done in Fujitsu Cache™.
Appendix
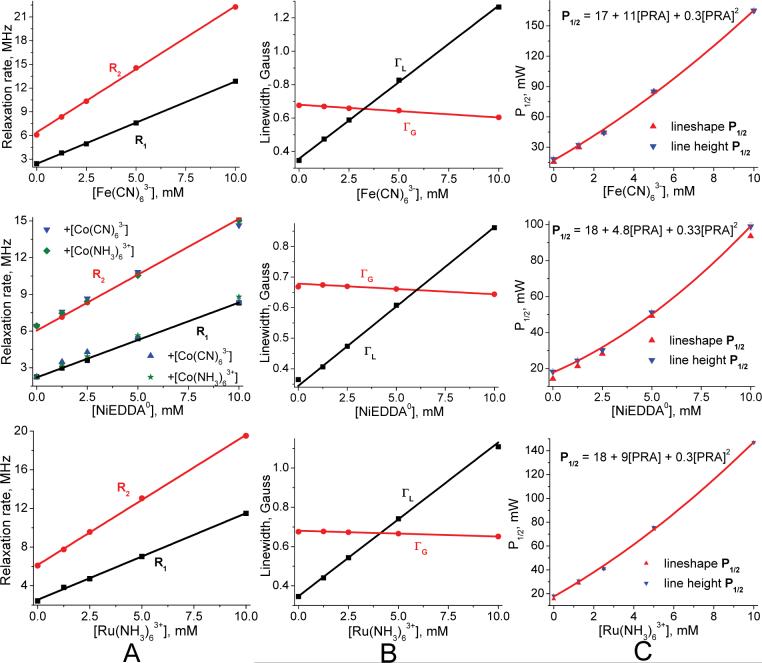
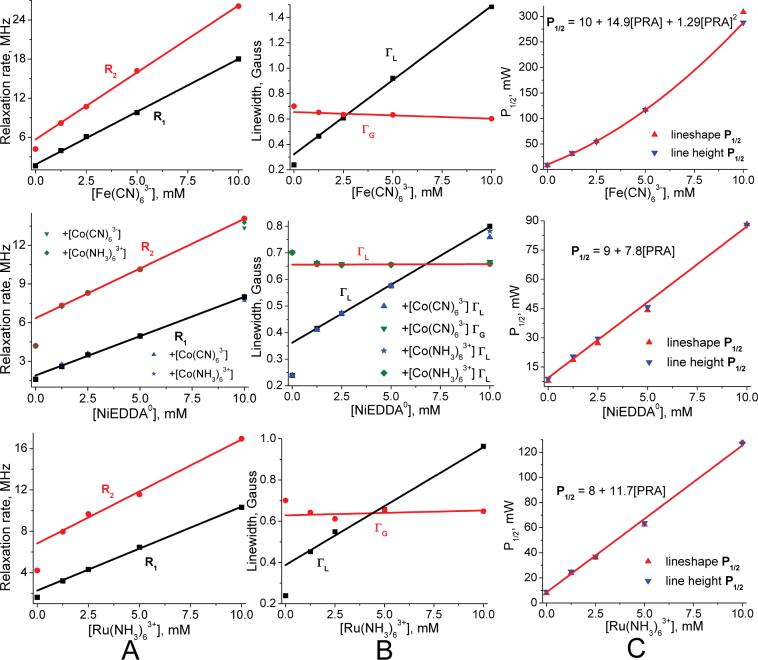
Figure 6. Effects of PRAs on the saturation of ASL-cys-methyl.
Values plotted in columns A and B come from global lineshape fitting based on the convolution of Eq. 18 with Eq. 17 show linear increases in R1 and R2 and a decrease in ΓG with added PRA in each case. Blue (downward pointing) triangles in column C are half saturation values determined directly from lineheight fitting using Eq. 12. For this, as in other small nitroxide cases, curves usually have quadratic curvatures. The red (upward pointing) triangles are half-saturation values generated from the combination of lineshape R1, R2 and ε using Figure 4 and Eq. 14. These are matched to lineheight values at 5mM with constants from 1.0 to 1.4 across all data sets, here 1.24 for all PRA cases. The close fit between curvatures validates the accuracy of relaxivities as determined from lineshape fitting and this is found in all experiments. The constants indicate error in the absolute values of R1, R2 and ε.
Figure 7.
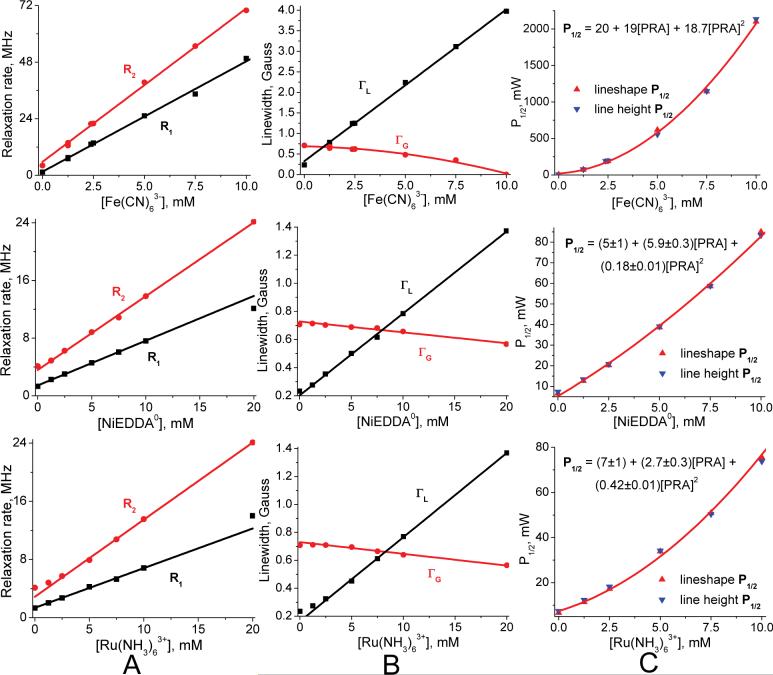
Positively charged TEMPO-choline. Values plotted as in Figure 6. Positive voltage at the nitroxyl oxygen enhances the interaction with Fe(CN)63- based on the much larger relaxation rates in column A. The loss in inhomogeneous broadening in column B is also much greater and the quadratic curvature of half-saturation power P1/2 is column C is much more pronounced. The weaker interaction of Ru(NH3)63+ is associated with more divergence from linearity near zero PRA concentration for both linewidths. The half-saturation power curves matched from lineshape results reflect the divergence in interactions, being multiplied by 1.16, 1.27 and 1.29 for added Fe(CN)63-, NiEDDA0 and Ru(NH3)63+ respectively, as expected based on the effect of more to less spin exchange on the prominence of splitting.
Figure 8.
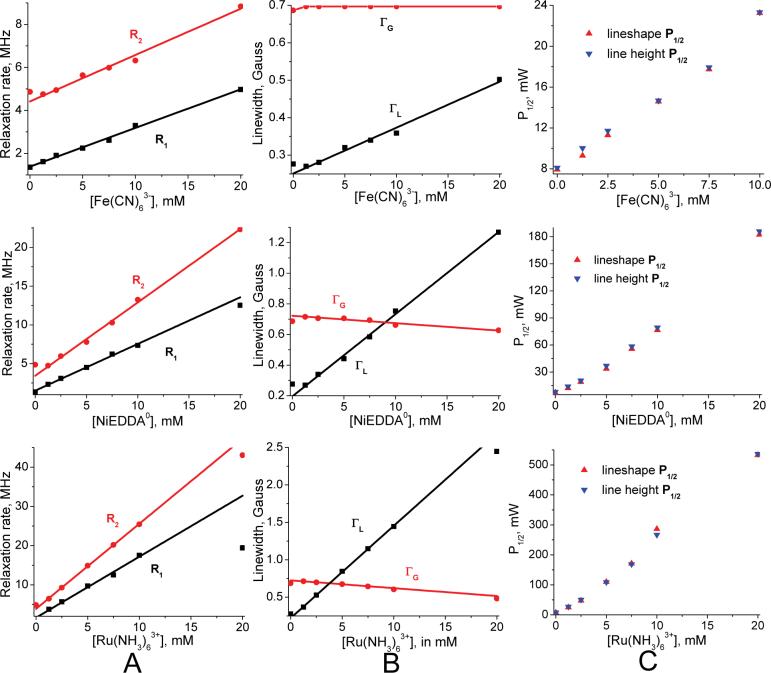
Negatively charged carboxy TEMPO. Values plotted as in Figure 6. Here the spin exchange interaction is reversed from Figure 7 with the Ru(NH3)63+ interaction enhanced. Lineshape half-saturation powers are multiplied of 1.33, 1.21 and 1.21 for added Fe(CN)63-, NiEDDA0 and Ru(NH3)63+ respectively, which indicates differential effects of PRA spin exchange on the underlying error between methods.
Figure 9.
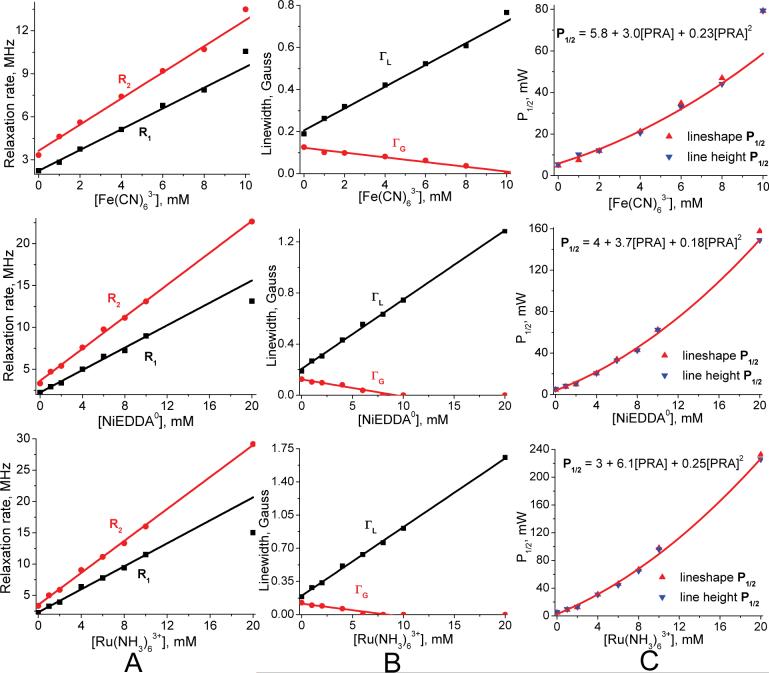
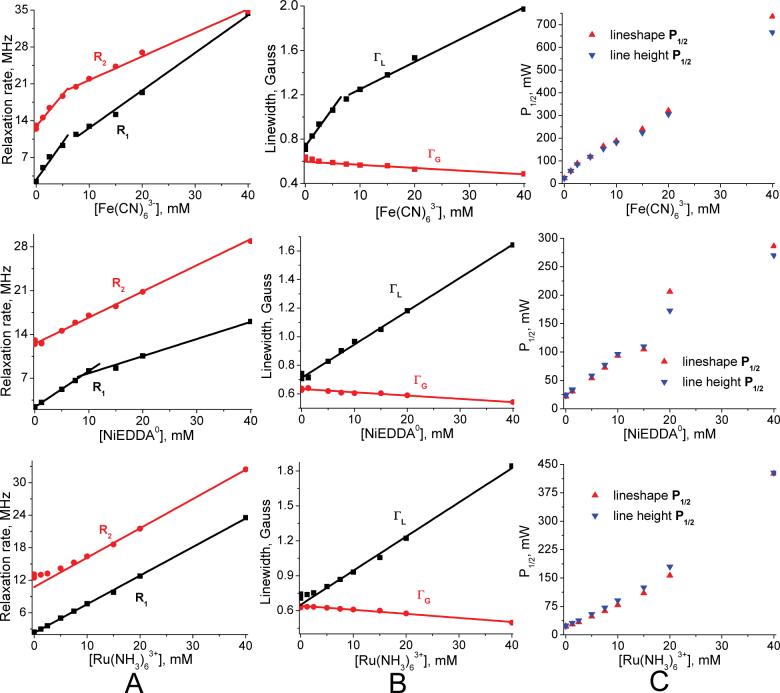
Tempone spin relaxation results. Values plotted as in Figure 6. Tempone is the smallest nitroxide tested. R1 and R2 go strongly supra-linear for Fe(CN)63- past 9 mM. This case is notable as the pairing of the smallest nitroxide with the smallest PRA. Inhomogeneous broadening is also minimal, going to zero between 7 and 10mM of added PRA in column B. Half saturation power plots match when all lineshape-derived values are multiplied by 1.0, reflecting near-homogeneity.
Figure 10.
Results for IASL. Values plotted as in Figure 6. Small nitroxide IASL is unique because it exhibits a comparatively large initial collapse in inhomogeneous linewidth ΓG between 0 and 1.25mM added PRA, correlating with a nonlinear upward shift in R2(ΓL). This and the fact that superhyperfine splitting is prominent suggests two methyl proton populations, one easily relaxed and the other largely unaffected by added PRA Note that more weakly interacting PRAs NiEDDA0 and Ru(NH3)63+ show the largest nonlinearity in columns A and B and essentially linear P1/2 curves in column C.
Figure 11.
MSL-PEG bead column results. Values plotted as in Figure 6. R20/R10 = 3. Bimodal R1 plots for Fe(CN)63- and NiEDDA0 suggests coordination effects with distal ammines on PEG chains which limit collisional spin exchange past 10 mM. Relaxation enhancement may have a large dipolar component at higher concentration. Initial linewidth changes are significant for the charged PRAs. Fe(CN)63- has the strongest relaxation on the system and Ru(NH3)63+ the weakest as expected for the positively charged environment. Note that nonlinearities in half-saturation power P1/2 match between lineshape and lineheight fitting results. Here lineshape data is multiplied by 1.1, 1.25 and 1.3 for added Fe(CN)63-, NiEDDA0 and Ru(NH3)63+ respectively.
Figure 12. ASL-S1 results.
Values plotted as in Figure 6. Here R20/R10 ≈ 100. This rigidly labeled protein case is at the extreme limit for global lineshape fitting. Fe(CN)63- is the most accessible while NiEDDA0 is least accessible in the plots. CrOx is even less accessible (results not shown). R1 show a linear increase with added PRA in all cases. P1/2 curves are linear and reflect R1 enhancement as expected. Lineshape P1/2 values are increased by a factor of 1.1 for an overall fit to lineheight curves and distortions caused by R2 shifts are generally reflected in both sets of data.
Footnotes
Publisher's Disclaimer: This is a PDF file of an unedited manuscript that has been accepted for publication. As a service to our customers we are providing this early version of the manuscript. The manuscript will undergo copyediting, typesetting, and review of the resulting proof before it is published in its final citable form. Please note that during the production process errors may be discovered which could affect the content, and all legal disclaimers that apply to the journal pertain.
To be submitted to Journal of Magnetic Resonance
REFERENCES
- 1.Honig B, Nicholls A. Classical electrostatics in biology and chemistry. Science. 1995;268:1144–9. doi: 10.1126/science.7761829. [DOI] [PubMed] [Google Scholar]
- 2.Fogolari F, Brigo A, Molinari H. The Poisson-Boltzmann equation for biomolecular electrostatics: a tool for structural biology. Journal of Molecular Recognition. 2002;15:377–392. doi: 10.1002/jmr.577. [DOI] [PubMed] [Google Scholar]
- 3.Liao JL, Beratan DN. How does protein architecture facilitate the transduction of ATP chemical-bond energy into mechanical work? The cases of nitrogenase and ATP binding-cassette proteins. Biophys J. 2004;87:1369–77. doi: 10.1529/biophysj.103.038653. [DOI] [PMC free article] [PubMed] [Google Scholar]
- 4.Stauffer DA, Karlin A. Electrostatic potential of the acetylcholine binding sites in the nicotinic receptor probed by reactions of binding-site cysteines with charged methanethiosulfonates. Biochemistry. 1994;33:6840–9. doi: 10.1021/bi00188a013. [DOI] [PubMed] [Google Scholar]
- 5.Karlin A, Akabas MH, Czajkowski C, Kaufmann C, Stauffer D, Xu M. Structures involved in binding, gating, and conduction in nicotinic acetylcholine receptors. Ren Physiol Biochem. 1994;17:184–6. doi: 10.1159/000173814. [DOI] [PubMed] [Google Scholar]
- 6.Highsmith S, Polosukhina K, Eden D. Myosin motor domain lever arm rotation is coupled to ATP hydrolysis. Biochemistry. 2000;39:12330–5. doi: 10.1021/bi001146d. [DOI] [PubMed] [Google Scholar]
- 7.Sasaki N, Ohkura R, Sutoh K. Dictyostelium myosin II mutations that uncouple the converter swing and ATP hydrolysis cycle. Biochemistry. 2003;42:90–5. doi: 10.1021/bi026051l. [DOI] [PubMed] [Google Scholar]
- 8.Feynmann RP. Forces in Molecules. Physical Review. 1939;56:340–343. [Google Scholar]
- 9.Hellmann H. Einfuhrung in die Quantenchemie. F. Deuticke; Leipzig: 1937. [Google Scholar]
- 10.Anderson JS, Lemaster DM, Hernandez G. Electrostatic Potential Energy within a Protein Monitored by Metal Charge-Dependent Hydrogen Exchange. Biophys J. 2006;91:L93–5. doi: 10.1529/biophysj.106.094219. [DOI] [PMC free article] [PubMed] [Google Scholar]
- 11.Urry DW, Gowda DC, Peng S, Parker TM. Non-linear hydrophobic-induced pKa shifts: Implications for efficiency of conversion to chemical energy. Chemical Physics Letters. 1995;239:67–74. [Google Scholar]
- 12.Urry DW, Peng S, Gowda DC, Parker TM. Comparison of electrostatic and hydrophobic-induced pKa shifts in polypentapeptides: The lysine residue. Chemical Physics Letters. 1994; 225:97–103. [Google Scholar]
- 13.Sternberg MJE, Hayes FRF, Russell AJ, Thomas PG, Fersht AR. Prediction of electrostatic effects of engineering of protein charges. Nature. 1987;330:86–88. doi: 10.1038/330086a0. [DOI] [PubMed] [Google Scholar]
- 14.Thurlkill RL, Grimsley GR, Scholtz JM, Pace CN. pK values of the ionizable groups of proteins. Protein Sci. 2006;15:1214–8. doi: 10.1110/ps.051840806. [DOI] [PMC free article] [PubMed] [Google Scholar]
- 15.Takamori K, Kato KA, Sekine T. Thiols of myosin. IV. “Abnormal” reactivity of S1 thiol and the conformational changes around S2 thiol. J Biochem (Tokyo) 1976;80:101–10. doi: 10.1093/oxfordjournals.jbchem.a131241. [DOI] [PubMed] [Google Scholar]
- 16.Shin YK, Hubbell WL. Determination of electrostatic potentials at biological interfaces using electron-electron double resonance. Biophyscial Journal. 1992;61:1443–1453. doi: 10.1016/S0006-3495(92)81950-1. [DOI] [PMC free article] [PubMed] [Google Scholar]
- 17.Hecht JL, Honig B, Shin YK, Hubbell WL. Electrostatic Potentials near-the-Surface of DNA - Comparing Theory and Experiment. Journal of Physical Chemistry. 1995;99:7782–7786. [Google Scholar]
- 18.Highsmith S, Duignan K, Franks-Skiba K, Polosukhina K, Cooke R. Reversible inactivation of myosin subfragment 1 activity by mechanical immobilization. Biophys J. 1998;74:1465–72. doi: 10.1016/S0006-3495(98)77858-0. [DOI] [PMC free article] [PubMed] [Google Scholar]
- 19.Baker JE, Brust-Mascher I, Ramachandran S, LaConte LE, Thomas DD. A large and distinct rotation of the myosin light chain domain occurs upon muscle contraction. Proc Natl Acad Sci U S A. 1998;95:2944–9. doi: 10.1073/pnas.95.6.2944. [DOI] [PMC free article] [PubMed] [Google Scholar]
- 20.Fogolari F, Ragona L, Licciardi S, Romagnoli S, Michelutti R, Ugolini R, Molinari H. Electrostatic properties of bovine beta-lactoglobulin. Proteins. 2000;39:317–30. doi: 10.1002/(sici)1097-0134(20000601)39:4<317::aid-prot50>3.0.co;2-w. [DOI] [PubMed] [Google Scholar]
- 21.Vale RD. AAA proteins. Lords of the ring. J Cell Biol. 2000;150:F13–9. doi: 10.1083/jcb.150.1.f13. [DOI] [PMC free article] [PubMed] [Google Scholar]
- 22.Vale RD. Switches, latches, and amplifiers: common themes of G proteins and molecular motors. J Cell Biol. 1996;135:291–302. doi: 10.1083/jcb.135.2.291. [DOI] [PMC free article] [PubMed] [Google Scholar]
- 23.Karlin A. Scam feels the pinch. J Gen Physiol. 2001;117:235–8. doi: 10.1085/jgp.117.3.235. [DOI] [PMC free article] [PubMed] [Google Scholar]
- 24.Davies MN, Toseland CP, Moss DS, Flower DR. Benchmarking pK(a) prediction. BMC Biochem. 2006;7:18. doi: 10.1186/1471-2091-7-18. [DOI] [PMC free article] [PubMed] [Google Scholar]
- 25.Kossekova G, Miteva M, Atanasov B. Characterization of pyridoxal phosphate as an optical label for measuring electrostatic potentials in proteins. J Photochem Photobiol B. 1996;32:71–9. doi: 10.1016/1011-1344(95)07211-x. [DOI] [PubMed] [Google Scholar]
- 26.Christov C, Ianev D, Shosheva A, Atanasov B. pH-dependent quenching of the fluorescence of tryptophan residues in class A beta-lactamase from E. coli (TEM-1) Z Naturforsch [C] 2004;59:824–7. doi: 10.1515/znc-2004-11-1210. [DOI] [PubMed] [Google Scholar]
- 27.Winiski AP, Eisenberg M, Langer M, McLaughlin S. Fluorescent probes of electrostatic potential 1 nm from the membrane surface. Biochemistry. 1988;27:386–392. doi: 10.1021/bi00401a058. [DOI] [PubMed] [Google Scholar]
- 28.Ando T, Kobayashi N, Munekata E, Pollack H.S.a.G.H., editors. Advances in experimental medicine and biology. Vol. 332. 1993. Electrostatic potential around actin; pp. 361–376. [DOI] [PubMed] [Google Scholar]
- 29.Yamamoto T, Nakayama S, Kobayashi N, Munekata E, Ando T. Determination of electrostatic potential around specific locations on the surface of actin by diffusion-enhanced fluorescence resonance energy transfer. Journal of Molecular Biology. 1994;241:714–731. doi: 10.1006/jmbi.1994.1546. [DOI] [PubMed] [Google Scholar]
- 30.Wensel TG, Meares CF. Electrostatic properties of myoglobin probed by diffusion-enhanced energy transfer. Biochemistry. 1983;22:6247–6254. [Google Scholar]
- 31.Wensel TG, Chang C-H, Meares CF. Diffusion-enhanced lanthanide energy-transfer study of DNA-bound cobalt(III) bleomycins: Comparisons of accessibility and electrostatic potential with DNA complexes of ethidium and acridine orange. Biochemistry. 1985;24:3060–3069. doi: 10.1021/bi00333a039. [DOI] [PubMed] [Google Scholar]
- 32.Meltzer RH, Vila-Carriles W, Ebalunode JO, Briggs JM, Pedersen SE. Computed pore potentials of the nicotinic acetylcholine receptor. Biophys J. 2006;91:1325–35. doi: 10.1529/biophysj.106.081455. [DOI] [PMC free article] [PubMed] [Google Scholar]
- 33.Meltzer RH, Thompson E, Soman KV, Song XZ, Ebalunode JO, Wensel TG, Briggs JM, Pedersen SE. Electrostatic steering at acetylcholine binding sites. Biophys J. 2006;91:1302–14. doi: 10.1529/biophysj.106.081463. [DOI] [PMC free article] [PubMed] [Google Scholar]
- 34.Meltzer RH, Lurtz MM, Wensel TG, Pedersen SE. Nicotinic acetylcholine receptor channel electrostatics determined by diffusion-enhanced luminescence energy transfer. Biophys J. 2006;91:1315–24. doi: 10.1529/biophysj.106.081448. [DOI] [PMC free article] [PubMed] [Google Scholar]
- 35.Teng C-L, Bryant RG. Spin relaxation measurements of electrostatic bias in intermolecular exploration. Journal of Magnetic Resonance. 2006;179:199–205. doi: 10.1016/j.jmr.2005.12.001. [DOI] [PubMed] [Google Scholar]
- 36.Likhtenshtein GI, Adin I, Novoselsky A, Shames A, Vaisbuch I, Glaser R. NMR studies of electrostatic potential distribution around biologically important molecules. Biophysical Journal. 1999;77:443–453. doi: 10.1016/S0006-3495(99)76902-X. [DOI] [PMC free article] [PubMed] [Google Scholar]
- 37.Liktenshtein GI, Grebenshchikov YB, Avilova TV. An investigation of the microrelief and conformational mobility of proteins by the ESR method. Molecular Biology. 1972;6:67–76. (translated from Russian). [PubMed] [Google Scholar]
- 38.Lin Y, Nielsen R, Murray D, Hubbell WL, Mailer C, Robinson BH, Gelb MH. Docking phospholipase A(2) on membranes using electrostatic potential-modulated spin relaxation magnetic resonance. Science. 1998;279:1925–1929. doi: 10.1126/science.279.5358.1925. [DOI] [PMC free article] [PubMed] [Google Scholar]
- 39.Grebenshchikov YB, Likhtenshtein GI, Ivanov VP, Rozantsev EG. Investigation of electrostatic charges in proteins by the paramagnetic probe method. Molecular Biology. 1972;6:400–406. (translated from Russian). [PubMed] [Google Scholar]
- 40.Canaan S, Nielsen R, Ghomashchi F, Robinson BH, Gelb MH. Unusual mode of binding of human group IIA secreted phospholipase A(2) to anionic interfaces as studied by continuous wave and time domain electron paramagnetic resonance spectroscopy. Journal of Biological Chemistry. 2002;277:30984–30990. doi: 10.1074/jbc.M203649200. [DOI] [PubMed] [Google Scholar]
- 41.Likhtenshtein GI. Spin Labeling Methods in Molecular Biology. Wiley: 1976. [Google Scholar]
- 42.Addona GH, Andrews SH, Cafiso DS. Estimating the electrostatic potential at the acetylcholine receptor agonist site using power saturation EPR. Biochimica et biophysica acta. 1997;1329:74–84. doi: 10.1016/s0005-2736(97)00089-8. [DOI] [PubMed] [Google Scholar]
- 43.Nielsen RD, Canaan S, Gladden JA, Gelb MH, Mailer C, Robinson BH. Comparing continuous wave progressive saturation EPR and time domain saturation recovery EPR over the entire motional range of nitroxide spin labels. J Magn Reson. 2004;169:129–63. doi: 10.1016/j.jmr.2004.04.010. [DOI] [PubMed] [Google Scholar]
- 44.Hyde JS, Chien JCW, Freed JH. Electron-electron double resonance of free radicals in solution. Journal of Chemical Physics. 1968;48:4211–4226. [Google Scholar]
- 45.Dalton LA, Monge J-L, Dalton LR, Kwiram AL. Molecular and applied modulation effects in electron-electron double resonance III. Bloch equation analysis for inhomogeneous broadening. Chemical Physics. 1974;6:166–182. [Google Scholar]
- 46.Hyde JS, Sarna T. Magnetic interactions between nitroxide free radicals and lanthanides or Cu2+ in liquids. Journal of Chemical Physics. 1978;68:4439–4447. [Google Scholar]
- 47.Altenbach C, Froncisz W, Hyde JS, Hubbell WL. Conformation of spin-labeled melittin at membrane surfaces investigated by pulse saturation recovery and continuous wave power saturation electron paramagnetic resonance. Biophys J. 1989;56:1183–91. doi: 10.1016/S0006-3495(89)82765-1. [DOI] [PMC free article] [PubMed] [Google Scholar]
- 48.Pyka J, Ilnicki J, Altenbach C, Hubbell WL, Froncisz W. Accessibility and dynamics of nitroxide side chains in T4 lysozyme measured by saturation recovery EPR. Biophys J. 2005;89:2059–68. doi: 10.1529/biophysj.105.059055. [DOI] [PMC free article] [PubMed] [Google Scholar]
- 49.Molin YN, Salikhov KM, Zamaraev KI. Spin Exchange, Principles and Applications in Chemistry and Biology. In: Goldanskii e.a., editor. Springer series in chemical physics. Springer: 1980. [Google Scholar]
- 50.Kulikov AV, Likhtenstein GI. The use of spin relaxation phenomena in the investigation of the structure of model and biological systems by the method of spin labels. Advances in molecular relaxation and interaction processes. 1977;10:47–79. [Google Scholar]
- 51.Hill TL. An Introduction to Statistical Thermodynamics. Dover: 1956. [Google Scholar]
- 52.Bales BL, Willett D. EPR investigation of the intermediate spin exchange regime. Journal of Chemical Physics. 1984;80:2997–2999. [Google Scholar]
- 53.Waysbort D, Navon G. NMR study of the nature of the second coordination sphere in aqueous solutions of ruthenium(III) hexaammine. Journal of Physical Chemistry. 1980;84:674–678. [Google Scholar]
- 54.Averill DF, Legg JI, Smith DL. Five-coordinate, square-pyramidal chelate complexes of a novel tetradentate amino acid like ligand. Inorganic Chemistry. 1972;11:2344–9. [Google Scholar]
- 55.Waysbort D, Navon G. Proton NMR and covalency parameters of ruthenium(III) hexaammine. Journal of Chemical Physics. 1973;59:5585–5590. [Google Scholar]
- 56.Figgis BN, Reynolds PA. Diffraction experiments and the theory of simple transition metal complexes. International Reviews in Physical Chemistry. 1986;5:265–272. [Google Scholar]
- 57.Cano J, Ruiz E, Alvarez S, Verdaguer M. Spin density distribution in transition metal complexes: Some thoughts and hints. Comments on Inorganic Chemistry. 1998;20:27–56. [Google Scholar]
- 58.Altenbach C. Accessibility of nitroxide side chains: Absolute Heisenberg exchange rates from power saturation EPR. Biophysical Journal. 2005;89:2103–2112. doi: 10.1529/biophysj.105.059063. [DOI] [PMC free article] [PubMed] [Google Scholar]
- 59.Anisimov OA, Nikitaev AT, Zamaraev KI, Molin YN. Separation of exchange and dipole-dipole broadening on the basis of viscosity changes is ESR spectra. Theoretical and Experimental Chemistry. 1971;7:556–559. (translated from Russian). (originally 682−686). [Google Scholar]
- 60.Pontillon Y, Grand A, Ishida T, Lelievre-Berna E, Nogami T, Ressouche E, Schweizer J. Spin density of a ferromagnetic TEMPO derivative: polarized neutron investigation and ab initio calculation. Journal of Materials Chemistry. 2000;10:1539–46. [Google Scholar]
- 61.Pauling L. General Chemistry. Dover reprint edition 1988. [Google Scholar]
- 62.Taube H. Substitution reactions of ruthenium ammines. Comments on Inorganic Chemistry. 1981;1:17–31. [Google Scholar]
- 63.Graceffa P, Seidel JC. A reaction involving protein sulfhydryl groups, a bound spin-label, and K3Fe(CN)6 as a probe of sulfhydryl proximity in myosin. Biochemistry. 1980;19:33–39. doi: 10.1021/bi00542a006. [DOI] [PubMed] [Google Scholar]
- 64.Bergethon PR, Simons ER. Biophysical Chemistry. Springer Verlag; 1990. [Google Scholar]
- 65.Daune M. Molecular Biophysics; Structures in motion. Oxford University Press; 1999. [Google Scholar]
- 66.Altenbach C, Flitsch SL, Khorana G, Hubbell WL. Structural studies of transmembrane proteins. 2. Spin Labeling of bacteriorhodopsin mutants at unique cysteines. Biochemistry. 1989;28:7806–7812. doi: 10.1021/bi00445a042. [DOI] [PubMed] [Google Scholar]
- 67.Altenbach C, Duncan A, Greenhalgh H, Khorana G, Hubbell WL. A collision gradient method to determine the immersion depth of nitroxides in lipid bilayers: Application to spin-labeled mutants of bacteriorhodopsin. Proceedings of the National Academy of Science USA. 1994;91:1667–1671. doi: 10.1073/pnas.91.5.1667. [DOI] [PMC free article] [PubMed] [Google Scholar]
- 68.Sahlin M, Graslund A, Ehrenberg A. Determination of relaxation times for a free radical from microwave saturation studies. Journal of Magnetic Resonance. 1986;67:135–137. [Google Scholar]
- 69.Hyde JS, Subczynski WK. Spin Label Oximetry. In: L.J.a.R., Berliner J, editors. Biological Magnetic Resonance. Plenum; 1989. [Google Scholar]
- 70.More KM, Eaton GR, Eaton SS. Determination of T1 and T2 by simulation of EPR power saturation curves and saturated spectra. Application to Spin-labeled iron porphyrins. Journal of Magnetic Resonance. 1984;60:54–65. [Google Scholar]
- 71.Portis AM. Electronic structure of F centers: Saturation of the electron spin resonance. Physical Review. 1953;91:1071–1078. [Google Scholar]
- 72.Castner TG. Saturation of the paramagnetic resonance of a V center. Physical Review. 1959;115:1506–1515. [Google Scholar]
- 73.Bales BL. Spin Labeling Theory and Applications. Plenum; 1989. Chapter 2: Inhomogeneously broadened spin label spectra. [Google Scholar]
- 74.Poole CP. Electron Spin Resonance. 2nd ed. Dover reprint of 1983 Wiley edition 1996. [Google Scholar]
- 75.Robinson BH, Mailer C, Reese AW. Linewidth analysis of spin labels in liquids I. Theory and data analysis. Journal of Magnetic Resonance. 1999;138:199–209. doi: 10.1006/jmre.1999.1737. [DOI] [PubMed] [Google Scholar]
- 76.Robinson BH, Mailer C, Reese AW. Linewidth analysis of spin labels in liquids II. Experimental. Journal of Magnetic Resonance. 1999;138:210–219. doi: 10.1006/jmre.1999.1738. [DOI] [PubMed] [Google Scholar]
- 77.Hwang JS, Mason RP, Hwang LP, Freed JH. Electron spin resonance studies of anisotropic rotational reorientation and slow tumbling in liquid and frozen media. III. Perdeuterated 2,2,6,6-tetramethyl-4-piperidone N-oxide and an analysis of fluctuating torques. Journal of Physical Chemistry. 1975;79:489–511. [Google Scholar]
- 78.Windrem DA, Plachy WZ. The diffusion-solubility of Oxygen in lipid bilayers. Biochimica et biophysica acta. 1980;600:655–665. doi: 10.1016/0005-2736(80)90469-1. [DOI] [PubMed] [Google Scholar]
- 79.Hyde JS, Subczynski WK. Simulation of ESR spectra of the oxygen-sensitive spin-label probe CTPO. Journal of Magnetic Resonance. 1984;56:125–130. [Google Scholar]
- 80.Smirnov AI, Belford RL. Rapid quantitation from inhomogeneously broadened EPR spectra by a fast convolution algorithm. Journal of magnetic Resonance, Series A. 1995;113:65–73. [Google Scholar]
- 81.Marsh D. Spin Labeling Theory and Applications. Plenum; 1989. Chapter 5: Experimental methods in spin-label spectral analysis. [Google Scholar]
- 82.Barnett VA, Thomas DD. Resolution of conformational states of spin-labeled myosin during steady-state ATP hydrolysis. Biochemistry. 1987;26:314–323. doi: 10.1021/bi00375a044. [DOI] [PubMed] [Google Scholar]
- 83.Shimshick EJ, McConnell HM. Lateral phase separation in phospholipid membranes. Biochemistry. 1973;12:2351–2360. doi: 10.1021/bi00736a026. [DOI] [PubMed] [Google Scholar]
- 84.Kooser RG, Volland WV, Freed JH. ESR relaxation studies on orbitally degenerate free radicals. I. Benzene anion and tropenyl. Journal of Chemical Physics. 1969;50:5243–5257. [Google Scholar]
- 85.Kirby T, Karim CB, Thomas DD. Electron paramagnetic resonance reveals a large-scale conformational change in the cytoplasmic domain of phospholamban upon binding to the sarcoplasmic reticulum Ca-ATPase. Biochemistry. 2004;42:5842–5852. doi: 10.1021/bi035749b. [DOI] [PubMed] [Google Scholar]
- 86.Diakova G, Bryant RG. The aqueous reference for ESR oximetry. J Magn Reson. 2006;178:329–33. doi: 10.1016/j.jmr.2005.10.004. [DOI] [PubMed] [Google Scholar]
- 87.Yager TD, Eaton GR, Eaton SS. Metal-nitroxyl interactions. 12. Nitroxyl spin probes in the presence of tris(oxalato)chromate(III) Inorganic Chemistry. 1979;18:725–727. [Google Scholar]
- 88.Hiratsuka Y, Eto M, Yazawa M, Morita F. Reactivities of Cys707 (SH1) in intermediate states of myosin subfragment-1 ATPase. J Biochem (Tokyo) 1998;124:609–14. doi: 10.1093/oxfordjournals.jbchem.a022155. [DOI] [PubMed] [Google Scholar]
- 89.Tanford C, Roxby R. Interpretation of protein titration curves. Application to lysozyme. Biochemistry. 1972;11:2192–8. doi: 10.1021/bi00761a029. [DOI] [PubMed] [Google Scholar]
- 90.Haas DA, Mailer C, Robinson BH. Using Nitroxide Spin Labels. Biophysical Journal. 1993;64:594–604. doi: 10.1016/S0006-3495(93)81418-8. [DOI] [PMC free article] [PubMed] [Google Scholar]
- 91.Dobryakov SN, Lebedev YS. Analysis of spectral lines whose profile is described by a composition of Gaussian and Lorentz profiles. Soviet Physics--Dolkady. 1969;13:873–875. [Google Scholar]
- 92.Eastman MP, Kooser RG, Das MR, Freed JH. Studies of Heisenberg spin exchange ESR spectra. I. Linewidth and saturation effects. Journal of Chemical Physics. 1969;51:2690–2708. [Google Scholar]
- 93.Poole CP, Farach HA, editors. Handbook of Electron Spin Resonance. American Institute of Physics; 1994. [Google Scholar]
- 94.Bertini I, Luchinat C, Parigi G. 1H NMRD profiles of paramagnetic aquo-complexes and metalloproteins. In: VanEldik R, Bertini I, editors. Relaxometry of water-metal ion interactions. 2005. pp. 105–172. [Google Scholar]
- 95.Teng C-L, Hong H, Kihne S, Bryant RG. Molecular oxygen spin-lattic relaxation in solutions measured by proton magnetic relaxation dispersion. Journal of Magnetic Resonance. 2001;148:31–34. doi: 10.1006/jmre.2000.2219. [DOI] [PubMed] [Google Scholar]
- 96.Lyapilina MG, Krylov EI, Sharov VA. Electron spectra and magnetochemical study of chromium oxalate hexahydrate and its complex compounds in hydrazine. Ahurnal Neorganicheskoi Khimii. 1975;20:816–817. [Google Scholar]
- 97.Figgis BN, Lewis J, Mabbs FE, Webb GA. Magnetic properties of some Iron(III) and Ruthenium(III) low-spin complexes. Journal of the Chemical Society A, Inorganic Phys Theory. 1966:422–426. [Google Scholar]
- 98.Chiarotti Giulotto. Proton relaxation in water. Physical Review. 1954;93:1241. [Google Scholar]
- 99.Bloembergen N. Proton relaxation times in paramagnetic solution. Journal of Chemical Physics. 1957;27:572–573. [Google Scholar]
- 100.Bloembergen N, Morgan LO. Proton relaxation times in paramagnetic solutions. Effects of electron spin relaxation. Journal of Chemical Physics. 1961;34:842–850. [Google Scholar]


