

Abstract
Changes in Manganese-Enhanced MRI (MEMRI) contrast across the rodent somatosensory cortex were compared to the cortical laminae as identified by tissue histology and administration of an anatomical tracer to cortex and thalamus. Across the cortical thickness, MEMRI signal intensity was low in layer I, increased in layer II, decreased in layer III until mid-layer IV, and increased again, peaking in layer V, before decreasing through layer VI. The reeler mouse mutant was used to confirm that the cortical alternation in MEMRI contrast was related to laminar architecture. Unlike in wild-type mice, the reeler cortex showed no appreciable changes in MEMRI signal, consistent[ACS1] with absence of cortical laminae in histological slides. The tract-tracing ability of MEMRI was used to further confirm assignments and demonstrate laminar specificity. Twelve to sixteen hours after stereotaxic injections of MnCl2 to the ventroposterior thalamic nuclei, an overall increase in signal intensity was detected in primary somatosensory cortex compared to other brain regions. Maximum intensity projection images revealed a distinctly bright stripe located 600 − 700 μm below the pial surface, in layer IV. The data show that both systemic and tract-tracing forms of MEMRI are useful for studying laminar architecture in the brain.
Keywords: brain, cortical layers, neuroarchitecture, neuronal tract tracing, somatosensory cortex
Introduction
There is growing interest in using MRI to obtain information about brain structure and function at spatial resolutions suitable for studying sub-regions in the brain. Functional MRI (fMRI) has been increasingly used to map areas of activation with high spatial and temporal resolution. Since its beginning, fMRI has been able to distinguish major areas of the cortex (Belliveau, Kennedy, Jr. et al., 1991;Kim, Ashe et al., 1993;Hinke, Hu et al., 1993;Rao, Binder et al., 1993;Rueckert, Appollonio et al., 1994). Recently, a significant push for improving the spatial resolution of fMRI has allowed mapping of elemental functional units in the cortex, such as individual digits in motor/somatosensory cortex (Kurth, Villringer et al., 2000), ocular dominance columns in the visual cortex (Kim, Duong et al., 2000;Goodyear and Menon, 2001;Cheng, Waggoner et al., 2001), individual whisker barrels (Yang, Hyder et al., 1996), and laminae of the olfactory bulb (Kida, Xu et al., 2002) and somatosensory cortex (Silva and Koretsky, 2002) in rodents. In addition to fMRI, anatomical MRI techniques have also been used to obtain architectural information in the brain. For example, diffusion tensor imaging has provided probabilistic maps of cortical areas based on connections from the thalamus (Wiegell, Tuch et al., 2003). Direct detection of cortical myelin using MRI has been demonstrated in humans and non-human primates (Barbier, Marrett et al., 2002;Walters, Egan et al., 2003) and is proving useful for classical myeloarchitectural approaches to delineate boundaries between cortical regions non-invasively. Increasing the number of anatomical MRI tools that enable detection of cytoarchitectural boundaries would be very important for further increasing the specificity of MRI as well as comparing anatomical to functional boundaries under various conditions.
The manganese ion has been shown to be a very useful MRI contrast agent for studying the brain – for a review see (Lee and Koretsky, 2004;Silva, Lee et al., 2004;Pautler, 2006;Bock and Silva, 2007). Due to the ability of Mn2+ to enter cells through voltage-gated calcium channels, manganese-enhanced MRI (MEMRI) can be used to demarcate active regions of the brain (Lin and Koretsky, 1997;Duong, Silva et al., 2000;Aoki, Tanaka et al., 2002;Yu, Wadghiri et al., 2005;Yu, Sanes et al., 2007;Weng, Chen et al., 2007). Further, when injected to a specific brain region, Mn2+ will move along appropriate neuronal pathways in an anterograde fashion, thus enabling MEMRI to be used to trace neuronal connections in the living brain directly (Pautler, Silva et al., 1998;Saleem, Pauls et al., 2002;Van der, Verhoye et al., 2002;Pautler, Mongeau et al., 2003). Combining the activity-based accumulation of Mn2+ with its tract-tracing properties enables unique mapping of functional connectivity with MEMRI (Pautler and Koretsky, 2002). Furthermore, systemic administration of Mn2+ has opened up new MRI-based strategies for enhancement of the brain neuroarchitecture (Natt, Watanabe et al., 2002;Watanabe, Natt et al., 2002;Aoki, Wu et al., 2004;Wadghiri, Blind et al., 2004;Watanabe, Frahm et al., 2004;Lee, Silva et al., 2005). Systemic administration of Mn2+ leads to unique MRI enhancement in specific areas of the brain. In particular, MEMRI has been shown to be sensitive to cytoarchitecture, such as lamination in hippocampus, cerebellum, olfactory bulb, retina, and cortex (Watanabe, Natt et al., 2002;Aoki, Wu et al., 2004;Lee, Silva et al., 2005). The ability to detect cortical and cerebellar laminae has been used to analyze changes that occur in cerebral architecture due to specific mutations in the mouse brain (Wadghiri, Blind et al., 2004;Angenstein, Niessen et al., 2006). In most brain regions, lamination detected by MEMRI could be readily assigned by visual inspection. However, in cerebral cortex, a rigorous assignment of the laminae has proven difficult due to the subtle MEMRI contrast in cortex and due to the stringent requirements for high-resolution imaging.
The overall goal of the present work was to investigate the potential of MEMRI in the study of cortical cytoarchitectonics. While cortical cytoarchitecture has been widely studied via post mortem histology, in situ imaging of cortical cytoarchitecture would allow dynamic tracking of neuroarchitectonical changes and hence enable longitudinal investigation of such changes during development, learning, and plasticity. To investigate whether the variation in cellular density, size and activity in cortical laminae dictate MEMRI contrast, high-resolution MEMRI of the rodent brain were obtained and compared to conventional tissue histology, as well to histology from tracing intrinsic cortico-cortical and cortico-thalamic projecting neurons. Furthermore, to probe whether lack of lamination leads to no MEMRI contrast in cortex, MEMRI of the reeler mouse, a well studied mutant which lacks normal cortical lamination, was obtained and compared to MEMRI contrast in control wild-type mice. Finally, to test whether tracing of functional neuronal tracts leads to spatial variation in the MEMRI signal, cortex was imaged after Mn2+ injection in the ventroposterior nucleus of thalamus. The results indicate that MEMRI contrast is driven by the spatial variations in cellular density, size, and activity so that MEMRI may thus be used as a highly sensitive in vivo technique for tracking cortical cytoarchitectonics.
Methods
All experiments were carried out in accordance with the National Institutes of Health Guide for the Care and Use of Laboratory Animals, and approved by the NINDS/NIDCD ACUC. The experiments portrayed in the present work consisted of three distinct protocols performed in different cohorts of animals, described below:
Systemic MnCl2 Administration
For systemic infusions of MnCl2, nine adult male Sprague-Dawley rats (175 − 200 g), ten adult female reeler mice (17 − 23 g) and ten age- and sex-matched control mice (25 − 28 g) were utilized. An isotonic solution of MnCl2·4H2O (Sigma-Aldrich, St. Louis, MO) was prepared in distilled water at a concentration of 120 mM, as previously described (Silva, Lee et al., 2004). Twenty-four hours prior to MRI, the animals were anesthetized by breathing 2 % isoflurane into oxygen-enriched air. The rectal temperature was carefully monitored and maintained at 37 °C. For rats, a 27 gauge butterfly needle was carefully inserted in the lateral tail vein and checked for patency. In mice, a 30 gauge needle, connected to PE-10 tubing was utilized. MnCl2 was administered through a tail vein line at a dose of 175 mg/kg (884.3 μmol/kg), which has previously been demonstrated to be well-tolerated by rats (Aoki, Wu et al., 2004) and mice (Lee, Silva et al., 2005) with minimal side-effects. The solution was infused at a rate of 1.8 mL/hr for rats, and 250 μL/hr for mice (Silva, Lee et al., 2004). The animals were recovered by breathing room air and returned to their cage, with free access to food and water. The animals were re-anesthetized 24 hours later and set into an MR-compatible cradle for MRI.
Stereotaxic injections of anatomical tracer into brain and MnCl2 into Ventricle
Three adult male Sprague-Dawley rats (175 − 200 g) were anesthetized with 2% isoflurane. Their heads were carefully secured to a stereotaxic frame (Kopf Instruments), the scalp was removed and the skull exposed. In two animals, a 1 mm drill bit was used to make a small burr hole over the forepaw region of primary somatosensory cortex (S1FL) at 0.0 mm anterior and 3 mm lateral to bregma. Biotin-conjugated dextran amine (BDA, 10% in distilled water), an anterograde neuronal tracer (Brandt and Apkarian, 1992;Veenman, Reiner et al., 1992), was injected under pressure using a 2.5 μL Hamilton microsyringe at approximately 0.05 μL/min into S1FL (2.3 mm ventral to bregma) without any manganese added to the solution.[ACS2] In another animal, 0.5 μL BDA was injected into the orofacial representation of the somatosensory pathway, the VPM nucleus of thalamus (coordinates: −3.1 mm anterior, 3.0 mm lateral, 6.0 mm ventral to bregma (Paxinos and Watson, 1998)). To ensure fast uptake of manganese into the brain following tracer injection, 15 μL of a 30 mM solution of MnCl2 was directly, but slowly infused into the 3rd ventricle (coordinates: −4.2 mm anterior, 0.0 mm lateral, 5.0 mm ventral to bregma (Paxinos and Watson, 1998)) at 15 μL/hr (total infusion time was 1 hour). After injections, all openings in the skull were sealed with bone wax and the scalp was sutured back in place. Isoflurane was discontinued and the animals were given an intramuscular injection of ketoprofen (5 mg/kg) and were carefully monitored during recovery from anesthesia and throughout the survival time. In these animals, MEMRI was performed 3 − 4 days after injection of BDA and MnCl2, to allow BDA, a slow anterograde tracer (Bilgen, Dancause et al., 2005), to travel from the injection site, either in VPM or in S1FL, to the target site in S1FL.[ACS3]
Stereotaxic injections of MnCl2 into Thalamus
Fifteen adult male Sprague-Dawley rats (175 − 200 g) were anesthetized with 2 % isoflurane, orally intubated and mechanically ventilated. Their heads were carefully secured to a stereotaxic frame (Kopf Instruments), the scalp was removed and the skull exposed. A 1 mm drill bit was used to make two small burr holes 3 mm posterior and ± 3 mm lateral to bregma. A 300 μm infusion cannula was lowered 6 mm into the brain, and 200 nL of 10 − 60 mM isotonic MnCl2 solution was delivered into the expected location of the ventroposteromedial (VPM) and ventroposterolateral (VPL) nuclei of thalamus. The infusion cannula was slowly removed and the burr holes were sealed with bone wax. The animals were allowed to recover from the isoflurane anesthesia and returned to their cages. Twelve to sixteen hours following the intra-thalamic injection of MnCl2, the animals were re-anesthetized with isoflurane and set into an MR-compatible cradle for MRI.
MEMRI
All MRI experiments were performed in a horizontal 11.7T/31 cm magnet (Magnex Scientific, Ltd., Oxford, UK), equipped with a 9 cm actively shielded gradient capable of generating 30 G/cm in 80 μs (Resonance Research Inc, Billerica, MA), and interfaced to a Bruker Avance MRI console (Bruker-Biospin, Billerica, MA). Animals were anesthetized under 2% isoflurane mixed in their breathing air, and set in an MR-compatible cradle. Their heads were secured in a custom-made stereotaxic frame consisting of ear pieces and a bite bar. Rectal temperature was monitored and maintained at 37.5 °C by means of a heated water blanket. A standard inversion-recovery, multi-slice T1-weighted spin-echo sequence (TR/TE/TI=4000/7.68/1100 ms, in-plane resolution: 100 × 100 μm2, slice thickness: 1000μm) was used to evaluate contrast and identify regions enhanced by Mn2+. High-resolution 3D-MEMRI, spin-echo T1-weighted (TR/TE=300/8.8 ms, 100 μm isotropic resolution for mice and 200 μm for rats) was used to follow Mn2+ in the somatosensory cortex. T1 maps were obtained using a Look-Locker sequence as previously reported (Chuang and Koretsky, 2006).
Tissue Histology
After the MEMRI scans were performed, the animals were sacrificed and perfused transcardially with phosphate buffered saline wash (pH 7.4), followed by 4% paraformaldehyde fix. The brains were carefully removed from the skull, stored overnight at 4 °C and sent for histological sectioning and processing (American Histo Labs, Gaithersburg, MD). Serial 15 μm[ACS4]-thick coronal slices comprising the area rostral of the posterior commissure (rats: ∼5 mm caudal to bregma; mice: ∼3 mm caudal to bregma) to the middle of the anterior commissure (rats and mice: ∼0 mm caudal to bregma) were stained with hematoxylin-eosin (H&E). The sections were mounted on glass slides and digitized into Tagged Image Format (TIF) files using a calibrated microscope (MZ FL III, Leica, Germany).
For visualizing the location of cortical neurons and associated terminal processes, BDA was injected in three animals as explained above. After MEMRI, these animals were given a lethal dose of halothane and perfused transcardially with PBS (pH 7.4), followed by 4 % paraformaldehyde in PBS, and then followed by the fixative solution with 10% sucrose. Brains were stored in 20% sucrose in PBS overnight before sectioning and then were cut frozen on a cryostat at 40 μm thickness. Alternate series of brain sections were processed for Nissl substance, treated with Avidin-biotin-peroxidase (ABC-kit, Vectastain, Vector, Burlingame, CA) to reveal neurons and associated terminal processes stained by BDA.
BDA reacted sections were viewed under high magnification to identify the location of labeled nerve terminals and neurons. Once the transported label was identified, the laminar position of the transported label was identified in the adjacent Nissl stained sections. Brain sections were imaged by using a digital scanning camera (Hamamatsu, C4742−95) mounted on a Leica microscope (MZ FL III) and scanned with Q-capture v2.68 software (QImaging, Burnaby, Canada). Digital images were adjusted for brightness and contrast using Photoshop Elements v2.0 software (Adobe, San Jose, CA).
Data Analysis
For each animal, MEMRI and histological images were imported into ImageJ (National Institutes of Health). Equivalent MRI and histological slices were chosen by visual inspection using the major outline of the brain and of internal structures such as the corpus callossum, the lateral ventricles, the interpeduncular nucleus and the hippocampus as guiding features. Once a pair of equivalent MRI and histological slices was obtained, MRI intensity profiles across the primary somatosensory (S1) cortex were computed from lines drawn perpendicular to S1 at several locations (minimum of four, but typically ten profiles per cortical hemisphere per animal) as a function of the absolute cortical thickness, measured from the beginning of the pial surface to the border between gray and white matter. The locations of the different cortical laminae were determined in the same cortical area from the corresponding histological sections. For this, the colored H&E images were converted to gray-scale, and intensity profiles were plotted. The locations of the cortical laminae in each slice were determined by recording the cortical depth showing transitions in cell density or shape. To circumvent the effects of tissue shrinkage on the histological slices, the relative position of the cortical layers was computed with respect to the pial surface, as well as the grey-matter to white-matter borders of the cortex, thus providing two independent reference points for the laminar position, and allowing the expression of those distances in proportion to the cortical thickness.
Statistical data analysis was performed using non-parametric uni- and multi-variate analysis of variance (ANOVA) with repeated measures, followed by post-hoc Bonferroni corrections for multiple comparisons. Statistical significance was set at P < 0.05.
Results
Figure 1 shows typical sagittal, horizontal and coronal views from 3-D T1-weighted data sets of a wild-type mouse (Fig. 1A) and of a rat (Fig. 1B), 24 hours following a systemic injection of MnCl2. The manganese-enhanced structures are well visualized in all 3D orientations. Both in mouse as well as in rat, the contrast enhancement of the brain anatomy is evident, and shows details of the neuroarchitecture due to the presence of Mn2+ in many regions of the rodent brain, such as the hippocampus and its sub-regions CA1, CA2, CA3, dentate gyrus (DG) and the fimbria (fi); pituitary gland (Pit); cerebellum (CEB); interpeduncular nucleus (IP); the habenula (Hb); and olfactory bulb (OB), in agreement with previous studies (Watanabe, Natt et al., 2002;Aoki, Wu et al., 2004;Lee, Silva et al., 2005). In the sagittal view, the CEB shows excellent gray-white matter contrast, together with Pit and DG. The horizontal sections show enhancement of periventricular zones, the CA1, CA2, CA3 and fi, the arrowhead of DG, and layers of OB. In the coronal view, the hippocampus is enhanced with clear delineation of the CA3 and the DG regions. The sagittal and horizontal views show enhanced contrast in DG and CA3, but lesser contrast in CA1, in agreement with previous reports (Watanabe, Radulovic et al., 2004;Aoki, Naruse et al., 2004). The Pit is well depicted both on the coronal as well as on the sagittal views, and Mn2+ allows clear separation of the posterior (PPit), intermediate (IPit), and anterior (APit) lobes.
Figure 1.
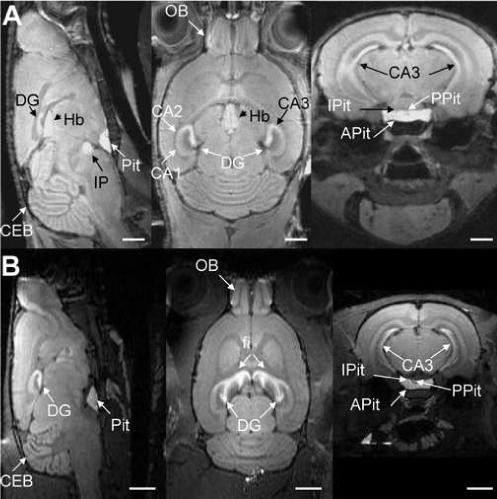
High-resolution (100 × 100 × 100 μm3), T1-weighted 3-D MRI of the rodent brain 24 hours following systemic application of MnCl2. (A) Sagittal (left), horizontal (middle) and coronal (right) views of a mouse brain, showing excellent cyto-architectonic contrast due to the presence of Mn2+ in regions such as the hippocampus (fi, CA3 and DG), habenula (Hb) pituitary gland (Pit) and its major lobes (APit, IPit, PPit), interpeduncular nucleus (IP), cerebellum (CEB) and olfactory bulb (OB). Bars = 2 mm. (B) Corresponding views of a rat brain. Bars = 4 mm.
Figure 2 shows multi-slice T1-weighted MRI along three orthogonal views of the rat brain. Images were acquired at 100 × 100 × 1000 μm3 spatial resolution. As previously reported (Aoki, Wu et al., 2004), enhancement of the cortex 1 day after administration of MnCl2 is quite heterogeneous. In all three views, bright stripes can be observed along the cortex, indicating the higher accumulation of Mn2+ along a laminar pattern running throughout the entire length of the cortex. In control animals that did not receive MnCl2, no evidence of such lamination could be observed (data not shown). Usually two main bright stripes could be seen running along the cortex, as indicated by the arrows in Fig. 2. Interestingly, the thickness and contrast of such stripes varied according to the rostro-caudal and midline-lateral coordinates of the cortex. In the rostro-caudal direction, the stripes were brighter and thinner 3−5 mm caudal to bregma, but thicker yet fainter 1−3 mm rostral to bregma (see panels in Fig. 2A, but also compare two leftmost to two rightmost panels in Fig. 2C). In the midline-lateral direction, the stripes were thinner close to midline and thicker 3−5 mm lateral from midline (Fig. 2C). In the three rightmost panels in Fig. 2C, there was a transition from the thick stripes to the thinner stripes at what seems to be the border between S1 and M1 (dashed lines). This was a consistent finding across all nine rats studied. In addition to the two major bright stripes in the cortex, a third thin stripe of elevated signal intensity could also be observed next to the corpus-callossum, the major white matter track. Detection of this third stripe of contrast was more apparent in the coronal views (Fig.2C, arrowheads) than in the sagittal or the horizontal views.
Figure 2.
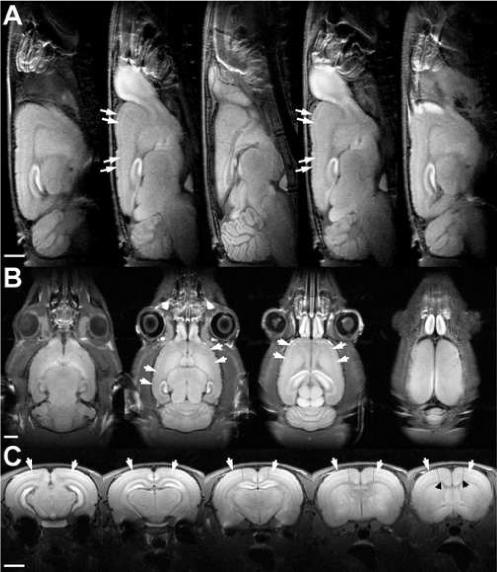
High-resolution (100 × 100 × 1000 μm3), T1-weighted multi-slice MRI of the rat brain, obtained 24 hours following systemic application of MnCl2. (A) Sagittal (B) horizontal and (C) coronal slices show bright stripes oriented along the cortex (arrows), suggesting Mn2+ differentiates cortical cells in a layer-specific manner. In the coronal view, there is a noticeable transition from the thick stripes to the thinner stripes at what seems to be the border between S1 and M1 (dashed lines), as well as a third thin cortical stripe of elevated signal intensity next to the corpus-callossum (arrowheads). Bars = 4 mm.
To establish the anatomical location of the MRI bright stripes with respect to the cortical anatomy, a comparison with tissue histology was performed. The pyramidal cells in layer V of primary somatosensory cortex (S1) were labeled with BDA in a subset of rats, while Mn2+ was injected into the 3rd ventricle. MEMRI images were acquired 3−4 days later. BDA is an anterograde tracer that has been shown to be readily transported over long distances in the brain, allowing a detailed visualization of labeled axons and axonal terminals (Brandt and Apkarian, 1992;Veenman, Reiner et al., 1992). Figure 3 shows the location of BDA-labeled neurons in the orofacial cortex of S1 (Fig. 3A). The injection site is not visible in Fig. 3. The BDA-stained neurons were identified and circled at high magnification (Fig. 3B), and their relative position was overlaid on the corresponding 2D coronal view from a 3D MEMRI image (Fig. 3C). The location of the BDA-labeled neurons that send out cortico-cortical intrinsic, horizontal connections in layer V matched the high MEMRI contrast in the middle of the cortex. An additional experiment was performed in a separate animal, in which the VPM nucleus of thalamus was injected with BDA. Figure 4 shows the results of this experiment. In addition to labeling cell bodies of cortico-thalamic projecting neurons in the bottom of layer V and top of layer VI (Fig. 4B, middle, arrowheads), BDA stained thalamo-cortical terminals in layers III-IV (Fig. 4B, middle, arrow). Comparison of the BDA histological slice (Fig. 4B, middle) with the MEMRI image (Fig. 4B, right) shows that the thalamo-cortical terminals at the border between layers III/IV corresponded to a dark band in the MEMRI image, while the cortico-thalamic projecting neurons at the border between layers V/VI also corresponded to the dark region between the bright middle and bottom stripes in the MEMRI image.
Figure 3.
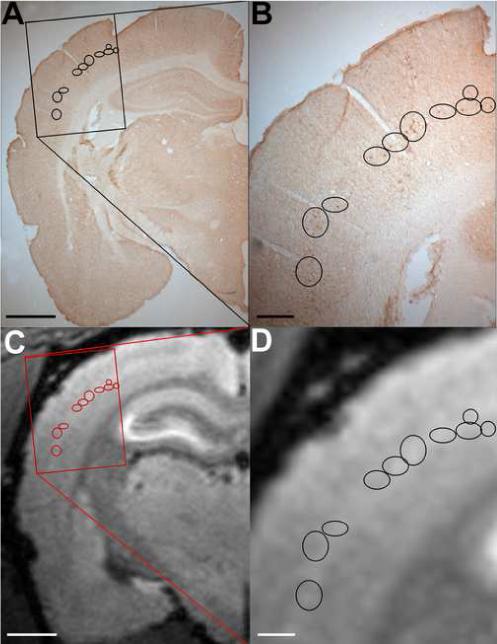
(A) BDA-labeled cortico-thalamic projecting neurons in the orofacial cortex of S1. Bar = 2 mm. (B) The BDA-stained neurons in the rectangular area in (A) were identified and circled at high magnification. Bar = 500 μm. (C) The relative position of the BDA-labeled neurons was overlaid on the corresponding 2D coronal view obtained from a 3D MEMRI image. Bar = 2 mm. (D) Magnification of the rectangular area in (C) showing the correspondence between the location of the BDA-labeled neurons and the higher contrast in MEMRI. Bar = 500 μm.
Figure 4.
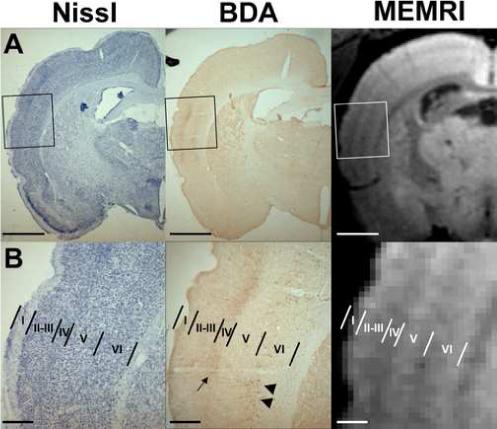
(A) Nissl- and BDA-labeled photomicrographs showing thalamo-cortical terminals and cortico-thalamic projecting neurons in the orofacial cortex of S1. The VPM nucleus of thalamus was injected with BDA. The corresponding MEMRI image is shown on the right. Bars = 2 mm. (B) Insets of the boxed area in (A) shown at higher magnification. The cortical lamination is delineated from the Nissl section (left) and overlaid on the BDA section (middle) as well as on the MEMRI image (right). Comparison of the BDA histological slice (middle) with the MEMRI image (right) shows that the thalamo-cortical terminals (arrow) corresponded to a dark band in the MEMRI image, while the cortico-thalamic projecting neurons (arrowheads) corresponded to the dark region between the bright middle and bottom stripes in the MEMRI image. Bars = 500 μm.
To establish a more formal relationship between the laminated MEMRI contrast and the cortical laminae, H&E slices obtained post-mortem in 9 rats were compared to their corresponding MEMRI after systemic administration of MnCl2, as shown in Fig. 5. Based on H&E histology, the location of the cortical laminae over primary somatosensory cortex (S1) was determined in each animal (Fig. 5A). Line profiles perpendicular to S1 were obtained from corresponding coronal MEMRI (Fig. 5B), and plotted as a function of the absolute cortical depth. Fig.5C shows the average signal intensity profile from MEMRI across the cortex as a function of cortical depth (n=9 rats, 10 profiles per rat). The horizontal axis in Fig. 5C shows the absolute cortical depth measured from the MEMRI. There was little inter-subject variation in cortical thickness. The hatched bars indicate the mean histological location of the cortical laminae, averaged across the different rats. There was a significant effect of the absolute cortical depth on the MEMRI signal intensity in S1 (F[21, 176] = 82.01, P < 0.001). The signal intensity in layer I was significantly lower than in all the other layers (P < 0.001). When data from layer I is removed from the analysis, the MEMRI signal intensity in layers II-VI still varied significantly as a function of the cortical depth (F[19, 160] = 18.924, P < 0.001). The signal intensity profile shows the two major cortical bands of increased contrast are located in layer II (peak cortical depth 300 μm) and in the transition between layers IV and V (peak cortical depth 1100 μm), P < 0.005 versus the other cortical depths. The signal intensity profile also showed a trend towards a third peak at cortical depth 1900 μm corresponding to cortical layer V1b. However, the intensity was not significantly different than that at depth 600 μm or at depth 1500 μm (P > 0.2), possibly because this third peak was narrow (usually only 1 pixel wide). This is consistent with the observation that it could only be qualitatively detected in coronal views.
Figure 5.
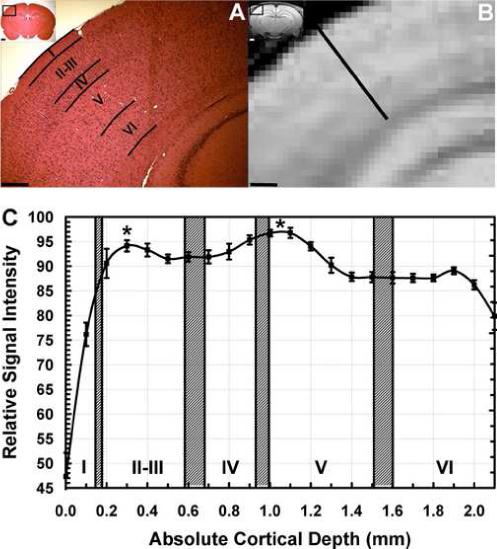
(A) Hematocylin and Eosin histological stain of a coronal slice of a rat brain (inset, inset bar = 1 mm), showing the location of laminae over primary somatosensory cortex. Bar = 500 μm. (B) Corresponding MEMRI of the same animal, showing significant tissue enhancement in the pituitary gland, hippocampus, and cortical laminae. Bar = 500 μm. (C) MEMRI average signal intensity profile across the cortex as a function of the absolute cortical depth for n=9 rats. The hatched bars indicate the histological location of the cortical laminae (Mean Location ± 1 SD). Two major significant Mn2+-enhanced stripes are located in layer II and in the transition between layers IV and V. (* = P < 0.001, error bars = ± 1 SEM).
To provide additional support that Mn2+ is marking cortical laminae, systemic Mn2+ was used for MEMRI in reeler mice (rl/rl), a spontaneous mutant mouse that shows abnormal cortical organization and lamination (Caviness, Jr., 1976). Figure 6 shows coronal T1-weighted images from a reeler mouse (bottom row) and from a control mouse with the same genetic background (top row). Cortical laminae are clearly visible in the control mouse (arrows), but not in the reeler mouse, even though Mn2+ was clearly present in the brain, as seen in the hippocampus and pituitary of the reeler mouse. Figure 7 shows the H&E histology (Fig. 7A) and the MEMRI laminar profile for an individual control mouse (Fig. 7B). Normal cortical lamination is evident in the form of different cellular densities in the H&E histological section, and in the form of alterations in contrast through the cortical depth in the MEMRI image. Figure 7C shows a plot of the mean cortical MEMRI signal intensity profile versus the absolute cortical depth, with hashed bars corresponding to cortical layers as detected by the H&E histological sections. As in the MEMRI profile shown for the rat in Fig. 5C, there was a significant effect of the absolute cortical depth on the MEMRI signal intensity in S1 (F[18, 35] = 17.324, P < 0.001). The signal intensity in layer I was significantly lower than in all the other layers (P < 0.001). When data from layer I is removed from the analysis, the MEMRI signal intensity in layers II-VI still varied significantly as a function of the cortical depth (F[14, 30] = 4.054, P < 0.001), and significant peaks were detected in layers II-III (peak cortical depth 225 μm) and IV-V (peak cortical depths 525 − 675 μm), P < 0.01 versus the other cortical depths. Furthermore, there was a trend to decreased average MRI signal intensity in wild-type mouse cortex during progression from layer II to VI (Fig. 7C), similar to the trend shown for rats in Fig. 5C.
Figure 6.
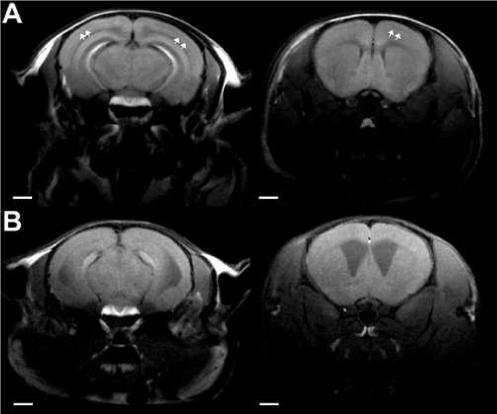
Spin-echo T1-weighted coronal MR images of a control mouse brain (A), and of a reeler mouse brain (B), showing the presence of laminar enhancement in the wild-type brain (arrows), but the absence of cortical laminae in the reeler mouse. Notice the strong uptake of Mn2+ in the pituitary gland in both mice. Bars = 2 mm.
Figure 7.
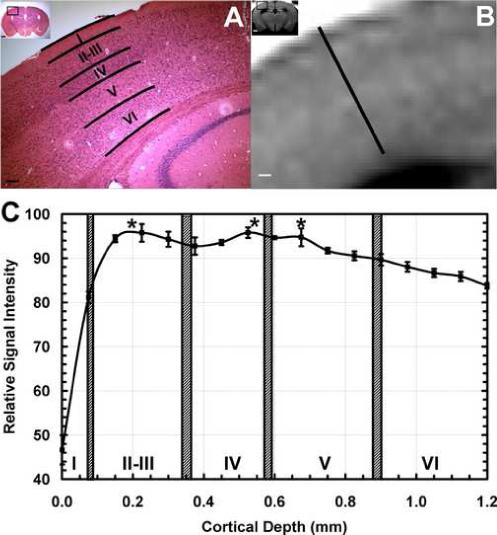
(A) Hematocylin and Eosin histological stain of a coronal slice of a control mouse brain (inset, inset bar = 1 mm), showing the location of laminae over primary somatosensory cortex. Bar = 500 μm. (B) Corresponding MEMRI of the same animal, showing significant tissue enhancement in the hippocampus and cortical laminae. Bar = 500 μm. (C) MEMRI average signal intensity profile across the cortex as a function of cortical depth for n=10 mice. The hatched bars indicate the histological location of the cortical laminae (Mean Location ± 1 SD). Two major significant Mn2+-enhanced stripes are located in layer II and in the transition between layers IV and V. (* = P < 0.001, error bars = ± 1 SEM).
Figure 8 shows data obtained from reeler mice. In the histology (Fig. 8A), the reeler cortex clearly lacks laminar differentiation in cellular density, as it has been well established in this model (Caviness, Jr., 1976;Silva, Gutnick et al., 1991). Accordingly, MEMRI of the reeler mouse showed no contrast in cortex (Fig. 8B). Figure 8C shows a plot of the mean MEMRI signal intensity across S1 of reeler mice as a function of the absolute cortical thickness. Interestingly, the cortical thickness in reeler mice was not different than in the control mice. The overall signal enhancement in the cortex of reeler mice was not statistically different than in the control mice (F[1, 92] = 0.308, P > 0. 58). However, in reeler mice the contrast below 75 μm was flat with no significant peaks or valleys (F[14, 45] = 1.216, P > 0.3, Fig. 8C). This provides strong evidence suggesting the contrast variation in cortical areas is related to laminae-specific differences in cortex of normal rats and mice, because these variations are not present in the abnormally formed cortex of reeler mice. Interestingly, contrary to the plots shown in Figs. 5C and 7C, in reeler mice there was no trend to decreased signal intensity during progression from the pial surface to deep in the cortex (Fig. 8C), and the signal enhancement deep in the cortex of reeler remained elevated as compared to wild-type (F[1, 75] = 8.191, P < 0.005).
Figure 8.
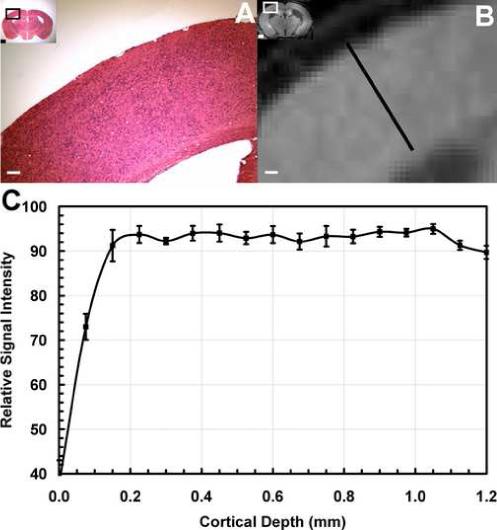
(A) Hematocylin and Eosin histological stain of a coronal slice of a reeler mouse brain (inset, inset bar = 1 mm), showing absence of cortical laminae. Bar = 500 μm. (B) Corresponding MEMRI of the same animal, showing significant tissue enhancement in hippocampus, but not in cortex. Bar = 500 μm. (C) MEMRI average signal intensity profile across the cortex as a function of cortical depth for n=10 mice. No differences in signal intensity were observed across the cortex.
The above results enabled assignment of the contrast detected with systemic injections of MnCl2, and indicate that MEMRI can be used to identify cortical laminae. To test whether neuronal tract tracing with MEMRI also shows specificity with respect to cortical laminae, stereotaxic MnCl2 injections were performed into thalamus. It has been established that the majority of projections from thalamus to somatosensory cortex are into layer IV (Wise and Jones, 1978;Herkenham, 1980). Local application of MnCl2 has been used by a number of groups to trace neuronal networks in a variety of systems (Pautler, Silva et al., 1998;Pautler and Koretsky, 2002;Saleem, Pauls et al., 2002;Van der, Verhoye et al., 2002;Pautler, Mongeau et al., 2003;Murayama, Weber et al., 2006). Thus, it was hypothesized that Mn2+ injected into the ventro-posterior-lateral (VPL) nucleus of thalamus would enhance primarily cortical layer IV. Figure 9A shows consecutive coronal T1-weighted images of a rat that was injected with 200 nL of 60 mM MnCl2 into the left VPL. Enhancement of the thalamo-cortical pathway is clearly visible, in the form of hyper-enhancement of the injection site (thick arrow in left-most panel in Fig. 9A). This enhanced signal slowly dilutes into the corpus callossum and enhances the mid-laminae in somatosensory cortex. Fig. 9B shows the corresponding T1 maps obtained from the same rat. Contrary to the T1-weighted images in Fig. 9A, areas rich in Mn2+ appear dark in the T1 maps due to the shortening of the relaxation time. Cortical enhancement due to the tracing of thalamo-cortical connections by Mn2+ could be better observed in the T1 map images (Fig. 9B, arrows), where a thin band of shortened T1 could be detected at a depth of 600 − 700 μm bellow the pial surface, at the expected anatomical location for lamina IV. In a few animals, tracing to the amygdala were visible as well (data not shown).
Figure 9.
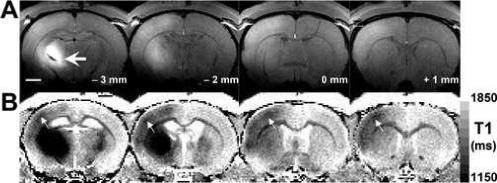
(A) Four consecutive MRI coronal slices of a rat brain (spatial resolution 100 × 100 × 1000 μm3), showing enhancement of the thalamo-cortical pathway in primary somatosensory cortex, following injection of MnCl2 into the ventro-postero-lateral (VPL) nucleus of thalamus. Hyper-enhancement of the injection site (bregma – 3 mm, thick arrow) slowly dilutes into the corpus callossum and enhances the mid laminae in somatosensory cortex. The longitudinal coordinate with respect to bregma is shown in each slice. Bar = 2 mm. (B) Corresponding T1-maps (spatial resolution 200 × 200 × 1000 μm3) show a substantial reduction in the apparent water longitudinal relaxation time due to the presence of Mn2+, and a distinct dark cortical stripe (arrows) located 600−700 μm bellow the pial surface, at the expected anatomical location for lamina IV.
Discussion
There is increasing interest in using MEMRI to analyze anatomy, function, and connectivity in vivo in the brain of a variety of animal models (Lin and Koretsky, 1997;Pautler, Silva et al., 1998;Duong, Silva et al., 2000;Saleem, Pauls et al., 2002;Van der, Verhoye et al., 2002;Aoki, Wu et al., 2004;Lee, Silva et al., 2005;Yu, Wadghiri et al., 2005;Chuang and Koretsky, 2006;Yu, Sanes et al., 2007;Weng, Chen et al., 2007). These experiments rely on the interesting biological properties of manganese to enter excitable cells in an activity dependent manner, to be transported in an anterograde direction along appropriate neural pathways in the brain, and to eventually equilibrate in brain regions in a way that leads to unique anatomical contrast with MRI. The ability to use MEMRI to measure regional activity in the brain, regional connectivity in the brain and a large amount of anatomical information has helped to expand the scope of MRI and established manganese as very useful molecular imaging agent. The major advantages of MEMRI over other MRI techniques aimed at enhancing the brain cytoarchitecture are the improved positive contrast associated with regions of high cellular density and/or high functional activity. However, it is not yet clear to what level of organization in the brain that data from MEMRI will be specific. There is evidence that the activity-dependent properties of MEMRI is specific for major brain areas (Lin and Koretsky, 1997;Duong, Silva et al., 2000;Aoki, Tanaka et al., 2002) and there is preliminary evidence that MEMRI can detect specific columns in rodent sub-cortical and cortical areas (Yu, Wadghiri et al., 2005;Yu, Sanes et al., 2007), as well as specific glomeruli in the olfactory bulb (Chuang, Lee et al., 2006) and layers in the retina (Berkowitz, Roberts et al., 2006).
Recently, it has been demonstrated that systemic MEMRI has specificity for layers in different brain regions. Indeed, layers have been detected with MEMRI in olfactory bulb, hippocampus, cerebellum, retina, and cortex (Watanabe, Natt et al., 2002;Aoki, Wu et al., 2004;Lee, Silva et al., 2005;Berkowitz, Roberts et al., 2006). In most of these regions, it was straightforward to assign contrast to specific layers, by comparing MEMRI contrast to an atlas. Invariably, such comparison has shown that MEMRI contrast follows standard histochemical and anatomical boundaries. However, this was not the case for laminar contrast detected in the rodent cortex. In the present work, contrast variation in the cortex was directly compared to cortical laminae as assigned from the histological markers (Nissl and BDA) used. Our data indicate that the location of the two cortical bands with highest MEMRI signal intensity coincided with mid-layer II and the transition zone from mid-layer IV to mid-layer V. While not statistically significant, there was trend to a third increase in intensity in layer VIb. Thus, at least in somatosensory cortex, there is no direct correspondence between contrast detected from MEMRI and a histochemical definition of cortical layers, indicating the nature of the MEMRI contrast is not fully dictated by cellular density alone. One shortcoming of the comparison was that it was assumed that any anatomical distortion that occurred due to fixation of the brain occurred uniformly throughout the cortex.
It is not clear why the contrast in MRI after systemic application of manganese leads to such interesting anatomical information. In the case of changes in contrast along the cortex this could be due to differences in cell density, differences in activity, or differences in connectivity. All of these factors could affect manganese distribution and all of these vary with cortical depth. Manganese can be transported like – and has affinity for – calcium, iron, and zinc sites (Aschner, 2006;Aschner and Dorman, 2006), which means the manganese distribution may be reporting on the affinity of these ions for different brain regions. Finally, specific manganese transport processes are beginning to be identified which may dictate the distribution found in systemic MEMRI experiments.
Proof that the distribution of contrast in MEMRI across the cortex is dependent on normal cortical architecture comes from the results on reeler mutant mice. Reeler has been well studied and is known to have a disorganized cortical structure (Caviness, Jr., 1976). Indeed there is evidence of inversion of some cell types in the reeler cortex (Caviness, Jr., 1976). Interestingly, the signal enhancement deep in the cortex of reeler remained elevated (Fig. 8C) as compared to wild-type (Fig. 7C), which is consistent with an inversion of the cortical laminae. However, the major feature of the reeler cortex is the lack of well-defined lamination, as can be clearly seen in the histology in Figure 8A. This genetic disorganization of cortical laminar structure was reflected in the MEMRI. In contrast with the intensity profiles shown in rat cortex in Fig. 5C and in wild-type control mice in Fig. 7C, the MEMRI profile in reeler mutants showed no significant peaks in signal intensity (Fig. 8C). The ability of systemic MEMRI to rapidly assess cortical architecture should be useful in analyzing other mouse mutants. Recently, MEMRI applied to the bassoon mouse mutant also detected an increase in contrast deep in cortex, which was related to cortical structural changes in this mouse mutant (Angenstein, Niessen et al., 2006), however, no attempt to assign the contrast to specific layers was made in this mutant.
One drawback of the use of MEMRI to reveal the fine details of the brain cytoarchitecture is that the transport of Mn2+ across the blood-brain barrier is significantly limited compared to transport across the choroid plexus (Murphy, Wadhwani et al., 1991), forcing the use of significantly high doses in order to cause appreciable amounts of Mn2+ to accumulate in the cortex. This raises the concern of toxicity effects (Silva, Lee et al., 2004;Bock and Silva, 2007) that may detract from the usefulness of the technique. Previously, we demonstrated that cortical lamination of the rodent cortex with MEMRI could only be detected at doses of 88 mg/kg, and improved with the doses of 175 mg/kg used in the present work (Lee, Silva et al., 2005), the maximum single dose tested by us thus far (Aoki, Wu et al., 2004;Lee, Silva et al., 2005). We are currently working on alternative ways to deliver Mn2+ systemically to improve contrast in the brain, while minimizing the toxic effects of acute exposure.
The ability of systemic MEMRI to distinguish layers in cortex as well as in olfactory bulb, hippocampus, and cerebellum indicates that MEMRI is likely to be specific to layers as well when used to probe brain activity or to trace neuronal tracts. Preliminary evidence indicates that during the time when manganese is entering olfactory bulb, there is a layer-specific increase in contrast that evolves over time (Lee, Silva et al., 2005). In the present work, tracing from the thalamus to the cortex occurred in a layer-specific and appropriate manner. The majority of connections from thalamus to somatosensory cortex enter in layer IV (Wise and Jones, 1978;Herkenham, 1980). A thin band of contrast in layer IV could be detected at approximately 12−16 hours after stereotaxic injection of manganese into thalamus (Fig. 9). This result, combined with the earlier work in olfactory bulb, indicates tracing of neural connections can be done with laminar specificity as long as care is taken to image at appropriate times during the tracing experiments. We are currently working on optimizing the imaging timing following MnCl2 injections to detect the progressive enhancement of the laminar architecture.
One of the most interesting aspects of using MEMRI to detect cytoarchitecture will be in delineating anatomical boundaries in individual animals to enable studying changes, in vivo and longitudinally, that might occur due to development, learning, and plasticity. Furthermore, it will be important to compare anatomical to functional boundaries in these various models. An important way to distinguish anatomical boundaries using histology is to look for transitions in cortical layer thickness (for a review, see (Jones, 1990)). It is clear from looking at MEMRI images from the rat brain (Fig. 2), that there are transitions in cortical contrast. There is an easily discernible transition between somatosensory cortex and motor cortex, where it is known that there is a shift up in the position of layer V to a more superficial location in the motor cortex due to an increased thickness of layer V (Donoghue and Wise, 1982;Broadmann and Garey, 2005). Precise comparison of the changes in MEMRI contrast in different cortical regions with histology should enable determining which regions can be characterized using MEMRI based laminar cytoarchitecture. As well, systemic MEMRI may be useful in detecting the changes in cytoarchitecture elicited by specific insults to the brain, such as the selective neuronal damage in the fragile CA1 and CA4 regions of hippocampus following resuscitation from cardiac arrest (White, Grossman et al., 1996). We are currently working on developing a rat model of cardiac arrest, in which we will use MEMRI to follow both the morphological and functional changes in hippocampus and cortex in the intact brain in vivo (Aoki, Mori et al., 2004).
In conclusion, variations in contrast through the depth of the rodent cortex after systemic administration of manganese can be assigned to specific cortical layers. Two major peaks in signal intensity occur in somatosensory cortex, which correspond to mid-layer II and the transition between layers IV and V. These variations in contrast are eliminated in the reeler mutant mouse, which is known to have abnormal cortical organization. Finally, specific contrast representing the input from thalamus into layer IV of somatosensory cortex can be detected after stereotaxic injection into thalamus. These results indicate that MEMRI will be specific for cortical laminar cytoarchitecture, making it useful for getting histological information non-invasively in individual animals.
Acknowledgements
The authors would like to acknowledge the skillful technical assistance of Ms. Torri Wilson, and the invaluable comments and advice of Dr. Steve P. Wise. This research was supported by the Intramural Research Program of the NIH, NINDS.
Footnotes
Publisher's Disclaimer: This is a PDF file of an unedited manuscript that has been accepted for publication. As a service to our customers we are providing this early version of the manuscript. The manuscript will undergo copyediting, typesetting, and review of the resulting proof before it is published in its final citable form. Please note that during the production process errors may be discovered which could affect the content, and all legal disclaimers that apply to the journal pertain.
References
- Angenstein F, Niessen HG, Goldschmidt J, Lison H, Altrock WD, Gundelfinger ED, Scheich H. Manganese-Enhanced MRI Reveals Structural and Functional Changes in the Cortex of Bassoon Mutant Mice. Cereb Cortex. 2006 doi: 10.1093/cercor/bhj121. [DOI] [PubMed] [Google Scholar]
- Aoki I, Mori Y, Umeda M, Ebisu T, Fukunaga M, Naruse S, Tanaka C. Detection of neural damage in the hippocampus CA1 region using manganese-enhanced MRI (MEMRI) in a cardiac arrest model; Proceedings of the ISMRM Eleventh Scientific Meeting and Exhibition; Kyoto, Japan. 2004.p. 22. [Google Scholar]
- Aoki I, Naruse S, Tanaka C. Manganese-enhanced magnetic resonance imaging (MEMRI) of brain activity and applications to early detection of brain ischemia. NMR Biomed. 2004;17:569–80. doi: 10.1002/nbm.941. [DOI] [PubMed] [Google Scholar]
- Aoki I, Tanaka C, Takegami T, Ebisu T, Umeda M, Fukunaga M, Fukuda K, Silva AC, Koretsky AP, Naruse S. Dynamic activity-induced manganese-dependent contrast magnetic resonance imaging (DAIM MRI). Magn. Reson. Med. 2002;48:927–33. doi: 10.1002/mrm.10320. [DOI] [PubMed] [Google Scholar]
- Aoki I, Wu YJ, Silva AC, Lynch RM, Koretsky AP. In vivo detection of neuroarchitecture in the rodent brain using manganese-enhanced MRI. Neuroimage. 2004;22:1046–59. doi: 10.1016/j.neuroimage.2004.03.031. [DOI] [PubMed] [Google Scholar]
- Aschner M. The transport of manganese across the blood-brain barrier. Neurotoxicology. 2006;27:311–4. doi: 10.1016/j.neuro.2005.09.002. [DOI] [PubMed] [Google Scholar]
- Aschner M, Dorman DC. Manganese : pharmacokinetics and molecular mechanisms of brain uptake. Toxicol Rev. 2006;25:147–54. doi: 10.2165/00139709-200625030-00002. [DOI] [PubMed] [Google Scholar]
- Barbier EL, Marrett S, Danek A, Vortmeyer A, van Gelderen P, Duyn J, Bandettini P, Grafman J, Koretsky AP. Imaging cortical anatomy by high-resolution MR at 3.0T: detection of the stripe of Gennari in visual area 17. Magn Reson. Med. 2002;48:735–8. doi: 10.1002/mrm.10255. [DOI] [PubMed] [Google Scholar]
- Belliveau JW, Kennedy DN,, Jr., McKinstry RC, Buchbinder BR, Weisskoff RM, Cohen MS, Vevea JM, Brady TJ, Rosen BR. Functional mapping of the human visual cortex by magnetic resonance imaging. Science. 1991;254:716–9. doi: 10.1126/science.1948051. [DOI] [PubMed] [Google Scholar]
- Berkowitz BA, Roberts R, Goebel DJ, Luan H. Noninvasive and simultaneous imaging of layer-specific retinal functional adaptation by manganese-enhanced MRI. Invest Ophthalmol. Vis. Sci. 2006;47:2668–74. doi: 10.1167/iovs.05-1588. [DOI] [PubMed] [Google Scholar]
- Bilgen M, Dancause N, Al-Hafez B, He YY, Malone TM. Manganese-enhanced MRI of rat spinal cord injury. Magn Reson Imaging. 2005;23:829–32. doi: 10.1016/j.mri.2005.06.004. [DOI] [PubMed] [Google Scholar]
- Bock NA, Silva AC. Manganese: a unique neuroimaging contrast agent. Future Neurology. 2007;2:297–395. [Google Scholar]
- Brandt HM, Apkarian AV. Biotin-dextran: a sensitive anterograde tracer for neuroanatomic studies in rat and monkey. J Neurosci Methods. 1992;45:35–40. doi: 10.1016/0165-0270(92)90041-b. [DOI] [PubMed] [Google Scholar]
- Broadmann K, Garey L. 3 ed. Imperial College Press; London: 2005. Localisation in the cerebral cortex; p. 298. [Google Scholar]
- Caviness VS,, Jr. Patterns of cell and fiber distribution in the neocortex of the reeler mutant mouse. J Comp Neurol. 1976;170:435–47. doi: 10.1002/cne.901700404. [DOI] [PubMed] [Google Scholar]
- Cheng K, Waggoner RA, Tanaka K. Human ocular dominance columns as revealed by high-field functional magnetic resonance imaging. Neuron. 2001;32:359–74. doi: 10.1016/s0896-6273(01)00477-9. [DOI] [PubMed] [Google Scholar]
- Chuang KH, Koretsky A. Improved neuronal tract tracing using manganese enhanced magnetic resonance imaging with fast T(1) mapping. Magn Reson Med. 2006;55:604–11. doi: 10.1002/mrm.20797. [DOI] [PubMed] [Google Scholar]
- Chuang KH, Lee JH, Silva AC, Belluscio L, Koretsky AP. Using Manganese-Enhanced MRI to reveal active olfactory circuitry in response to odorant stimuli; Proceedings of the ISMRM Fourteenth Scientific Meeting and Exhibition; Seattle, WA. 5−9−2006.p. 228. [Google Scholar]
- Donoghue JP, Wise SP. The motor cortex of the rat: cytoarchitecture and microstimulation mapping. J Comp Neurol. 1982;212:76–88. doi: 10.1002/cne.902120106. [DOI] [PubMed] [Google Scholar]
- Duong TQ, Silva AC, Lee SP, Kim SG. Functional MRI of calcium-dependent synaptic activity: cross correlation with CBF and BOLD measurements. Magn. Reson. Med. 2000;43:383–92. doi: 10.1002/(sici)1522-2594(200003)43:3<383::aid-mrm10>3.0.co;2-q. [DOI] [PubMed] [Google Scholar]
- Goodyear BG, Menon RS. Brief visual stimulation allows mapping of ocular dominance in visual cortex using fMRI. Hum Brain Mapp. 2001;14:210–7. doi: 10.1002/hbm.1053. [DOI] [PMC free article] [PubMed] [Google Scholar]
- Herkenham M. Laminar organization of thalamic projections to the rat neocortex. Science. 1980;207:532–5. doi: 10.1126/science.7352263. [DOI] [PubMed] [Google Scholar]
- Hinke RM, Hu X, Stillman AE, Kim SG, Merkle H, Salmi R, Ugurbil K. Functional magnetic resonance imaging of Broca's area during internal speech. Neuroreport. 1993;4:675–8. doi: 10.1097/00001756-199306000-00018. [DOI] [PubMed] [Google Scholar]
- Jones EG. Determinants of the cytoarchitecture of the cerebral cortex. In: Edelman GM, Gall WE, Cowan WM, editors. NSI Symposium - signal and sense. Wiley-Liss, Inc.; New York: 1990. pp. 43–9. [Google Scholar]
- Kida I, Xu F, Shulman RG, Hyder F. Mapping at glomerular resolution: fMRI of rat olfactory bulb. Magn Reson. Med. 2002;48:570–6. doi: 10.1002/mrm.10248. [DOI] [PubMed] [Google Scholar]
- Kim DS, Duong TQ, Kim SG. Reply to “Can current fMRI techniques reveal the micro-architecture of cortex?”. Nat. Neurosci. 2000;3:414. doi: 10.1038/74771. [DOI] [PubMed] [Google Scholar]
- Kim SG, Ashe J, Hendrich K, Ellermann JM, Merkle H, Ugurbil K, Georgopoulos AP. Functional magnetic resonance imaging of motor cortex: hemispheric asymmetry and handedness. Science. 1993;261:615–7. doi: 10.1126/science.8342027. [DOI] [PubMed] [Google Scholar]
- Kurth R, Villringer K, Curio G, Wolf KJ, Krause T, Repenthin J, Schwiemann J, Deuchert M, Villringer A. fMRI shows multiple somatotopic digit representations in human primary somatosensory cortex. Neuroreport. 2000;11:1487–91. [PubMed] [Google Scholar]
- Lee JH, Koretsky AP. Manganese enhanced magnetic resonance imaging. Curr. Pharm. Biotechnol. 2004;5:529–37. doi: 10.2174/1389201043376607. [DOI] [PubMed] [Google Scholar]
- Lee JH, Silva AC, Merkle H, Koretsky AP. Manganese-enhanced magnetic resonance imaging of mouse brain after systemic administration of MnCl2: dose-dependent and temporal evolution of T1 contrast. Magn Reson. Med. 2005;53:640–8. doi: 10.1002/mrm.20368. [DOI] [PubMed] [Google Scholar]
- Lin YJ, Koretsky AP. Manganese ion enhances T1-weighted MRI during brain activation: an approach to direct imaging of brain function. Magn Reson. Med. 1997;38:378–88. doi: 10.1002/mrm.1910380305. [DOI] [PubMed] [Google Scholar]
- Murayama Y, Weber B, Saleem KS, Augath M, Logothetis NK. Tracing neural circuits in vivo with Mn-enhanced MRI. Magn Reson Imaging. 2006;24:349–58. doi: 10.1016/j.mri.2005.12.031. [DOI] [PubMed] [Google Scholar]
- Murphy VA, Wadhwani KC, Smith QR, Rapoport SI. Saturable transport of manganese(II) across the rat blood-brain barrier. J. Neurochem. 1991;57:948–54. doi: 10.1111/j.1471-4159.1991.tb08242.x. [DOI] [PubMed] [Google Scholar]
- Natt O, Watanabe T, Boretius S, Radulovic J, Frahm J, Michaelis T. High-resolution 3D MRI of mouse brain reveals small cerebral structures in vivo. J. Neurosci. Methods. 2002;120:203–9. doi: 10.1016/s0165-0270(02)00211-x. [DOI] [PubMed] [Google Scholar]
- Pautler RG. Biological applications of manganese-enhanced magnetic resonance imaging. Methods Mol Med. 2006;124:365–86. doi: 10.1385/1-59745-010-3:365. [DOI] [PubMed] [Google Scholar]
- Pautler RG, Koretsky AP. Tracing odor-induced activation in the olfactory bulbs of mice using manganese-enhanced magnetic resonance imaging. Neuroimage. 2002;16:441–8. doi: 10.1006/nimg.2002.1075. [DOI] [PubMed] [Google Scholar]
- Pautler RG, Mongeau R, Jacobs RE. In vivo trans-synaptic tract tracing from the murine striatum and amygdala utilizing manganese enhanced MRI (MEMRI). Magn Reson. Med. 2003;50:33–9. doi: 10.1002/mrm.10498. [DOI] [PubMed] [Google Scholar]
- Pautler RG, Silva AC, Koretsky AP. In vivo neuronal tract tracing using manganese-enhanced magnetic resonance imaging. Magn. Reson. Med. 1998;40:740–8. doi: 10.1002/mrm.1910400515. [DOI] [PubMed] [Google Scholar]
- Paxinos G, Watson C. The rat brain in stereotaxic coordinates. Fourth Edition ed. Academic Press; San Diego, CA: 1998. pp. ix–117. [Google Scholar]
- Rao SM, Binder JR, Bandettini PA, Hammeke TA, Yetkin FZ, Jesmanowicz A, Lisk LM, Morris GL, Mueller WM, Estkowski LD. Functional magnetic resonance imaging of complex human movements. Neurology. 1993;43:2311–8. doi: 10.1212/wnl.43.11.2311. [DOI] [PubMed] [Google Scholar]
- Rueckert L, Appollonio I, Grafman J, Jezzard P, Johnson R,, Jr., Le Bihan D, Turner R. Magnetic resonance imaging functional activation of left frontal cortex during covert word production. J Neuroimaging. 1994;4:67–70. doi: 10.1111/jon19944267. [DOI] [PubMed] [Google Scholar]
- Saleem KS, Pauls JM, Augath M, Trinath T, Prause BA, Hashikawa T, Logothetis NK. Magnetic resonance imaging of neuronal connections in the macaque monkey. Neuron. 2002;34:685–700. doi: 10.1016/s0896-6273(02)00718-3. [DOI] [PubMed] [Google Scholar]
- Silva AC, Koretsky AP. Laminar specificity of functional MRI onset times during somatosensory stimulation in rat. Proc. Natl. Acad. Sci. U. S. A. 2002;99:15182–7. doi: 10.1073/pnas.222561899. [DOI] [PMC free article] [PubMed] [Google Scholar]
- Silva AC, Lee JH, Aoki I, Koretsky AP. Manganese-enhanced magnetic resonance imaging (MEMRI): methodological and practical considerations. NMR Biomed. 2004;17:532–43. doi: 10.1002/nbm.945. [DOI] [PubMed] [Google Scholar]
- Silva LR, Gutnick MJ, Connors BW. Laminar distribution of neuronal membrane properties in neocortex of normal and reeler mouse. J Neurophysiol. 1991 Dec;66(6):2034–40. doi: 10.1152/jn.1991.66.6.2034. 1991; 66. [DOI] [PubMed] [Google Scholar]
- Van der LA, Verhoye M, Van M, V, Tindemans I, Eens M, Absil P, Balthazart J. In vivo manganese-enhanced magnetic resonance imaging reveals connections and functional properties of the songbird vocal control system. Neuroscience. 2002;112:467–74. doi: 10.1016/s0306-4522(02)00070-2. [DOI] [PubMed] [Google Scholar]
- Veenman CL, Reiner A, Honig MG. Biotinylated dextran amine as an anterograde tracer for single- and double-labeling studies. J Neurosci Methods. 1992;41:239–54. doi: 10.1016/0165-0270(92)90089-v. [DOI] [PubMed] [Google Scholar]
- Wadghiri YZ, Blind JA, Duan X, Moreno C, Yu X, Joyner AL, Turnbull DH. Manganese-enhanced magnetic resonance imaging (MEMRI) of mouse brain development. NMR Biomed. 2004;17:613–9. doi: 10.1002/nbm.932. [DOI] [PubMed] [Google Scholar]
- Walters NB, Egan GF, Kril JJ, Kean M, Waley P, Jenkinson M, Watson JD. In vivo identification of human cortical areas using high-resolution MRI: an approach to cerebral structure-function correlation. Proc. Natl. Acad. Sci. U. S. A. 2003;100:2981–6. doi: 10.1073/pnas.0437896100. [DOI] [PMC free article] [PubMed] [Google Scholar]
- Watanabe T, Frahm J, Michaelis T. Functional mapping of neural pathways in rodent brain in vivo using manganese-enhanced three-dimensional magnetic resonance imaging. NMR Biomed. 2004;17:554–68. doi: 10.1002/nbm.937. [DOI] [PubMed] [Google Scholar]
- Watanabe T, Natt O, Boretius S, Frahm J, Michaelis T. In vivo 3D MRI staining of mouse brain after subcutaneous application of MnCl2. Magn Reson. Med. 2002;48:852–9. doi: 10.1002/mrm.10276. [DOI] [PubMed] [Google Scholar]
- Watanabe T, Radulovic J, Spiess J, Natt O, Boretius S, Frahm J, Michaelis T. In vivo 3D MRI staining of the mouse hippocampal system using intracerebral injection of MnCl2. Neuroimage. 2004;22:860–7. doi: 10.1016/j.neuroimage.2004.01.028. [DOI] [PubMed] [Google Scholar]
- Weng JC, Chen JH, Yang PF, Tseng WY. Functional mapping of rat barrel activation following whisker stimulation using activity-induced manganese-dependent contrast. Neuroimage. 2007;36:1179–88. doi: 10.1016/j.neuroimage.2007.04.010. [DOI] [PubMed] [Google Scholar]
- White BC, Grossman LI, O'Neil BJ, DeGracia DJ, Neumar RW, Rafols JA, Krause GS. Global brain ischemia and reperfusion. Ann Emerg Med. 1996;27:588–94. doi: 10.1016/s0196-0644(96)70161-0. [DOI] [PubMed] [Google Scholar]
- Wiegell MR, Tuch DS, Larsson HB, Wedeen VJ. Automatic segmentation of thalamic nuclei from diffusion tensor magnetic resonance imaging. Neuroimage. 2003;19:391–401. doi: 10.1016/s1053-8119(03)00044-2. [DOI] [PubMed] [Google Scholar]
- Wise SP, Jones EG. Developmental studies of thalamocortical and commissural connections in the rat somatic sensory cortex. J Comp Neurol. 1978 Mar 15;178(2):187–208. doi: 10.1002/cne.901780202. 187-, 1978; 178. [DOI] [PubMed] [Google Scholar]
- Yang X, Hyder F, Shulman RG. Activation of single whisker barrel in rat brain localized by functional magnetic resonance imaging. Proc. Natl. Acad. Sci. U. S. A. 1996;93:475–8. doi: 10.1073/pnas.93.1.475. [DOI] [PMC free article] [PubMed] [Google Scholar]
- Yu X, Sanes DH, Aristizabal O, Wadghiri YZ, Turnbull DH. Large-scale reorganization of the tonotopic map in mouse auditory midbrain revealed by MRI. Proc Natl Acad Sci U S A. 2007 doi: 10.1073/pnas.0700960104. [DOI] [PMC free article] [PubMed] [Google Scholar]
- Yu X, Wadghiri YZ, Sanes DH, Turnbull DH. In vivo auditory brain mapping in mice with Mn-enhanced MRI. Nat. Neurosci. 2005;8:961–8. doi: 10.1038/nn1477. [DOI] [PMC free article] [PubMed] [Google Scholar]