Tremendous fundamental advances over the past decade have led to dramatic improvements in the performance of ion-selective electrodes (ISEs).1 In particular, new insights into the principles dictating the limits of detection (LODs) of such potentiometric sensors have led to ISEs capable of convenient measurements down to the subnanomolar (parts per trillion) level.2 Recent efforts have also demonstrated that potentiometric sensors with low LODs can be miniaturized to allow trace (subfemtomole) measurements in very small (microliter) sample volumes.3 Such major improvements in the performance of ISEs have facilitated new applications for which potentiometric sensors have not been used traditionally. For example, recent progress in our laboratories has led to highly sensitive immunoassays of proteins based on different ISE transducers.4
Here, we demonstrate for the first time the use of potentiometric microsensors for monitoring DNA hybridization. The detection of sequence-specific DNA is of central importance in the diagnosis and treatment of genetic diseases, detection of infectious agents, drug screening, and in forensic science.5 Various approaches have been successfully used to detect sequence-selective DNA hybridization, including optical,6 electrochemical,7 and piezoelectric methods.8 Electrochemical methods for detecting DNA hybridization have received considerable attention because of their high sensitivity, portability, low cost, minimal power requirement, and/or independence of sample turbidity or optical pathway.9 Various amperometric and voltammetric detection strategies10 have been used for transducing electronically DNA hybridization events based on oligonucleotide-bearing enzyme tags,11 redox tracers,12 or nanoparticle labels (i.e., gold nanoparticles, silver tags, and semiconductor nanocrystals).13
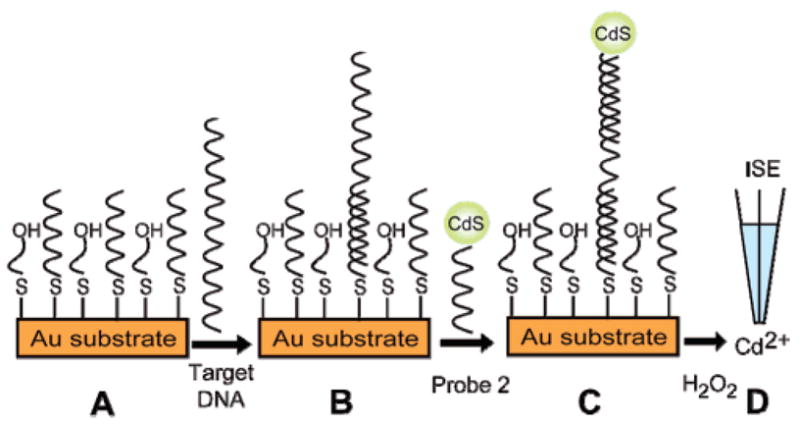
The new potentiometric nucleic acid measurements rely on a sandwich DNA hybridization for capturing a secondary oligonucleotide bearing CdS-nanocrystal tags. As illustrated in Scheme 1, the target DNA (60-mer) is hybridized (B) to the surface-anchored thiolated DNA probe (20-mer) on the gold substrate (A), followed by the capture of the secondary DNA probe (26-mer) conjugated to the CdS label (C). The nanocrystal is then dissolved in H2O2 to yield a dilute electrolyte background solution suitable for the potentiometric detection of the released Cd2+ with a polymer membrane Cd2+-selective microelectrode (D).
Scheme 1.

Steps Involved in the Nanoparticle-Based Potentiometric Detection of DNA Hybridizationa
a (A) Formation of a mixed monolayer of DNA probe on gold substrate; (B) hybridization with target DNA; (C) second hybridization with CdS-labeled probe; (D) dissolution of the CdS tag, followed by detection using a Cd2+-selective electrode.
The assay was based on a recently developed miniaturized solid-contact Cd-ISE showing a lower LOD of 10−10 and 10−9 M Cd2+ in samples of 100 mL and 200 μL (microwell plates), respectively.14 It exhibits excellent selectivity for the relevant ions, with logarithmic selectivity coefficients of −7.04 (Ca2+), −3.88 (H+), and −4.59 (Na+). A miniaturized liquid-contact Ca-ISE was used as a pseudoreference electrode.14
The key parameters of the DNA sandwich hybridization assay were optimized as follows (cf. Supporting Information): The optimal concentration of the primary and secondary (CdS-nanocrystal-labeled) DNA probe was each 1 μM, and the optimal time for both hybridization steps (cf. Scheme 1) was 60 min.
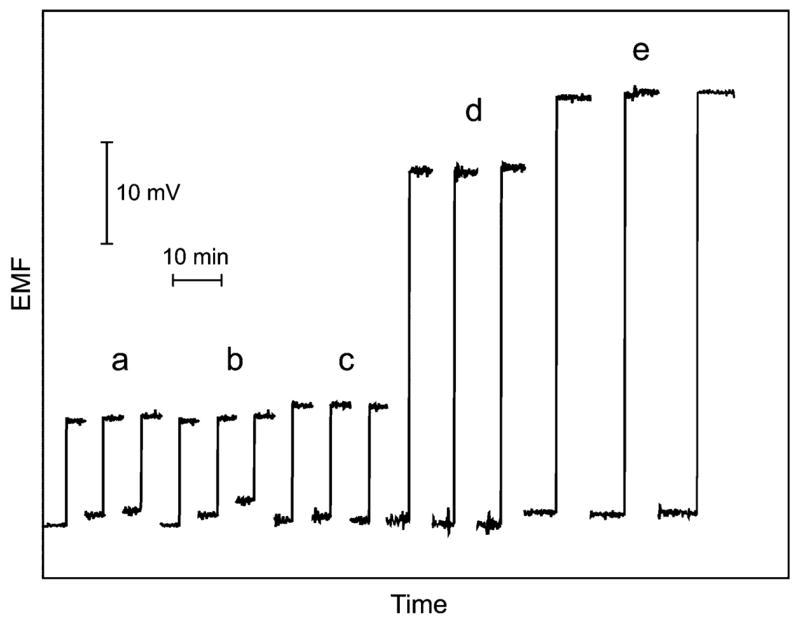
The high selectivity of the new DNA detection is illustrated in Figure 1 displaying the potentiometric responses of the Cd2+-selective microelectrode to (a) control solution (zero target), (b) 500 nM of a noncomplementary DNA, (c) 500 μM of 2-base mismatch DNA, and to two significantly lower levels of the target DNA of (d) 10 nM and (e) 100 nM. The responses to the noncomplementary and the 2-base mismatch DNA are similar to those obtained with the control solution. Larger signals are observed for significantly lower (nanomolar) concentrations of the target DNA. Notice in particular the effective discrimination against the large excess (500 nM) of mismatch DNA (c) vs 10 nM target DNA (d). Such behavior confirms the good selectivity of the hybridization assay. Considering the logarithmic response of the Cd-ISE, the potential differences correspond to 2.8 nM for the 500 nM 2-base mismatch DNA (c) and 21 nM Cd2+ for the 10 nM target DNA (d), that is, to a ~8-fold lower amount of captured tags for a 50-fold excess of the 2-base mismatch DNA.
Figure 1.

Potentiometric responses of the Cd2+-selective electrode to: (a) control solution (10−4 M CaCl2, zero target), (b) 500 nM noncomplementary DNA, (c) 500 nM 2-base mismatch DNA, (d) 10 nM target DNA, and (e) 100 nM target DNA (as complementary targets) after DNA hybridization. Potentiometric measurements were performed in 200 μL of solutions with 10−4 M CaCl2 as background (shown as baseline traces) with a Ca-ISE as pseudoreference electrode.
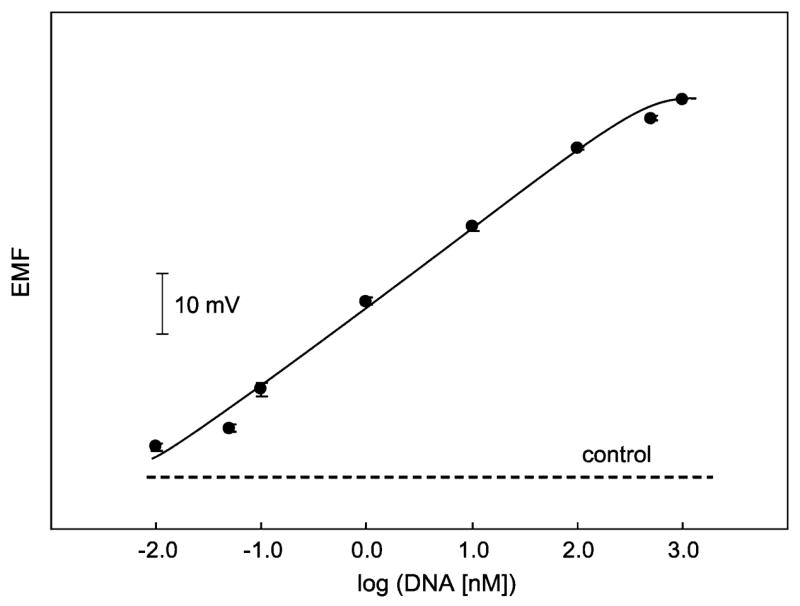
The quantitative aspects are documented by a calibration experiment over a concentration range of 0.01–1000 nM target DNA. The resulting calibration plot in Figure 2 exhibits a well-defined concentration dependence suitable for DNA analysis, with a wide dynamic range of 0.01–300 nM target DNA. The EMF at the lowest measured concentration of 10 pM was 2.96 mV above that of the control, and the standard deviation of the noise of the control was 0.17 mV (N = 13, 1 min). Thus, the lower LOD is 10 pM or 37 pg (2 fmol) of the target DNA in the 200 μL sample. These values compare favorably with those reported for other electrochemical DNA hybridization assays using similar nanoparticle labels.13a,b
Figure 2.

Calibration plot for the potentiometric monitoring of DNA with a sandwich array based on CdS quantum dot tags in 200-μL microwells (error bars: SD, N = 3). The dashed line corresponds to control signal (no target). Other conditions as in Figure 1.
In conclusion, we have demonstrated for the first time the use of potentiometric transducers for detecting DNA hybridization. The use of Cd2+-selective microelectrodes is particularly useful for a microplate operation in connection with CdS nanocrystal tags. The extremely high sensitivity and fmol detection limit of the micro-electrode are coupled with a high selectivity of the bioassay, including effective discrimination against 2-base mismatched DNA. Note that the low detection limit was reached without a preconcentration step commonly used in other electrochemical transduction schemes. The new potentiometric detection route can be extended to a wide range of genetic tests in connection with different nanoparticle tags.
Supplementary Material
Acknowledgments
This work was supported by the grants from the National Institutes of Health (Grants R01 EB002189 and R01 1056047). A.N. acknowledges The Royal Golden Jubilee PhD Program (Thailand Research Fund). We thank Dr. D. Wegmann for careful reading of the manuscript.
Footnotes
Supporting Information Available: Optimization of the DNA sandwich hybridization assay, experimental details, instrumentation, and reagents. This material is available free of charge via the Internet at http://pubs.acs.org.
References
- 1.Pretsch E. Trends Anal Chem. 2007;26:46–51. [Google Scholar]
- 2.Ceresa A, Radu A, Bakker E, Pretsch E. Anal Chem. 2002;74:4027–4036. doi: 10.1021/ac025548y. [DOI] [PubMed] [Google Scholar]
- 3.(a) Rubinova N, Chumbimuni-Torres K, Bakker E. Sens Actuators B. 2007;121:135–141. doi: 10.1016/j.snb.2006.09.007. [DOI] [PMC free article] [PubMed] [Google Scholar]; (b) Malon A, Vigassy T, Bakker E, Pretsch E. J Am Chem Soc. 2006;128:8154–8155. doi: 10.1021/ja0625780. [DOI] [PMC free article] [PubMed] [Google Scholar]
- 4.(a) Chumbimuni-Torres KY, Dai Z, Rubinova N, Xiang Y, Pretsch E, Wang J, Bakker E. J Am Chem Soc. 2006;128:13676–13677. doi: 10.1021/ja065899k. [DOI] [PMC free article] [PubMed] [Google Scholar]; (b) Thürer R, Vigassy T, Hirayama M, Wang J, Bakker E, Pretsch E. Anal Chem. 2007;79:5107–5110. doi: 10.1021/ac070932m. [DOI] [PubMed] [Google Scholar]
- 5.(a) Millan KM, Mikkelsen SR. Anal Chem. 1993;65:2317–2323. doi: 10.1021/ac00065a025. [DOI] [PubMed] [Google Scholar]; (b) Pinar K, Burcu M, Aysin Z, Mehmet O. Anal Chim Acta. 2004;518:69–76. [Google Scholar]; (c) Ohmichi T, Kawamoto Y, Wu P, Miyoshi D, Karimata H, Sugimoto N. Biochemistry. 2005;44:7125–7130. doi: 10.1021/bi0476782. [DOI] [PubMed] [Google Scholar]
- 6.Taton TA, Mirkin CA, Litsinger RL. Science. 2000;289:1757–1760. doi: 10.1126/science.289.5485.1757. [DOI] [PubMed] [Google Scholar]
- 7.Wang J. Anal Chim Acta. 2003;500:247–257. [Google Scholar]
- 8.Wu VCH, Chen SH, Lin CS. Biosens Bioelectron. 2007;22:2967–2975. doi: 10.1016/j.bios.2006.12.016. [DOI] [PubMed] [Google Scholar]
- 9.(a) Wang J. Anal Chim Acta. 2002;496:63–71. [Google Scholar]; (b) Wang J, Liu G, Mercoçi A. J Am Chem Soc. 2003;125:3214–3215. doi: 10.1021/ja029668z. [DOI] [PubMed] [Google Scholar]; (c) Hansen JA, Mukhopadhyay R, Hansen JO, Gothelf KV. J Am Chem Soc. 2006;128:3860–3861. doi: 10.1021/ja0574116. [DOI] [PubMed] [Google Scholar]
- 10.Wang J. Stripping Analysis. VCH; New York: 1985. [Google Scholar]
- 11.(a) Kim E, Kim K, Yang H, Kim YT, Kwak J. Anal Chem. 2003;75:5665–5672. doi: 10.1021/ac034253x. [DOI] [PubMed] [Google Scholar]; (b) Alfonta L, Singh AK, Willner I. Anal Chem. 2001;73:91–102. doi: 10.1021/ac000819v. [DOI] [PubMed] [Google Scholar]
- 12.Ihara T, Nakayama M, Murata M, Nakano K, Maeda M. Chem Commun. 1997:1609–1610. [Google Scholar]
- 13.(a) Wang J, Liu G, Polsky R, Merkoçi A. Electrochem Commun. 2002;4:722–726. [Google Scholar]; (b) Kawde AN, Wang J. Electroanalysis. 2004;16:101–107. [Google Scholar]; (c) Wang J, Rincón O, Polsky R, Dominguez E. Electrochem Commun. 2003;5:83–86. [Google Scholar]
- 14.Numnuam A, Chumbimuni-Torres KY, Xiang Y, Bash R, Thavarungkul P, Kanatharana P, Pretsch E, Wang J, Bakker E. Anal Chem. doi: 10.1021/ac701910r. in press. [DOI] [PMC free article] [PubMed] [Google Scholar]
Associated Data
This section collects any data citations, data availability statements, or supplementary materials included in this article.


