Abstract
Recent functional studies reported on human adult hemoglobin (HbA) show that heterotropic effector-linked tertiary structural changes are primarily responsible for modulating the oxygen affinity of hemoglobin. We present the results of 6-ns molecular dynamics simulations performed to gain insights into the dynamical and structural details of these effector-linked tertiary changes. All-atom simulations were carried out on a series of models generated for T- and R-state HbA, and for 2,3-diphosphoglycerate-bound models. Cross-correlation analyses identify both intra- and intersubunit correlated motions that are perturbed by the presence of the effector. Principal components analysis was used to decompose the covariance matrix extracted from the simulations and reconstruct the trajectories along the principal coordinates representative of functionally important collective motions. It is found that HbA in both quaternary states exists as ensembles of tertiary conformations that introduce dynamic heterogeneity in the protein. 2,3-Diphosphoglycerate induces significant perturbations in the fluctuations of both HbA states that translate into the protein visiting different tertiary conformations within each quaternary state. The analysis reveals that the presence of the effector affects the most important components of HbA motions and that heterotropic effectors modify the overall dynamics of the quaternary equilibrium via tertiary changes occurring in regions where conserved functionally significant residues are located, namely in the loop regions between helices C and E, E and F, and F and G, and in concerted helix motions. The changes are not apparent when comparing the available x-ray crystal structures in the presence and absence of effector, but are striking when comparing the respective dynamic tertiary conformations of the R and T tetramers.
INTRODUCTION
In recent years, several human adult hemoglobin (HbA) functional studies have shown that allosteric effectors such as 2,3-diphosphoglycerate (DPG), inositol hexaphosphate, bezafibrate, and other synthetic effectors not only shift the quaternary equilibrium but also affect tertiary structure-linked functional properties (1–8). As a result, the classical Monod-Wyman-Changeux model (9), as formulated by Szabo and Karplus to incorporate the Perutz stereochemical mechanism (10–12), and which did not account for the role of heterotropic effectors, was recently reformulated as the global allostery model (8), the premise of which states that heterotropic effector-linked tertiary changes—rather than the homotropic ligation-linked T/R quaternary structural transition—are primarily responsible for modulating HbA function. The importance of tertiary changes was revealed by earlier time-resolved spectroscopy studies investigating HbA intermediates generated by photodissociation of Hb-CO and showing that purely tertiary relaxations could be observed (13–15). Adachi and co-workers reported photolysis-induced tertiary structural changes involving the heme and the F-helix after CO dissociation and used x-ray crystallography to trap photoproducts at cryogenic temperatures (16), but to date, to the best of our knowledge, there have been no investigations of the effect of allosteric effectors. However, recent sol-gel encapsulation experiments—used to maintain and stabilize deoxy HbA in either the T or R state—have demonstrated clear-cut monitoring of nitrite reductase activity as a function of the quaternary state with and without effectors. The results were unambiguous, showing that the reaction is not only R-T dependent, but also heterotropic-effector-dependent within a given quaternary state (17,18).
The experimental studies, however, remain elusive as to the molecular details of the tertiary changes resulting from the presence of effectors, since they cannot follow specific atomic motions in time. Attempts to relate the results of functional studies to the available HbA 3D structures have a long history, since they provided the structural basis of the Monod-Wyman-Changeux-Perutz model (19), but they are limited: the static viewpoint may be misleading, since a conformational change determined from x-ray crystallography provides information on the state of the protein before and after ligand binding, but not on the dynamics of the transition (20). Further, recent studies also show that function and dynamics are significantly affected by the crystal environment. For instance, the HbA oxygen affinity is lower in a crystal than in solution, with noncooperative binding and no Bohr effect (21). As for HbA effector-binding crystallographic studies, the only x-ray structure available for DPG, the 2.5-Å resolution structure of deoxyHbA bound to DPG (22), shows no significant structural changes resulting from the binding of the effector, with a similar result reported more recently for deoxyHbA bound to the synthetic effector L35 (23). Clearly, this absence of significant crystallographic structural differences implies a significant contribution from conformational dynamics. Time-resolved crystallography (24), recently used to study the conformational dynamics of myoglobin (Mb) (25,26), definitely represents a more promising approach, but remains to be applied to tetrameric HbA, extremely difficult to crystallize in the presence of effectors, especially in the R state (23,27).
Molecular dynamics (MD) simulations can be useful to describe the nature of these tertiary changes and their dependence on the presence or absence of effectors. The technique is currently the best available computational method to describe and correlate the dynamics and function of biological macromolecules such as proteins at the atomic level (28,29). There is a drawback, however, in performing MD simulations of large protein systems: such simulations are computationally demanding and subject to convergence problems, because the sampling times are too short for adequate exploration of a complex conformational space (30). In the case of conformational changes between two very different end states, the sampling must be sufficiently thorough to capture the transition, hence the long-standing impediment to modeling the HbA quaternary transition since it occurs on the microsecond timescale (31), well beyond what can be readily modeled on available computers. This is due to the severe requirement that the integration timestep be small enough to resolve the fastest components of the motion so as to provide numerical stability.
Due to its large size (574 amino acid residues) and complexity (α2β2 tetrameric assembly, inequivalence of α- and β-hemes) (16,32), hemoglobin MD simulations have accordingly been limited to subsets of interface residues (33), or to monomers or dimers within the framework of short-timescale events such as the dissociation of CO from one α-subunit (∼350 fs) (34) or distal heme perturbations transmitted to the interface of an αβ dimer (∼100 ps) (35). The first MD simulations reported on the fully tetrameric HbA structure were performed with a Path Exploration technique that used constraints to drive one end state (T) to the other end state (R) along a subset of pathways that fulfill the initial constraints within ∼200 ps (36). The approach, assuming that T- and R-state HbA are described by only one quaternary state, successfully described multiple pathways for a T→R transition, but was not intended to investigate heterotropic effects nor conformational heterogeneity. The only long nanosecond-timescale simulation reported on a HbA system is the very recent 45-ns trajectory acquired not on R- or T-state HbA, but on an oxy-HbA model constrained in the T state through the use of initial coordinates obtained from a crystal grown at 4°C (37). The authors were seeking to observe the T→R quaternary transition, obviously not possible within this timescale.
In this study, we report on 6-ns MD simulations of HbA in the R and T states, as well as in the presence of DPG, performed to explore whether tertiary changes can be induced by effector binding. To date, no MD simulations have ever been reported on HbA in the presence of effectors, with the exception of our own model equilibration studies. The first was a docking study proposing sites for the binding of R-state HbA to DPG and various other heterotropic effectors (38), and the second examined 2-ns simulations within the framework of experimental high-pressure studies aimed at investigating the effect of effectors on interface stability (39). In this work, we aim to describe how DPG can perturb overall HbA dynamics with longer-time simulations performed to achieve full relaxation of the models in solvent. Since no detailed all-atom MD analysis has ever been reported on the nanosecond timescale for the R or T HbA end states, it is accordingly of interest to examine the overall conformational flexibility of this much-debated protein on a timescale in which the quaternary transition has not yet occurred (31,37). We first perform a cross-correlation analysis to identify the changes in concerted motions resulting from effector binding, followed by a principal components analysis to provide a description of the most functionally significant motions.
Recent studies have shown that biologically significant concerted motions can be extracted from MD simulations using cross-correlation analysis (40) and principal components analysis (PCA), also called essential dynamics or quasiharmonic analysis (41–44). PCA divides the conformational subspace explored by proteins into a high dimensional near-constraints subspace characterized by high-frequency independent motions and a low dimensional subspace in which concerted, functionally relevant motions occur, termed the “essential subspace” (45). In proteins, collective motions are those motions in which a number of atoms move in a concerted fashion and they are considered particularly adequate for describing protein internal dynamics. This is because proteins consist of rigid secondary structure elements and compact domains connected together by flexible loops that allow them to move as rigid bodies. Hence, to characterize their motion, only variables that describe the relative coordinates of these rigid-body elements need to be determined. This reduction in the number of variables has led to the concept of essential subspace and its description using PCA (43,46).
In this type of analysis, it has been shown that the eigenvectors that describe motion (principal components) converge in time toward a stable set in the nanosecond timescale, suggesting that MD simulations of a few nanoseconds can provide a reasonable definition of the essential subspace, valid beyond the nanosecond range (43,47,48). PCA has been applied to several protein MD simulations, with results systematically showing that the most important fluctuations of a protein can be accounted for by the first few principal components of motion (PCs) (49,50) and that a good description of the essential dynamics of the protein can be thus achieved (51–59).
METHODS
Preparation of HbA models, parameterization
Initial coordinates were obtained from the Research Collaboratory for Structural Bioinformatics repository, namely, 1HHO for R-state HbA (2.10-Å resolution) (60); 2HHB for high-salt T-state HbA (1.74-Å resolution) (61); and 1B86 for the T-state HbA-DPG complex (22). Only one dimer is present in 1HHO; the other one was generated by symmetry. We used the R-state HbA-DPG complex generated in our previous docking study (38). Recently, two 1.25-Å-resolution structures were reported for both oxy- and deoxyHb (62). However, the oxyHb coordinates also include two toluene molecules that rotate Trp14 completely on the other side of the chain, distorting the backbone and introducing an artificial cavity in the subunit. Since the Ramachandran plots for the new structures were also quite similar to that of the 1HHO/2HHB structures, we accordingly concluded that the simulations were best performed with the 1HHO/2HHB structures. (cf. Supplementary Material). To model the chloride binding sites in the T-state HbA model, two Cl− ions were placed in the central cavity close to α-Val1, and where DPG has been shown to bind (63).
DPG was parameterized as follows: initial structures were extracted from the available x-ray structures of the T-state bound complex. Ab initio density functional theory geometry optimizations at the B3LYP level were performed using GAMESS (64). Mulliken charges were obtained from HF/6-31G* calculations and were incorporated into the forcefield. Other parameters were derived according to the CHARMM parameterization protocol (65).
Energy minimization, solvation, and simulation procedure
All simulations were performed using CHARMM version c31b2 with the all-atom 27-protein forcefield included in the distribution (66) and with NAMD (67). Explicit hydrogens were added using HBUILD as implemented in CHARMM and consistent with pH 7.0. Models were explicitly solvated in equilibrated TIP3P water boxes under periodic boundary conditions in boxes of approximately the same size, since they were all constructed by adding a 12-Å layer of water around the protein in all three dimensions. For example, the R-state Hb system consisted of 63,155 explicit atoms in a box of size 90 Å × 81 Å × 81 Å, i.e., 582 protein residues and 18,029 water molecules. To achieve charge neutrality, counterions were added to all models using Helmut Grubmueller's Solvate 1.0 algorithm (68), which places Na+ and Cl− counterions at physiological concentration (0.154 mol/L) according to a Debye-Hückel distribution, followed by a large number (2,000,000) of Monte Carlo equilibration steps. After energy minimization, heating, and equilibration MD, 6-ns production trajectories were acquired. Constant pressure/temperature simulations were performed (P = 0.1 MPa, T = 300 K). All hydrogen bonds were constrained during the simulations using the SHAKE algorithm with an integration timestep of 1 fs. Coordinates were saved every 10 ps and the nonbonded lists were updated heuristically. Full electrostatics were calculated using the particle-mesh Ewald method (69) with a grid spacing on the order of 1 Å or less. For the short-range electrostatic direct summation part, the list of nonbond interactions was truncated at 13 Å. For the long-range reciprocal Ewald sum, a real-space Gaussian width κ = 0.34 Å−1 was used with order 6 (70). The van der Waals interactions were treated with an atom-based nonbond cutoff of 12 Å and a switching function between 10.0 and 12.0 Å . The Hoover method (71) was used to maintain constant temperature and constant pressure was maintained using the Langevin piston method (72) with a piston mass of 400 amu, a piston temperature of 300 K, with a damping coefficient, γ, of 10 ps−1. Langevin dynamics was used throughout the 6-ns simulations, after a heating stage that brought the systems to 300 K in 25 increments of 10 K, followed by 500 ps of equilibration dynamics.
Cross-correlation analysis
To examine the extent of correlated motions, we calculated the cross-correlation (normalized covariance) matrix, Cij, of the fluctuations of each of the x, y, and z coordinates of the Cα atoms (N = 574) from their average during the last 2 ns of the simulations for all models. For the displacement vectors  and
and  of atoms i and j, this matrix, Cij, is given by (40)
 |
(1) |
where  is the displacement from the mean position of the ith atom and the angle brackets represent the time average over the entire trajectory. The elements of the cross-correlation matrix take values from −1 to 1. Positive values of Cij represent a correlated motion between residues i and j, and negative Cij values represent an anticorrelated motion.
Principal components analysis
To identify correlated motions of functional significance, we used principal components analysis. PCA seeks to decompose the atomic fluctuations of a protein into a set of PCs. The first step is the generation of a covariance matrix, C, analogous to that described above by Eq. 1 to describe whether two atoms move in the same or opposite directions. But whereas the cross-correlation matrix builds a N × N matrix, PCA constructs a 3N × 3N matrix of Cartesian displacements (41,45). For an N-atom system, this matrix therefore has 3N columns and 3N − 1 rows, and it describes the positional deviations:
 |
(2) |
where qi are the Cartesian coordinates of the atoms fluctuating around their average positions  The average is calculated over all trajectory structures after superposition on a reference structure to remove overall translations and rotations using a least-square fit procedure (73). This matrix was built for the equilibrated portion of the trajectories, namely for the 4- to 6-ns timescale. We restricted our analysis to Cα and backbone atoms, since it has been shown that the analysis is then less biased by statistical noise and yields a more adequate description of the essential space motions (47). C is symmetric and can be diagonalized by an orthogonal coordinate transformation, T, which transforms it into a diagonal matrix Λ of eigenvalues
  :
:
 |
(3) |
in which the columns are the eigenvectors corresponding to the direction of motion relative to  each associated with an eigenvalue. The eigenvalues represent the total mean-square fluctuation of the system along the corresponding eigenvector. Each eigenvector thus represents a single correlated displacement of a group of atoms in a multidimensional space and the eigenvalues are the amplitude of the motion along the eigenvector. Eigenvectors are then sorted according to their eigenvalues in decreasing order. The eigenvectors associated with the highest eigenvalues describe the principal components of motion. Our analysis yielded 1722 eigenvectors (3 × 574 atoms). It has been shown that the first few eigenvectors can successfully describe almost all conformational substates accessible to the protein. If only a few PCs are needed to explain a large part of the total variance, the motions are highly correlated, i.e., collective. Instead, if many PCs are needed, the motions are more random. To estimate the width of the essential space explored by the system as a function of time, the motion described by an eigenvector can be visualized by projecting each frame, i, of the trajectory onto the eigenvector. The projection pij is calculated as
 |
(4) |
where xi is a 3 × N dimensional vector of the atomic coordinates for the ith trajectory frame and  represents the trajectory average coordinates. Reconstructed trajectories were visualized using VMD (74) and the IED module (75).
To evaluate the dynamical sampling of the principal components, we calculated the root mean-square inner product (RMSIP) between the essential subspaces defined by the first 10 eigenvectors of two different sets of eigenvectors obtained by splitting the trajectories in half, as these correspond to the dominant modes of motion. The RMSIP is defined as (48)
 |
(5) |
where νi and νj are the ith and jth eigenvectors of the two sets, respectively. A good estimate of the overlap, s, of two eigenvectors belonging to two different sets is obtained from the square inner product,
 |
(6) |
RESULTS
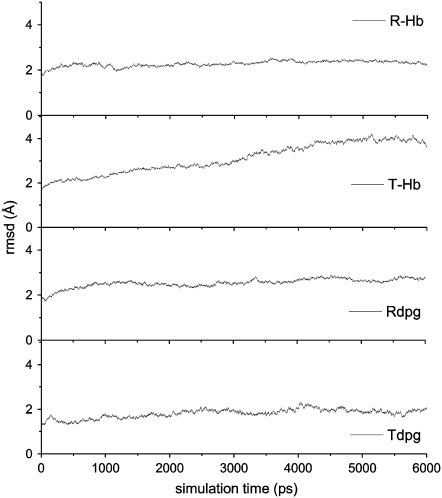
The MD simulations were performed on all four HbA tetrameric models, namely on T-state (deoxygenated) HbA (T-Hb) and R-state (oxygenated) HbA (R-Hb), and on their respective DPG-bound complexes (Tdpg and Rdpg). The time evolution of the backbone root mean-square deviation (RMSD) is shown in Fig. 1 for all four models. Average RMSD values were 1.85, 2.24, 2.60, and 1.81 Å for R-Hb, Rdpg, T-Hb, and Tdpg, respectively. In all cases, the models reach equilibrium within the first nanosecond of the simulations, with the exception of T-Hb, which required ∼4 ns to equilibrate. We accordingly elected to analyze the last 2 ns of the trajectories.
FIGURE 1.
Evolution of the backbone RMSD over time from the starting structures for all four HbA models. The reference structures were the starting energy-minimized structures.
Cross-correlation analysis
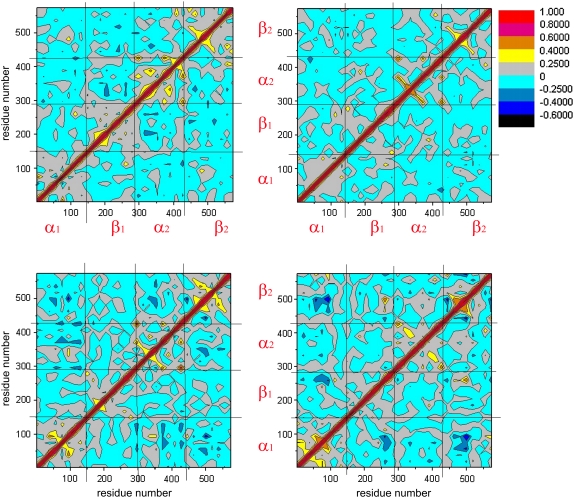
To provide insight into the effect of DPG on correlated/anticorrelated HbA motions, we plot the cross-correlation matrices of the fluctuations in Fig. 2. Highly positive regions (orange and yellow) are indicative of strong correlation in the movement of specific residues, whereas negative regions (dark blue and navy) are associated with strong anticorrelated motion of the residues. Overall, we note that among correlated motions, very few are highly correlated (orange), except for the diagonal, which represents the correlation of a residue with itself (red). The same applies to highly anticorrelated motions (dark blue): very few occur. This is not surprising as no large scale conformational change occurs during the timescale of our simulations. In each plot, the four squares enclosing the diagonal depict intrasubunit concerted motions, i.e., correlated motions within the individual α1, β1, α2 and β2 subunits. Generally, values ranging between 0.25 and -0.25 are not considered significant (76).
FIGURE 2.
Cross-correlation matrix of the fluctuations of each of the x, y, and z coordinates of the Cα atoms from their average during the last 2 ns of the simulations. Correlated and anticorrelated motions are color-coded. Red, orange, and yellow indicate that the motions of the Ca atoms are concerted (positive correlation), and blue and dark blue indicate that they move opposite to each other (negative anticorrelation). Gray regions are indicative of noncorrelated, random motions. The analysis was performed on the 574 Cα atoms of all HbA models, namely: T-deoxyHb (upper left), R-oxyHb (upper right), T-deoxyHb + DPG (lower left), R-deoxyHb + DPG (lower right).
In the case of T-HbA (Fig. 2, upper left) we note that the strongest intrasubunit correlated motions occur in the α2 and β2 subunits (diagonal squares with highest levels of orange-yellow regions). The effect of DPG (Fig. 2, lower left) is to increase the extent of intrasubunit correlated motions in the α1 and β2 subunits while redistributing them in the α2 and β1 subunits. Anticorrelated motion is also introduced in the β2 subunit in the presence of the effector. Intersubunit correlated motions are also affected by DPG (off-diagonal squares). Correlated motion is somewhat decreased between residues of the α2 and β2 subunits, the α1 and β1 subunits, and the α1 and β2 subunits. Intersubunit anticorrelated motions are increased between the α1 and β2 subunits, the α1 and α2 subunits, and the α2 and β2 subunits. They are decreased between the α2 and β1 subunits and also between the β1 and β2 subunits, where DPG binds.
In R-Hb (Fig. 2, right), the presence of DPG significantly increases the extent of intrasubunit correlated motion in both the α1 and β2 subunits while decreasing it in the α2 subunit and, to a smaller extent, in the β1 subunit. As for intersubunit correlations, correlated motion increases between the β1 and β2 subunits. Anticorrelated motions similarly increase between the α1and β1 subunits, between the α1 and β2 subunits, and, less significantly, between the α1 and α2 subunits (DPG binding site).
The cross-correlation analysis reveals a complex pattern of correlated and anticorrelated intrasubunit and intersubunit HbA motions significantly affected by the presence of the effector. Most noticeable is the effector-induced perturbation of concerted interdimeric motions (α1β2 and α1α2 for the T state and α1β2 and β1β2 for the R state), regions that participate in the rotation of subunits relative to each other during the quaternary transition. However, since we model the addition of effector in the absence of this transition, our results show that the simple presence of DPG is sufficient to perturb the HbA intrinsic fluctuations to an extent affecting subunit dynamical coupling.
That the motions described by the cross-correlation plots are different for the α1β1 and α2β2 subunits of R- and T-state HbA deserves comment, because the HbA tetramer is always described as consisting of two equivalent dimers. Although this is certainly true when considering that the two αβ dimers consist of identical α- and β-subunit sequences, our analysis suggests that this symmetry breaks down as a result of conformational dynamics, i.e., from a dynamics perspective, the two dimers are not equivalent. This is supported by our having generated the R-state model by symmetry, unlike the T-state model, for which coordinates are provided for the four chains. Asymmetry of the dimers can also be anticipated from the crystallographic B-factors. Using the starting x-ray coordinates of two of our HbA starting structures—namely, those of T-state HbA (2hhb.pdb) and T-state bound to DPG (1b86.pdb)—to calculate isothermal fluctuations also results in “dynamic asymmetry” between the dimers of the same tetramer (data not shown). This could be a consequence of HbA subunits sequentially binding and releasing O2, with the asymmetric process reflected in the crystal growth mechanism.
Principal components analysis
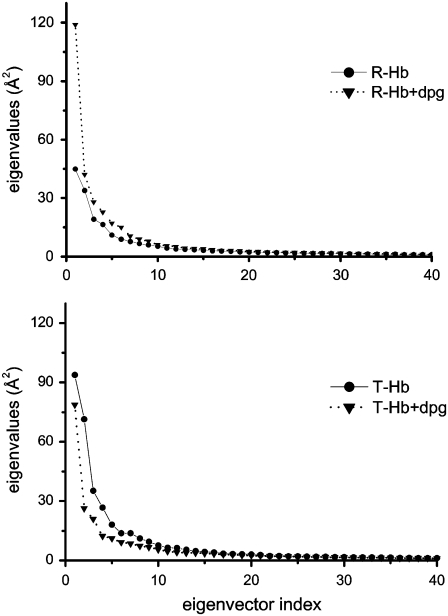
We now turn to the results of our principal components analysis. Fig. 3 shows a plot of the eigenvalues (3N = 1722) obtained from the diagonalization of the covariance matrix of the atomic fluctuations, plotted in decreasing order versus the corresponding eigenvector indices for the four HbA models. The first few eigenvalues correspond to concerted motions that quickly decrease in amplitude to reach a large number of constrained, more localized fluctuations. The first four principal components account for 41, 53, 52, and 44% of the motion observed in the last 2 ns of the trajectories for R-Hb, T-Hb, Rdpg, and Tdpg, respectively.
FIGURE 3.
Comparison of the eigenvalues plotted against the corresponding eigenvector indices obtained from the Cα covariance matrix constructed from the last 2 ns of the 6-ns simulations for all Hb models. (Upper) R-state HbA. (Lower) T-state HbA (triangles, with DPG; circles, without DPG).
Comparing the four models, the plot indicates that the properties of the motions described by the first few principal components are not the same for T-Hb and R-Hb in that the magnitudes of the eigenvalues are higher for T-Hb. The presence of the effector drastically increases the magnitude of PC1 in R-Hb while decreasing it slightly in T-Hb. In T-Hb, it is rather the magnitude of PC2 that is most affected by the presence of DPG.
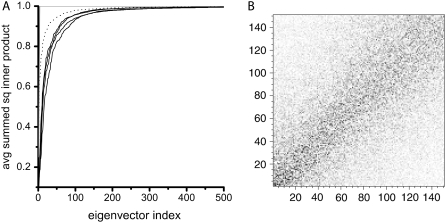
To assess the extent of sampling achieved within the timescale of our simulations, we analyzed the essential spaces using the average cumulative square inner products method (Eq. 5). In Table 1, we report the RMSIP between the first 10 eigenvectors extracted from the first and second halves of the trajectories for all models. The average summed square inner product curves shown in Fig. 4 A provide a good description of the subspace overlap of the first 10 eigenvectors of one R-Hb trajectory half onto all the eigenvectors of the second half. Similar results were obtained for all models and also when calculating the overlap of the first five eigenvectors. The dotted line represents the overlap of the first 10 eigenvectors of a 500-ps R-Hb trajectory segment onto all the eigenvectors of a 1-ns segment and the gray trace (straight horizontal trace in upper plot) was obtained for the inner product of the first 10 eigenvectors of one 1-ns simulation with itself (identity). The curves show to what extent the first 10 modes of the first half of a trajectory are present in the second half, i.e., predominantly in the low eigenvector-index region. The more this occurs, the more convex the curves. In such plots, a straight diagonal would represent no correlation at all. In their investigation of the consistency of PCA (77), de Groot et al. showed that the noise that causes overlap between eigenvectors from the essential subspace and near-constraint eigenvectors from the other set is not homogeneously spread over all near-constraint eigenvectors, but is concentrated in the near-constraints that have an appreciable eigenvalue, leaving negligible overlap with all other eigenvectors. This is also what we observe: the overlap of the 300-ps simulation with the 1-ns simulation (Fig. 4 A, dotted line) is not significantly higher than the overlap between the 1-ns simulations (solid traces) that contain less statistical noise. This shows that the convergence of the essential subspace is rapid and does not increase significantly in the time window from 300 ps to 1 ns. Fig. 4 B shows a plot of the squared inner-product matrix for the α-subunit of R-Hb showing the eigenvectors calculated from the first half of the trajectory projected onto those calculated for the second half. All high inner products (black dots) are found close to the diagonal, showing that directions in conformational space have similar freedom in the two simulations. The first 10 eigenvectors spanning the essential subspace of the first half of the simulation show the largest inner products with the essential eigenvectors extracted from the second half. The same clustering result of the inner products along the diagonal was obtained for all models.
TABLE 1.
RMSIP for projection of the first 10 eigenvectors of the first half of a trajectory with the eigenvectors of the second half
| α1 | β1 | α2 | β2 | |
|---|---|---|---|---|
| R-HbA | 0.54 | 0.57 | 0.61 | 0.60 |
| R-HbA + dpg | 0.56 | 0.52 | 0.58 | 0.59 |
| T-HbA | 0.53 | 0.59 | 0.63 | 0.64 |
| T-HbA + dpg | 0.62 | 0.59 | 0.56 | 0.57 |
FIGURE 4.
(A) Average summed square inner products for the first 10 eigenvectors of one 1-ns simulation with all the eigenvectors of a second 1-ns simulation, averaged over all pairs for all models: R-Hb, T-Hb, Rdpg, and Tdpg (black traces). The dotted line is the result obtained for the comparison of a 500-ps subset of the R-Hb 1-ns simulation compared to an entire 1-ns simulation. The gray trace represents identity (straight line on top of the graph), i.e., the inner product of the first 10 eigenvectors of one 1-ns simulation with themselves. (B) Squared inner product matrix for the α1 subunit of R-Hb showing the eigenvectors calculated from the first half of the trajectory projected onto those calculated for the second half.
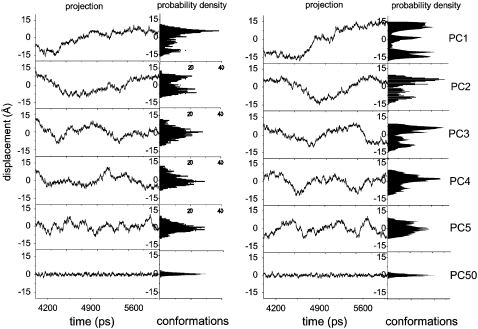
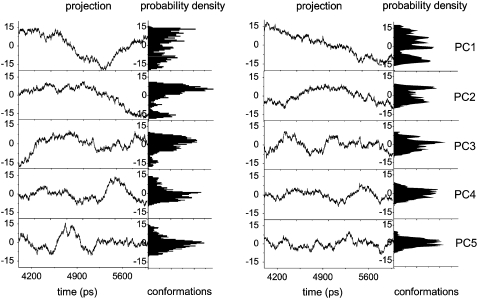
In PCA, the motion along any eigenvector can be obtained by projecting all trajectory frames on any given eigenvector. A new trajectory is generated revealing the motion in the direction defined by the eigenvector (41,43,51). Figs. 5 and 6 show plots of the trajectories projected onto the first five eigenvectors for all models and the corresponding histograms of the probability distributions. The plots are indicative of the degree of anharmonicity of the motions and clearly show that the probability distributions of the first four principal components are far from Gaussian for all models, exhibiting characteristic multiple-minima protein energy landscape features (43,78,79). After ∼PC5, the distributions of the motions along the eigenvectors become Gaussian, i.e., more harmonic, as illustrated by PC50 shown in Fig. 5 for comparative purposes. Considering the projections on the first two to three eigenvectors, they describe a slow motion of large amplitude resulting from slow diffusion kinetics (80), indicative of the sampling of this subspace during the timescale of our simulations. Convergence is seen to be almost achieved, showing that, at the same point in time, the principal components of motion are affected by the effector. Amadei et al. have shown that simulations of a few hundred picoseconds are usually sufficient to provide a stable and statistically reliable description of the essential subspace on the nanosecond timescale (48,81). Since the analysis was performed on equilibrated trajectories (Fig. 1), it is accordingly reasonable to assume that the motion described by our sampling indeed belongs to the essential subspace. Examining PC1 to PC4 for all models, it can be seen that HbA explores more than one conformation within the R and T states, suggesting that a given HbA quaternary state is best described as an ensemble of tertiary conformations undergoing structural transitions, rather than as one specific structure.
FIGURE 5.
Projection of the Cα-atom trajectory along the first five eigenvectors of the covariance matrices of the R-oxyHb models without (left) and with (right) DPG. On the righthand side, histograms of the fluctuations show the corresponding probability distributions. For comparative purposes, “Gaussian” PC50 is also included.
FIGURE 6.
Projection of the Cα-atom trajectory along the first five eigenvectors of the covariance matrices of the T-deoxyHb models with (left) and without (right) DPG.
In the motion described by PC1, one conformation predominates in R-Hb from 4 to 4.3 ns, clearly evolving to a different conformation at ∼4.7 ns (Fig. 5, top left). The presence of DPG significantly affects PC1 with three conformations (Fig. 5, top right) now distinctly recognizable. A similar effect can be seen in the T-state models (Fig. 6, top row). In the absence of effector, one conformation predominates from 4 to 4.5 ns, evolving to another at ∼5 ns. The presence of DPG also affects the distribution of conformations.
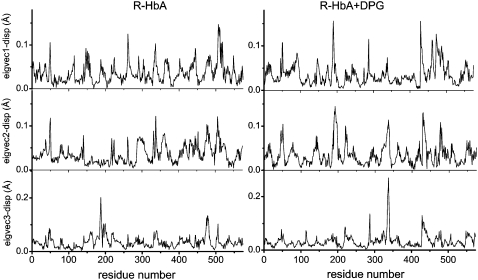
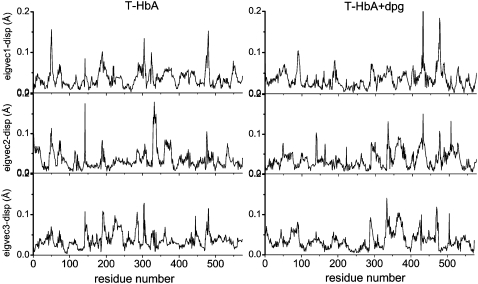
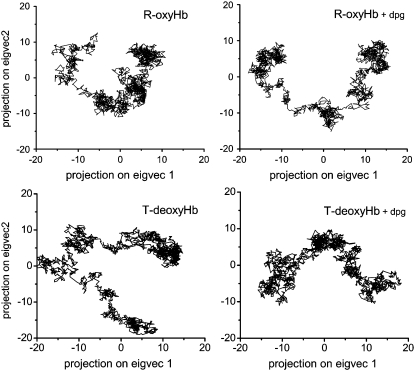
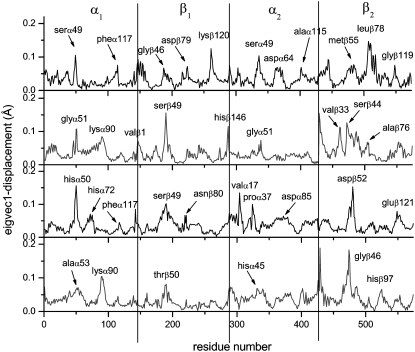
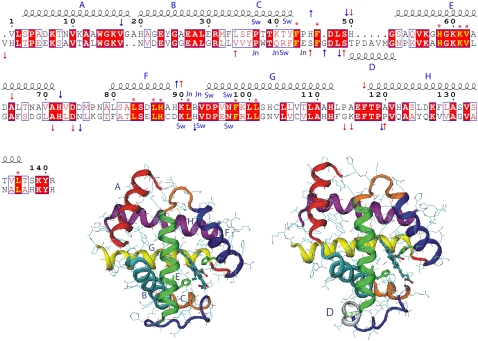
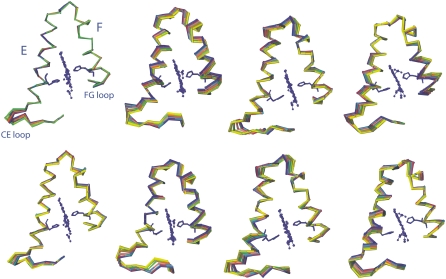
Figs. 7 and 8 show the residue displacements corresponding to the motions described by the first three eigenvectors, for R- and T-state Hb, respectively. For a given model, a rich picture emerges of the regions of specific displacement for each of the first three principal eigenvectors. It can be seen that some of the motions described by one eigenvector are also described by the second and third eigenvectors, thus reinforcing the concerted character of the motions (cf. Figs. 7 and 8, asterisks) with a clear effect resulting from the presence of DPG in both HbA states. Fig. 9 shows the motion of the models in phase space, projected along their two first principal components for atomic motion. These plots provide a measure of the mobility of the protein in the essential subspace, showing clusters representative of explored tertiary conformations that differ for all models. Fig. 10 compares the residue displacements along the first eigenvector for all four models and Fig. 11 is provided as a reference map to locate helices and loop regions. Functionally important conserved residues are labeled with a red asterisk (meaning that they are located near the heme) and the regions whose motion is affected by the presence of DPG (Fig. 10) are indicated by arrows. It should be noted that, for clarity's sake, the arrows only label residues with maximum displacements, but that the motion is indeed concerted, involving anywhere from ∼5 to 30 neighboring residues as well. Fig. 12 depicts the overall motion described by PC1 for the R-Hb tetramer.
FIGURE 7.
Residue displacements in the subspaces spanned by the first three eigenvectors for R-state HbA (left) and for the DPG-bound model (right).
FIGURE 8.
Residue displacements in the subspaces spanned by the first three eigenvectors for T-state HbA (left) and for the DPG-bound model (right).
FIGURE 9.
Projection of Cα-atom trajectories on the first two eigenvectors for all four models.
FIGURE 10.
Residue displacements of the first eigenvectors for all four models. (Top to bottom) R-oxyHb, R-oxyHb + DPG, T-deoxyHb, and T-deoxyHb + DPG.
FIGURE 11.
Sequence alignment of HbA chains relative to the α-chain. The first alignment line is that of the α-chain and the second that of the β-chain. Helices are drawn and named (A–G) above the residue numbering. Helix D (50–56), which occurs only in the β-chain, is shown below the alignment lines. Strictly conserved residues are in red blocks and highly homologous residues are in red type inserted in blue boxes. Red asterisks indicate conserved residues located in the heme pocket. The proximal and distal His residues are at positions 87 and 58 in the α-chains and at positions 92 and 63 in the β-chain. Arrows indicate the regions of R-Hb (red) and T-Hb (blue) where motions are affected by the presence of DPG. Residues that belong to the switch region are labeled as Sw (α1-Thr38, α1-Thr41, α1-Tyr42, α1-Asp94, α1-Asn97, β2-Arg40, β2-His97, β2-Asp99, and β2-Asn102) and joint region residues as Jn (α1-Leu91, α1-Arg42, α1-Asp94, β2-Trp37, β2-Gln39, β2-Arg40, and β2-Asn102). The alignment was performed using the program ClustalW, version 1.83 (98), and the figure was generated with ESPript, version 2.1 (99) with the various labels added manually. Ribbon renderings of an α-chain (all helices labeled) and a β-chain (only helix D labeled). The loop regions are color-coded as follows: blue, CE loop region; orange, EF loop; and red, FG loop. The structures were generated using the 1hho.pdb coordinates and the program VMD.
FIGURE 12.
(Upper row) Motion described by the first eigenvector (PC1) for R-Hb, Rdpg, T-Hb, and Tdpg (left to right). (Lower row) Motion described by the second eigenvector (PC2) for the same models. For clarity's sake, only helices E and F from the α1 subunit are shown with the CE and FG loop regions. The hemes (CPK) and the distal and proximal histidines (sticks) are shown for the first trajectory frame only. The last 2 ns of the trajectories were projected on the eigenvectors. Only 10 frames out of 2000 are shown. The direction of motion goes from blue to green to yellow to red. That the red is observed near the blue indicates that the motion completes a fluctuation cycle within the 2-ns timescale.
In the R-Hb α1β1 subunits, the protein sequentially visits approximately three conformational regions (Fig. 9, upper left), corresponding to enhanced displacements in the α1-Ser49, α1-Phe117, β1-Gly46, β1-Asp79, and β1-Lys120 regions for PC1 (Fig. 10, upper black trace), and occurring in loop regions between helices C and E (α1-Ser49, β1-Gly46), G and H (α1-Phe117, β1-Lys120), E and F (β1-Asp79). These displacements are indicative of the wide conformational space explored by the residues, since these motions also have a large amplitude in PC2 and PC3 (Figs. 7 and 8). In the R-Hb α2β2 subunits, maximum displacements also occur in the α2-Ser49 and α2-Ala115 regions and in the β2-Leu78 and β2-Gly119 regions, as in the α1β1 subunits, but there is additional displacement in the α2-Asp64 (helix E) and the β2-Met55 regions (CE loop), not seen in the α1β1 subunits (“dynamic asymmetry,” see above). Relative to the α1β1 subunits, EF loop motion is also increased (β2-Leu78).
In the presence of DPG (Fig. 9, upper right), the protein also visits approximately three conformations in a direction of motion similar to that of R-Hb without the effector, but in this case with larger amplitude. From Fig. 10 (upper blue trace), the motion of PC1 is seen to correspond to displacements that are different relative to R-Hb in the CE loop region (increased α1-Asp47 and α1-Gly51, and decreased α1-Ser49), as well as in the GH loop region (decreased motion of α1-Phe117) and in the FG loop region (increased α1-Lys90). In the β1 region, the CE loop region motion is increased (β1-Ser49), with damping of the EF and GH loop regions (β1-Asp79, β1-Lys120). In the α2 subunit, motion in the CE loop region is also damped (α1-Gly51), as well as in the α2-Asp64 region (helix E) and the GH loop region (α2-Ala115). In the β2 subunit, the EF loop motion is damped (β2-Leu78), as is the β2-Met55 region, with perturbation of helix C motions. Fig. 12 (left) compares the Cα motion described by PC1 (upper) and C2 (lower) for both R-Hb and Rdpg in the E and F helices and CE and FG loop regions. The changes between helices C and E are especially noteworthy, since this region includes α1-Phe43 and α1-Phe46, two residues of functional significance located in the heme pocket distal to the heme, where oxygen binds (Fig. 11, red asterisks). The same applies to perturbed motion in the region between helices F and G, since α1-Leu91, α1-Leu86, and α1-His87 are all proximal heme pocket residues.
In the case of the T-state model, Fig. 9 (lower left) shows that both the direction of motion and the amplitude of the visited conformational space differ from that of the R-state protein (upper left). For PC1, this corresponds to maximum displacements in the α1-His50, α1-His72, α1-Phe117, β1-Ser49, β1-Asn80, α2-Val17, α2-Pro37, α2-Asp85, β2-Asp52, and β2-Glu121 regions (Fig. 10, third trace from top) corresponding to motions in the CE, EF, and GH loop regions, and in residues of helices A, C, and F. As was the case for R-Hb, the presence of DPG also perturbs the dynamics of the T state, changing both the direction and amplitude of motion (Fig. 9, lower right, and Fig. 10, bottom trace). In the α1β1 subunits, this corresponds to motion in the CE loop region (α1-Ala53), which is damped relative to the model without the effector and enhanced in the loop region between helices F and G (α1-Lys90). The α2-Val17 region displacement is also damped. In the α2β2 subunits, the CE loop region displacements are enhanced (α2-His45), with damping of helix A residue motion. In the β2 subunit, there is increased mobility of the N-terminal residues (β2-Val1) and shifted displacements in the CE loop motion (β2-Gly46), with enhanced displacements in the FG loop regions (β2-His97) (Fig. 11, blue arrows). As was the case for R-Hb, the effect of DPG is to perturb motions in regions close to functionally important residues. Fig. 12 (right) illustrates the motion described by PC1 and PC2 for both T-Hb and Tdpg for the E and F helices and the CE and FG loop regions.
Overall, for all subunits in both models, structural rearrangements occur chiefly in the loop regions, in agreement with earlier (82) and more recent (57) Mb simulations showing that loop region fluctuations activate functionally significant conformational transitions. Additionally, the simulations reveal that the amplitude of concerted helical fluctuations is also affected by the effector (Fig. 12).
DISCUSSION
We organize our discussion in three sections. First, we evaluate the validity of our principal components analysis; second, we discuss the relevance of our results within the framework of the current models proposed to account for HbA function; and third, we explore the possible functional significance of the motions perturbed by the presence of DPG.
Validity of the simulations
Our simulations had the advantage of not seeking to describe the motions involved in the HbA quaternary transition, but rather to investigate the effect of the presence of a small effector molecule on the tertiary conformational dynamics of the HbA R and T states. Hence, the 6-ns timescale is considered adequate, since no attempt is made to model large quaternary conformational changes that would require longer exploration times. The simulations were long enough to cover an adequate amplitude in the essential subspace so as to analyze the fluctuation changes resulting from the presence of the effector. This is illustrated in Fig. 4 A, which shows that the convergence of the essential subspace is rapid and does not increase significantly between 300 ps and 1 ns. The RMSIP values reported in Table 1 are also in agreement with the values of 0.5–0.7 considered representative of adequate convergence of the essential subspaces (48,83,84), and they validate the timescale used in our simulations.
PCA also proved effective to extract relevant insights describing motions. The information obtained from MD simulations performed on large protein systems is often lost because of the enormous amount of atomic detail generated, and PCA yielded useful data reduction, the first few principal components identifying several regions affected by DPG binding, involving displacements in loop regions controlling heme pocket residues. Despite the complexity introduced by HbA's large size, details of the changes in the tertiary structural elements resulting from the presence of DPG clearly emerge.
Relevance of results in the context of HbA allosteric models
Our simulations clearly show that HbA explores different tertiary conformations within each quaternary state (Figs. 5 and 6). They also show that the presence of an effector perturbs the conformational substate distribution and also the concerted motions of the HbA tetramer in both states (Fig. 2), as well as subunit dynamics in functionally important regions (Figs. 10–12). As such, they support the recently proposed global allostery model, which postulates that the regulation of oxygen affinity 1), is independent of the quaternary transition; and 2), occurs as a result of tertiary structural changes induced by the presence of heterotropic allosteric effectors (8).
The evolution of allosteric models describing HbA function were recently reviewed, with a focus on cooperative oxygen binding, i.e., on homotropic effects (85). Of interest is that, after several decades of effort, the models now considered consistent with all the major experimental results reported on homotropic effects are those relating the oxygen affinity of a subunit solely to its tertiary conformation. The global allostery model, however, is especially attractive, because it postulates not only tertiary equilibria in HbA states, but also their modulation by allosteric effectors, as shown by the wide range of experiments performed with DPG, IHP, BZF, and L35 (3,7,8). Our simulations are consistent with these experiments. Specifically, they support the experimental conclusion that the T and R quaternary states of deoxy- and oxyHb can remain unaltered in the presence of effectors by showing that the perturbations of the fluctuations induced by the presence of DPG occur in the absence of the quaternary transition. The experiments also reported changes of tertiary structure in the distal heme pocket of R-HbA (8), with agreement again found in the simulations pointing to perturbation of heme pocket residue fluctuations.
Functional significance of the HbA motions perturbed by DPG
Overall, our simulations imply that the modulation of O2 affinity by HbA should be correlated more to dynamics than to structural considerations. The simulations are clearly indicative of fluctuation amplitudes being affected by the presence of the effector (Fig. 12). The idea that the efficiency of protein function must be strongly dependent on the amplitudes of the intrinsic structural fluctuations of a macromolecule is not new (86,87), but our work represents the first simulations showing that HbA fluctuations are perturbed by the presence of an effector in regions that are significant for oxygen binding (Fig. 11). Of the structural interpretations proposed to account for the effect of heterotropic effectors on HbA function, it is noteworthy that none that we know of to date considered their role in perturbing HbA intrinsic dynamics (1–3,5,7,8,88–90).
Our simulations cannot describe the impact of dynamics on ligand-binding mechanisms as this would require the use of mixed quantum mechanics methods to model the ligand-binding event(s) in the presence/absence of effector (91). However, they allow us to speculate on how DPG could modulate O2 affinity. We propose that effectors act by fine-tuning the distribution of tertiary conformations within HbA quaternary states and the intersubunit correlated motions leading to a redistribution of energy. Hopfield first suggested that the HbA protein matrix could modulate the free energy of oxygen binding (92). He proposed a model in which the modulation was small-scale and stored as small amounts of strain energy not in the heme groups, as proposed by Perutz (7), nor in the proximal histidine, as proposed by Gelin (93), but rather, distributed in the protein bonds. Our analysis indicates that the predominant components of HbA tertiary motion occur in an essential subspace spanning degrees of freedom over the entire HbA molecule, easily perturbed by the effector, and could correspond to the small-scale modulation described by Hopfield (92).
Our simulations also support the view that the concept of HbA existing in equilibrium between two discrete quaternary conformational states should then more fittingly be replaced by a description of HbA as a complex conformational and dynamical ensemble, with stabilization energies not uniformly distributed throughout the protein matrix but rather in regions of high and low dynamic stability within the ensemble of conformations defining the given native state. In this view, cooperativity may indeed be a more “dynamically” localized than global phenomenon. The action of DPG is not direct: in both states, it binds noncovalently in the central cavity at sites distant from the hemes; hence, its regulatory effect occurs entirely in the dynamic domain. If this interpretation is correct, DPG would lower oxygen affinity by modifying the amplitude of HbA fluctuations required for optimal oxygen binding. As such, our simulations illustrate that the information content of a macromolecule consists not only of its average conformation, but also of the frequencies and amplitudes of fluctuations about its conformation (Fig. 12), with communication across the protein made simply by modifying fluctuations even in the absence of macromolecular conformational change, as proposed by Cooper's statistical thermodynamics model for allostery (94).
CONCLUSIONS AND FUTURE DIRECTIONS
Our simulations allowed us to show that both HbA states explore a range of different tertiary conformations whose fluctuations are perturbed by the presence of DPG. This supports HbA allosteric models based on the premise that tertiary conformational changes play the primary role instead of the quaternary transition (7,8). We also attempted to rationalize how the binding of DPG at a site distant from the hemes could affect oxygen affinity to such an extent and proposed that this could be achieved by perturbation of the dynamic equilibrium between the tertiary conformations of HbA states and the associated network of correlated motions. DPG would then regulate affinity by modifying the global dynamic flexibility of the R and T states in the regions that anchor the hemes.
The next question that needs to be addressed is how the perturbed fluctuations effectively modify heme properties. This issue is currently under investigation with normal coordinate structural decomposition calculations (95). In an earlier study performed on HbA energy-minimized crystal structures, we reported differences in the heme planarity of effector-bound structures (96). Repeating the analysis on the hemes extracted from the present simulations will no doubt provide more insight into the heme properties affected by DPG.
Undoubtedly, the next challenge that must be addressed is the experimental monitoring of HbA dynamics. The experimental characterization of protein fluctuations is, however, often complicated by the derivatizations required to obtain the experimental signal, as shown, for example, by the recent magnetic relaxation dispersion profiles recently obtained for bovine cyanoHb (97). In this context, time-resolved Laue experiments come to mind, such as those reported for Mb, which described the complex landscape of Mb structural dynamics after ligand dissociation (25,26). Performed in the presence and absence of an effector, such experiments would provide much needed data on the timescale of the conformational transitions of the Hb protein matrix that are directly involved in ligand binding.
SUPPLEMENTARY MATERIAL
An online supplement to this article can be found by visiting BJ Online at http://www.biophysj.org.
Acknowledgments
The authors acknowledge computational support for this research from the National Science Foundation Terascale Computing Grid (grant No. MCB060079T to M.L.) and from the National Heart, Lung and Blood Institute (grant No. HL 14508 to T.Y.)
Editor: Ron Elber.
References
- 1.Coletta, M., P. Ascenzi, M. Castagnola, and B. Giardina. 1995. Functional and spectroscopic evidence for a conformational transition in ferrous liganded human hemoglobin. J. Mol. Biol. 249:800–803. [DOI] [PubMed] [Google Scholar]
- 2.Coletta, M., M. Angeletti, I. Ascone, G. Boumis, A. C. Castellano, M. Dell'Ariccia, S. Della Longa, G. De Sanctis, A. M. Priori, R. Santucci, A. Feis, and G. Amiconi. 1999. Heterotropic effectors exert more significant strain on monoligated than on unligated hemoglobin. Biophys. J. 76:1532–1536. [DOI] [PMC free article] [PubMed] [Google Scholar]
- 3.Tsuneshige, A., S. Park, and T. Yonetani. 2002. Heterotropic effectors control the hemoglobin function by interacting with its T and R states: a new view on the principle of allostery. Biophys. Chem. 98:49–63. [DOI] [PubMed] [Google Scholar]
- 4.Viappiani, C., S. Bettati, S. Bruno, L. Ronda, S. Abbruzzetti, A. Mozzarelli, and W. A. Eaton. 2004. New insights into allosteric mechanisms from trapping unstable protein conformations in silica gels. Proc. Natl. Acad. Sci. USA. 101:14414–14419. [DOI] [PMC free article] [PubMed] [Google Scholar]
- 5.Nagatomo, S., M. Nagai, Y. Mizutani, T. Yonetani, and T. Kitagawa. 2005. Quaternary structures of intermediately ligated human hemoglobin A and influences from strong allosteric effectors: resonance Raman investigation. Biophys. J. 89:1203–1213. [DOI] [PMC free article] [PubMed] [Google Scholar]
- 6.Chen, Q., I. Lalezari, R. L. Nagel, and R. E. Hirsch. 2005. Liganded hemoglobin structural perturbations by the allosteric effector L35. Biophys. J. 88:2057–2067. [DOI] [PMC free article] [PubMed] [Google Scholar]
- 7.Yonetani, T., Q. S. Park, A. Tsuneshige, K. Imai, and K. Kanaori. 2002. Global allostery model of hemoglobin: modulation of O2-affinity, cooperativity, and Bohr effect by heterotropic allosteric effectors. J. Biol. Chem. 277:34508–34520. [DOI] [PubMed] [Google Scholar]
- 8.Yonetani, T., and A. Tsuneshige. 2003. The global allostery model of hemoglobin: an allosteric mechanism involving homotropic and heterotropic interactions. C. R. Biol. 326:523–532. [DOI] [PubMed] [Google Scholar]
- 9.Monod, J., J. Wyman, and J.-P. Changeux. 1965. On the structure of allosteric transitions: a plausible model. J. Mol. Biol. 12:88–118. [DOI] [PubMed] [Google Scholar]
- 10.Szabo, A., and M. Karplus. 1972. A mathematical model for structure-function relations in hemoglobin. J. Mol. Biol. 72:163–197. [DOI] [PubMed] [Google Scholar]
- 11.Perutz, M. F. 1970. Stereochemistry of cooperative effects in haemoglobin. Nature. 228:726–739. [DOI] [PubMed] [Google Scholar]
- 12.Perutz, M. F., A. Wilkinson, M. Paoli, and G. Dodson. 1998. The stereochemical mechanism of the cooperative effects in hemoglobin revisited. Annu. Rev. Biophys. Biomol. Struct. 27:1–34. [DOI] [PubMed] [Google Scholar]
- 13.Jones, C. M., A. Ansari, E. R. Henry, G. W. Christoph, J. Hofrichter, and W. A. Eaton. 1992. Speed of intersubunit communication in proteins. Biochemistry. 31:6692–6702. [DOI] [PubMed] [Google Scholar]
- 14.Friedman, J. M. 1994. Time-resolved resonance Raman spectroscopy as probe of structure, dynamics, and reactivity in hemoglobin. Methods Enzymol. 232:205–231. [DOI] [PubMed] [Google Scholar]
- 15.Jayaraman, V., K. R. Rodgers, I. Mukerji, and T. G. Spiro. 1995. Hemoglobin allostery: resonance Raman spectroscopy of kinetic intermediates. Science. 269:1843–1848. [DOI] [PubMed] [Google Scholar]
- 16.Adachi, S., S. Y. Park, J. R. H. Tame, Y. Shiro, and N. Shibayama. 2003. Direct observation of photolysis-induced tertiary structural changes in hemoglobin. Proc. Natl. Acad. Sci. USA. 100:7039–7044. [DOI] [PMC free article] [PubMed] [Google Scholar]
- 17.Samuni, U., D. Dantsker, L. J. Juszczak, S. Bettati, L. Ronda, A. Mozzarelli, and J. M. Friedman. 2004. Spectroscopic and functional characterization of T state hemoglobin conformations encapsulated in silica gels. Biochemistry. 43:13674–13682. [DOI] [PubMed] [Google Scholar]
- 18.Roche, C. J., D. Dantsker, U. Samuni, and J. M. Friedman. 2006. Nitrite reductase activity of sol-gel encapsulated deoxy hemoglobin: influence of quaternary and tertiary structure. J. Biol. Chem. 281:36874–36882. [DOI] [PubMed] [Google Scholar]
- 19.Baldwin, J., and C. Chothia. 1979. Haemoglobin: the structural changes related to ligand binding and its allosteric mechanism. J. Mol. Biol. 129:175–220. [DOI] [PubMed] [Google Scholar]
- 20.Frauenfelder, H., F. Parak, and R. D. Young. 1988. Conformational substates in proteins. Annu. Rev. Biophys. Biophys. Chem. 17:451–479. [DOI] [PubMed] [Google Scholar]
- 21.Mozzarelli, A., and C. Rivetti. 1991. Crystals of haemoglobin with the T quarternary structure bind oxygen noncooperatively with no Bohr effect. Nature. 351:416–419. [DOI] [PubMed] [Google Scholar]
- 22.Richard, V., G. G. Dodson, and Y. Mauguen. 1993. Human deoxyhaemoglobin-2,3-diphosphoglycerate complex low-salt structure at 2.5 Å resolution. J. Mol. Biol. 233:270–274. [DOI] [PubMed] [Google Scholar]
- 23.Yokoyama, T., S. Neya, A. Tsuneshige, T. Yonetani, S.-Y. Park, and J. R. H. Tame. 2006. R-state haemoglobin with low oxygen affinity: crystal structures of deoxy human and carbonmonoxy horse haemoglobin bound to the effector molecule L35. J. Mol. Biol. 356:790–801. [DOI] [PubMed] [Google Scholar]
- 24.Genick, U. K., G. E. Borgstahl, K. Ng, Z. Ren, C. Pradervand, P. M. Burke, V. Srajer, T. Y. Teng, W. Schildkamp, D. E. McRee, K. Moffat, and E. D. Getzoff. 1997. Millisecond time-resolved Laue crystallography: structure of a protein photcycle intermediate. Science. 275:1471–1475. [DOI] [PubMed] [Google Scholar]
- 25.Bourgeois, D., B. Vallone, F. Schotte, A. Arcovito, A. E. Miele, G. Sciara, M. Wullf, P. A. Anfinrud, and M. Brunori. 2003. Complex landscape of protein structural dynamics unveiled by nanosecond Laue crystallography. Proc. Natl. Acad. Sci. USA. 100:8704–8709. [DOI] [PMC free article] [PubMed] [Google Scholar]
- 26.Brunori, M., D. Bourgeois, and B. Vallone. 2004. The structural dynamics of myoglobin. J. Struct. Biol. 147:223–234. [DOI] [PubMed] [Google Scholar]
- 27.Mehanna, A. S., and D. J. Abraham. 1990. Comparison of crystal and solution hemoglobin binding of selected antigelling agents and allosteric modifiers. Biochemistry. 29:3944–3952. [DOI] [PubMed] [Google Scholar]
- 28.Karplus, M., and J. A. McCammon. 2002. Molecular dynamics simulations of biomolecules. Nat. Struct. Biol. 9:646–653. [DOI] [PubMed] [Google Scholar]
- 29.Karplus, M., and J. Kuriyan. 2005. Molecular dynamics and protein function. Proc. Natl. Acad. Sci. USA. 102:6679–6685. [DOI] [PMC free article] [PubMed] [Google Scholar]
- 30.Hünenberger, P. H., A. E. Mark, and W. F. van Gunsteren. 1995. Fluctuation and cross-correlation analysis of protein motions observed in nanosecond molecular dynamics simulations. J. Mol. Biol. 252:492–503. [DOI] [PubMed] [Google Scholar]
- 31.Elber, R. 2005. Long-timescale simulation methods. Curr. Opin. Struct. Biol. 15:151–156. [DOI] [PubMed] [Google Scholar]
- 32.Bettati, S., A. Mozzarelli, G. L. Rossi, A. Tsunehige, T. Yonetani, W. A. Eaton, and E. R. Henry. 1996. Oxygen binding by single crystals of hemoglobin: the problem of cooperativity and inequivalence of α and β subunits. Proteins. 25:425–437. [DOI] [PubMed] [Google Scholar]
- 33.Gao, J., K. Kuczera, B. Tidor, and M. Karplus. 1989. Hidden thermodynamics of mutant proteins: a molecular dynamics analysis. Science. 244:1069–1072. [DOI] [PubMed] [Google Scholar]
- 34.Henry, E. R., M. Levitt, and W. A. Eaton. 1985. Molecular dynamics simulation of photodissociation of carbon monoxide from hemeoglobin. Proc. Natl. Acad. Sci. USA. 82:2034–2038. [DOI] [PMC free article] [PubMed] [Google Scholar]
- 35.Ramadas, N., and J. M. Rifkind. 1999. Molecular dynamics of human methemoglobin: the transmission of conformational information between subunits in an αβ dimer. Biophys. J. 76:1796–1811. [DOI] [PMC free article] [PubMed] [Google Scholar]
- 36.Mouawad, L., D. Perahia, C. H. Robert, and C. Guilbert. 2002. New insights into the allosteric mechanism of human hemoglobin from molecular dyanmics simulations. Biophys. J. 82:3224–3245. [DOI] [PMC free article] [PubMed] [Google Scholar]
- 37.Saito, M., and I. Okazaki. 2007. A 45-ns molecular dynamics simulation of hemoglobin in water by vectorizing and parallelizing COSMOS90 on the earth simulator: dynamics of tertiary and quaternary structures. J. Comput. Chem. 28:1129–1136. [DOI] [PubMed] [Google Scholar]
- 38.Laberge, M., I. Kövesi, T. Yonetani, and J. Fidy. 2005. R-state hemoglobin bound to heterotropic effectors: models of the DPG, IHP and RSR13 binding sites. FEBS Lett. 579:627–632. [DOI] [PubMed] [Google Scholar]
- 39.Kövesi, I., G. Schay, T. Yonetani, M. Laberge, and J. Fidy. 2006. High pressure reveals that the stability of interdimeric contacts in the R- and T-state of HbA is influenced by allosteric effectors: insights from computational simulations. Biochim. Biophys. Acta. 1764:516–521. [DOI] [PubMed] [Google Scholar]
- 40.Ichiye, T., and M. Karplus. 1991. Collective motions in proteins: a covariance analysis of atomic fluctuations in molecular dynamics and normal mode simulations. Proteins Struct. Funct. Genet. 11:205–217. [DOI] [PubMed] [Google Scholar]
- 41.Levy, R., A. Srinivasan, W. Olson, and J. A. McCammon. 1984. Quasi-harmonic method for studying very low frequency modes in proteins. Biopolymers. 23:1099–1112. [DOI] [PubMed] [Google Scholar]
- 42.Garcia, A. E. 1992. Large-amplitude nonlinear motions in proteins. Phys. Rev. Lett. 68:2696–2699. [DOI] [PubMed] [Google Scholar]
- 43.Amadei, A., A. B. M. Linssen, and H. J. C. Berendsen. 1993. Essential dynamics of proteins. Proteins. 17:412–425. [DOI] [PubMed] [Google Scholar]
- 44.Hayward, S., A. Kitao, and N. Go. 1994. Harmonic and anharmonic aspects in the dynamics of BPTI: a normal mode analysis and principal component analysis. Protein Sci. 3:936–943. [DOI] [PMC free article] [PubMed] [Google Scholar]
- 45.Amadei, A., A. B. M. Linssen, B. L. de Groot, D. M. van Aalten, and H. J. C. Berendsen. 1996. An efficient method for sampling the essential subspace of proteins. J. Biomol. Struct. Dyn. 13:615–625. [DOI] [PubMed] [Google Scholar]
- 46.Hayward, S., and N. Go. 1995. Collective variable description of native protein dynamics. Annu. Rev. Phys. Chem. 46:223–250. [DOI] [PubMed] [Google Scholar]
- 47.van Aalten, D. M. F., B. L. De Groot, J. B. C. Findlay, H. J. C. Berendsen, and A. Amadei. 1997. A comparison of techniques for calculating protein essential dynamics. J. Comput. Chem. 18:169–181. [Google Scholar]
- 48.Amadei, A., M. A. Ceruso, and A. Di Nola. 1999. On the convergence of the conformational coordinates basis set obtained by the essential dynamics analysis of proteins' molecular dynamics simulations. Proteins Struct. Funct. Genet. 36:419–424. [PubMed] [Google Scholar]
- 49.Arcangeli, C., A. R. Bizzarri, and S. Cannistraro. 2001. Concerted motions in copper plastocyanin and azurin: an essential dynamics study. Biophys. Chem. 90:45–56. [DOI] [PubMed] [Google Scholar]
- 50.van der Spoel, D., B. L. de Groot, S. Hayward, H. J. C. Berendsen, and H. J. Vogel. 1996. Bending of the calmodulin central helix: a theoretical study. Protein Sci. 5:2044–2053. [DOI] [PMC free article] [PubMed] [Google Scholar]
- 51.van Aalten, D. M. F., A. Amadei, B. M. Linssen, V. G. H. Eijsink, G. Vriend, and H. J. C. Berendsen. 1995. The essential dynamics of thermolysin: confirmation of the hinge-bending motion and comparison of simulations in vacuum and water. Proteins. 22:45–54. [DOI] [PubMed] [Google Scholar]
- 52.de Groot, B. L., X. Daura, A. E. Mark, and H. Grubmüller. 2001. Essential dynamics of reversible peptide folding: memory-free conformational dynamics governed by internal hydrogen bonds. J. Mol. Biol. 309:299–313. [DOI] [PubMed] [Google Scholar]
- 53.Roccatano, D., A. E. Mark, and S. Hayward. 2001. Investigation of the mechanism of domain closure in citrate synthase by molecular dynamics simulation. J. Mol. Biol. 310:1039–1053. [DOI] [PubMed] [Google Scholar]
- 54.Daidone, I., A. Amadei, D. Roccatano, and A. Di Nola. 2003. Molecular dynamics simulation of protein folding by essential dynamics sampling: folding landscape of horse heart cytochrome c. Biophys. J. 85:2865–2871. [DOI] [PMC free article] [PubMed] [Google Scholar]
- 55.Daidone, I., D. Roccatano, and S. Hayward. 2004. Investigating the accessibility of the closed domain conformation of citrate synthase using essential dynamics sampling. J. Mol. Biol. 339:515–525. [DOI] [PubMed] [Google Scholar]
- 56.Chen, C., Y. Xiao, and L. Zhang. 2005. A directed essential dynamics simulation of peptide folding. Biophys. J. 88:3276–3285. [DOI] [PMC free article] [PubMed] [Google Scholar]
- 57.Bossa, C., A. Amadei, I. Daidone, M. Anselmi, B. Vallone, M. Brunori, and A. Di Nola. 2005. Molecular dynamics simulation of sperm whale myoglobin: effects of mutations and trapped CO on the structure and dynamics of cavities. Biophys. J. 89:465–474. [DOI] [PMC free article] [PubMed] [Google Scholar]
- 58.Rigden, D. J., J. E. Littlejohn, H. V. Joshi, B. L. de Groot, and M. J. Jedrzejas. 2006. Alternate structural conformations of Streptococcus pneumoniae hyaluronan lyase: insights into enzyme flexibility and underlying molecular mechanism of action. J. Mol. Biol. 358:1165–1178. [DOI] [PubMed] [Google Scholar]
- 59.Kubitzki, M. B., and B. L. de Groot. 2007. Molecular dynamics simulations using temperature-enhanced essential dynamics replica exchange. Biophys. J. 92:4262–4270. [DOI] [PMC free article] [PubMed] [Google Scholar]
- 60.Shaanan, B. 1983. Structure of human oxyhaemoglobin at 2.1 A resolution. J. Mol. Biol. 171:31–59. [DOI] [PubMed] [Google Scholar]
- 61.Fermi, G., M. F. Perutz, and B. Shaanan. 1984. The crystal structure of human deoxyhaemoglobin at 1.74 Å resolution. J. Mol. Biol. 175:159–174. [DOI] [PubMed] [Google Scholar]
- 62.Park, S. Y., T. Yokoyama, N. Shibayama, Y. Shiro, and J. R. Tame. 2006. 1.25 Å resolution crystal structures of human haemoglobin in the oxy, deoxy and carbonmonoxy forms. J. Mol. Biol. 360:690–701. [DOI] [PubMed] [Google Scholar]
- 63.Colombo, M. F., D. C. Rau, and V. A. Parsegian. 1994. Reevaluation of chloride's regulation of hemoglobin oxygen uptake: the neglected contribution of protein hydration in allosterism. Proc. Natl. Acad. Sci. USA. 91:10517–10520. [DOI] [PMC free article] [PubMed] [Google Scholar]
- 64.Schmidt, M. W., K. K. Baldridge, J. A. Boatz, S. T. Elbert, M. S. Gordon, J. H. Jensen, S. Koseki, N. Matsunaga, K. A. Nguyen, S. Su, T. L. Windus, M. Dupuis, and J. A. Montgomery. 1993. General atomic and molecular electronic structure system. J. Comput. Chem. 14:1347–1363. [Google Scholar]
- 65.MacKerell, A. D., Jr., B. Brooks, C. L. Brooks III, L. Nilsson, B. Roux, Y. Won, and M. Karplus. 1998. CHARMM: the energy function and its parameterization with an overview of the program. In Encyclopedia of Computational Chemistry. P. R. Schleyer, editor. John Wiley & Sons, Chichester, UK. 271–277.
- 66.Brooks, B. R., R. E. Bruccoleri, B. D. Olafson, D. J. States, S. Swaminathan, and M. Karplus. 1983. CHARMM: A program for macromolecular energy, minimization and dynamics calculations. J. Comput. Chem. 4:187–217. [Google Scholar]
- 67.Nelson, M., W. Humphrey, A. Gursoy, A. Dalke, L. Kale, R. D. Skeel, and K. Schulten. 1996. NAMD—a parallel, object oriented molecular dynamics programs. Int. J. Supercomput. Appl. 10:251–268. [Google Scholar]
- 68.Grubmuller, H. 1996. SOLVATE, version 1.0. Theoretical Biophysics Group, Institute for Medical Optics. Ludwig-Maximilians Universität, München, Germany.
- 69.Essmann, U., L. Perera, M. L. Berkowitz, T. Darden, H. Lee, and L. G. Pedersen. 1995. A smooth particle mesh Ewald method. J. Chem. Phys. 103:8577–8593. [Google Scholar]
- 70.Yang, C., G. S. Jas, and K. Kuczera. 2001. Structure and dynamics of calcium-activated calmodulin in solution. J. Biomol. Struct. Dyn. 19:247–271. [DOI] [PubMed] [Google Scholar]
- 71.Hoover, W. G. 1985. Canonical dynamics: equilibrium phase-space distributions. Phys. Rev. A. 31:1695–1697. [DOI] [PubMed] [Google Scholar]
- 72.Feller, S. E., Y. Zhang, R. W. Pastor, and B. R. Brooks. 1995. Constant pressure molecular dynamics simulation: the Langevin piston method. J. Chem. Phys. 103:4613–4621. [Google Scholar]
- 73.McLachlan, A. D. 1979. Gene duplications in the structural evolution of chymotrypsin. J. Mol. Biol. 128:49–79. [DOI] [PubMed] [Google Scholar]
- 74.Humphrey, W., A. Dalke, and K. Schulten. 1996. VMD: visual molecular dynamics. J. Molec. Graphics. 14:33–38. [DOI] [PubMed] [Google Scholar]
- 75.Mongan, J. 2004. Interactive essential dynamics. J. Comput. Aid. Mol. Des. 18:433–436. [DOI] [PubMed] [Google Scholar]
- 76.Balog, E., M. Laberge, and J. Fidy. 2007. Molecular dynamics simulation reveals correlated domain motions in yeast phosphoglycerate kinase. Biophys. J. 92:1709–1716. [DOI] [PMC free article] [PubMed] [Google Scholar]
- 77.de Groot, B. L., D. M. F. van Aalten, A. Amadei, and H. J. C. Berendsen. 1996. The consistency of large concerted motions in proteins in molecular dynamics simulations. Biophys. J. 71:1707–1713. [DOI] [PMC free article] [PubMed] [Google Scholar]
- 78.Wlodek, S. T., T. W. Clark, L. R. Scott, and J. A. McCammon. 1997. Molecular dynamics of acetylcholinesterase dimer complexed with tacrine. J. Am. Chem. Soc. 119:9513–9522. [Google Scholar]
- 79.Arora, K., and T. Schlick. 2004. In silico evidence for DNA polymerase-β's substrate-induced conformational change. Biophys. J. 87:3088–3099. [DOI] [PMC free article] [PubMed] [Google Scholar]
- 80.Amadei, A., B. L. de Groot, M. A. Ceruso, M. Paci, A. Di Nola, and H. J. C. Berendsen. 1999. A kinetic model for the internal motions of proteins: diffusion between multiple harmonic wells. Proteins Struct. Funct. Genet. 35:283–292. [PubMed] [Google Scholar]
- 81.Spezia, R., M. Aschi, A. D. Nola, M. D. Valentin, D. Carbonera, and A. Amadei. 2003. The effect of protein conformational flexibility on the electronic properties of a chromophore. Biophys. J. 84:2805–2813. [DOI] [PMC free article] [PubMed] [Google Scholar]
- 82.Elber, R., and M. Karplus. 1990. Enhanced sampling in molecular dynamics: use of the time-dependent Hartree approximation for a simulation of carbon monoxide diffusion through myoglobin. J. Am. Chem. Soc. 112:9161–9175. [Google Scholar]
- 83.Horta, B. A. C., J. J. V. Cirino, and R. B. de Alencastro. 2007. Dynamical behavior of the vascular endothelial growth factor: biological implications. Proteins Struct. Funct. Genet. 67:517–525. [DOI] [PubMed] [Google Scholar]
- 84.Merlino, A., L. Vitagliano, M. A. Antoine Ceruso, and L. Mazzarella. 2003. Subtle functional collective motions in pancreatic-like ribonucleases: from ribonuclease A to angiogenin. Proteins. 53:101–110. [DOI] [PubMed] [Google Scholar]
- 85.Eaton, W. A., E. R. Henry, J. Hofrichter, S. Bettati, C. Viappiani, and A. Mozzarelli. 2007. Evolution of allosteric models for hemoglobin. IUBMB Life. 59:586–599. [DOI] [PubMed] [Google Scholar]
- 86.Frauenfelder, H., S. G. Sligar, and P. G. Wolynes. 1991. The energy landscape and motions of proteins. Science. 254:1598–1603. [DOI] [PubMed] [Google Scholar]
- 87.Steinbach, P. J., A. Ansari, J. Berendsen, D. Braunstein, K. Chu, B. R. Cowen, D. Ehrenstein, H. Frauenfelder, J. B. Johnson, and D. C. Lamb. 1991. Ligand binding to heme proteins: connection between dynamcis and function. Biochemistry. 30:3988–4001. [DOI] [PubMed] [Google Scholar]
- 88.Lalezari, I., P. Lalezari, C. Poyart, M. Marden, J. Kister, B. Bohn, G. Fermi, and M. F. Perutz. 1990. New effectors of human hemoglobin: structure and function. Biochemistry. 29:1515–1523. [DOI] [PubMed] [Google Scholar]
- 89.Marden, M. C., B. Bohn, J. Kister, and C. Poyart. 1990. Effectors of hemoglobin. Biophys. J. 57:397–403. [DOI] [PMC free article] [PubMed] [Google Scholar]
- 90.Coletta, M., M. Angeletti, P. Ascenzi, A. Bertollini, S. della Longa, G. de Sanctis, A. M. Priori, R. Santucci, and G. Amiconi. 1999. Coupling the oxygen-linked interaction energy for inositol hexakisphosphate and bezafibrate binding to human HbA. J. Biol. Chem. 274:6865–6874. [DOI] [PubMed] [Google Scholar]
- 91.Gogonea, V., D. Suarez, A. van der Vaart, and K. M. Merz, Jr. 2001. New developments in applying quantum mechanics to proteins. Curr. Opin. Struct. Biol. 11:217–223. [DOI] [PubMed] [Google Scholar]
- 92.Hopfield, J. J. 1973. Relation between structure, cooperativity and spectra in a model of hemoglobin action. J. Mol. Biol. 77:207–222. [DOI] [PubMed] [Google Scholar]
- 93.Gelin, B. R., A. W.-M. Lee, and M. Karplus. 1983. Hemoglobin tertiary structural change on ligand binding. Its role in the co-operative mechanism. J. Mol. Biol. 171:489–559. [DOI] [PubMed] [Google Scholar]
- 94.Cooper, A., and D. T. F. Dryden. 1984. Allostery without conformational change: a plausible model. Eur. J. Biochem. 11:103–109. [DOI] [PubMed] [Google Scholar]
- 95.Shelnutt, J. A. 2000. Molecular simulations and normal coordinate structural analysis of porphyrins and heme proteins. In The Porphyrin Handbook. K. M. Kadish, K. M. Smith, and R. Guilard, editors. Academic Press, New York. 167–224.
- 96.Laberge, M., T. Yonetani, and J. Fidy. 2003. Normal coordinate decomposition of the heme distortions of hemoglobin in various quaternary states and bound to allosteric effectors. Mol. Divers. 7:15–23. [DOI] [PubMed] [Google Scholar]
- 97.Victor, K., A. Van-Quynh, and R. G. Bryant. 2005. High frequency dynamics in hemoglobin measured by magnetic relaxation dispersion. Biophys. J. 88:443–454. [DOI] [PMC free article] [PubMed] [Google Scholar]
- 98.Higgins, D., J. Thompson, T. Gibson, J. D. Thompson, D. G. Higgins, and T. J. Gibson. 1994. CLUSTAL W: improving the sensitivity of progressive multiple sequence alignment through sequence weighting,position-specific gap penalties and weight matrix choice. Nucleic Acids Res. 22:4673–4680. [DOI] [PMC free article] [PubMed] [Google Scholar]
- 99.Gouet, P., X. Robert, and E. Courcelle. 2003. ESPript/ENDscript: extracting and rendering sequence and 3D information from atomic structures of proteins. Nucleic Acids Res. 31:3320–3323. [DOI] [PMC free article] [PubMed] [Google Scholar]


