Abstract
The transport function of the Na pump (Na,K-ATPase) in cellular ion homeostasis involves both nucleotide binding reactions in the cytoplasm and alternating aqueous exposure of inward- and outward-facing ion binding sites. An osmotically active, nonpenetrating polymer (poly(ethyleneglycol); PEG) and a modifier of the aqueous viscosity (glycerol) were used to probe the overall and partial enzymatic reactions of membranous Na,K-ATPase from shark salt glands. Both inhibit the steady-state Na,K-ATPase as well as Na-ATPase activity, whereas the K+-dependent phosphatase activity is little affected by up to 50% of either. Both Na,K-ATPase and Na-ATPase activities are inversely proportional to the viscosity of glycerol solutions in which the membranes are suspended, in accordance with Kramers' theory for strong coupling of fluctuations at the active site to solvent mobility in the aqueous environment. PEG decreases the affinity for Tl+ (a congener for K+), whereas glycerol increases that for the nucleotides ATP and ADP in the presence of NaCl but has little effect on the affinity for Tl+. From the dependence on osmotic stress induced by PEG, the aqueous activation volume for the Na,K-ATPase reaction is estimated to be ∼5–6 nm3 (i.e., ∼180 water molecules), approximately half this for Na-ATPase, and essentially zero for p-nitrophenol phosphatase. The change in aqueous hydrated volume associated with the binding of Tl+ is in the region of 9 nm3. Analysis of 15 crystal structures of the homologous Ca-ATPase reveals an increase in PEG-inaccessible water space of ∼22 nm3 between the E1-nucleotide bound forms and the E2-thapsigargin forms, showing that the experimental activation volumes for Na,K-ATPase are of a magnitude comparable to the overall change in hydration between the major E1 and E2 conformations of the Ca-ATPase.
INTRODUCTION
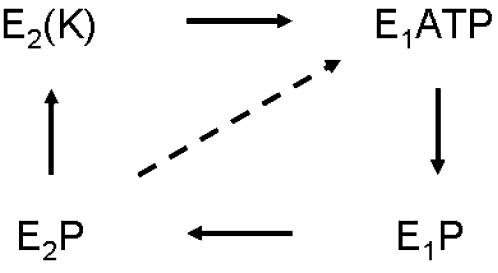
The sodium pump (Na,K-ATPase) maintains the necessary ionic balance of high K+ and low Na+ in almost all cells, including important specialized tissues such as nerve and kidney. The enzyme couples the hydrolysis of ATP to a vectorial transport of 3 Na+ ions out of the cell and 2 K+ ions into the cell per ATP utilized. An ultraminimal model of the transport cycle (reviewed in Møller et al. (1) and Kaplan (2)) is depicted below.
 |
SCHEME 1 |
In the presence of Na+ and Mg2+ (these ligands are omitted for clarity), the enzyme in the E1 form binds ATP, forming E1P, the first phosphorylated intermediate. A spontaneous conformational transition to E2P leads to extrusion of Na+; and in the presence of extracellular K+ the enzyme is rapidly dephosphorylated, leading to the so-called “occluded” state E2(K) in which bound K+ does not exchange rapidly with bulk K+. ATP—acting with low affinity—accelerates conversion of the enzyme from E2(K) to the E1ATP form with release of K+ on the cytoplasmic side, and this completes a Na,K-ATPase cycle. In the absence of K+, the E2P form dephosphorylates spontaneously (dashed line) to reform the E1ATP intermediate directly, and this constitutes a Na-ATPase cycle. The rate of Na,K-ATPase turnover at optimal ligand concentrations is typically 30-fold faster than is that of the Na-ATPase reaction.
Numerous biochemical experiments suggest large-scale conformational changes between the E1 and E2 conformations (see Møller et al. (1) and Kaplan (2)), both in the phosphorylated and in the dephosphorylated states. (For Ca-ATPase, these conformational changes are revealed by crystal structures of the different forms (3–10).) This biochemical evidence holds for the Na-ATPase reaction as well as for the overall Na,K-ATPase reaction, both of which are monitored in this study. The partial reactions studied include the occlusion of K+ (using 204Tl+ as a radiolabeled congener), which requires the E1 to E2 transition, and the high-affinity nucleotide binding reaction that takes place solely with the E1 form of the enzyme, which is the protein conformation in the presence of Na+. The enzyme can also perform a K-dependent phosphatase reaction (K-pNPPase) that is thought to be associated solely with the E2(K) form, which is the dominant protein conformation in K+-containing media.
The ATP binding site of the Na,K-ATPase is accessible to the aqueous environment on the cytoplasmic side of the membrane, and the E1-E2 conformational change involves alternating exposure of inward- and outward-facing ion binding sites in the transmembrane section of the protein. Manipulation of the aqueous environment therefore offers an effective means to probe these essential features of the enzymatic cycle. On the one hand, osmotic stress induced by sterically excluded polymers can be used to study the influence of hydration on enzyme activity, ligand binding, and conformational changes (11,12). On the other hand, variation of the external viscosity gives information on the coupling of protein fluctuations to the solvent (13,14).
In this work, the effects of poly(ethyleneglycol) (PEG) and glycerol on overall and partial enzymatic reactions of Na,K-ATPase from shark salt glands are used to study the influence of osmotic stress and solvent viscosity, respectively. The nonpenetrant polymer PEG-4000 will be excluded from functionally significant osmotically active compartments to which glycerol is still accessible. Hence, it is anticipated that PEG will have a far greater osmotic effect than does glycerol (15). On the other hand, PEG is also excluded from the protein outer surface (16) and therefore, unlike glycerol, is not expected to exhibit a viscous coupling to fluctuations at the protein active site. This expectation that PEG will exert its effect on the enzyme activity by osmotic pressure (15,16), whereas that of glycerol arises primarily from modification of solvent viscosity (17,18), is supported by the measurements reported below. Equilibrium measurements, such as those of binding constants, do not depend on viscosity and are less affected by glycerol.
Enzymatic reactions that likely involve large-scale conformational changes, e.g., overall Na,K-ATPase and the Na-ATPase, are most affected by osmotic stress and viscosity, whereas the K-pNPPase reaction, which is not accompanied by conformational transitions, is much less perturbed by PEG and glycerol. The deocclusion reaction E2(Tl) → E1 + Tl+ appears to be accompanied by a change in hydration similar to that of the overall Na,K-ATPase, whereas the nucleotide binding reaction, which is thought to take place in the E1 form without an associated conformational transition (E1 +ATP ↔ E1ATP), is found to involve very little change in hydration of the protein.
The results are discussed in terms of the size of water-filled cavities and channels that are revealed by analysis of the known three-dimensional structures of the homologous Ca-ATPase (SERCA 1) in different conformational states. The results suggest that large changes in hydration of the Na,K-ATPase occur during the catalytic cycles and cation occlusion reactions, involving several hundreds of water molecules, some possibly located near the phosphorylation site.
MATERIALS AND METHODS
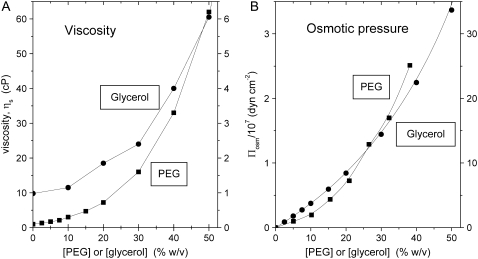
PEG with an average molecular weight of 4000 was obtained from Hampton Research (Aliso Viejo, CA), and analytical grade glycerol was from Merck (Darmstadt, Germany). [14C]ADP and [14C]ATP were from Perkin Elmer Life Sciences (Boston, MA), and [3H]glucose was from Amersham Biosciences (Hilleroed, Denmark). 204Tl+ was obtained from Risoe National Laboratory (Roskilde, Denmark). Osmotic pressures of aqueous PEG solutions were taken from the no longer functional Rand website at Brock University (19), and osmotic pressures of glycerol solutions were calculated from osmolalities given in Weast (20). Viscosities of glycerol and PEG solutions were measured as described previously (21); values at 23°C were interpolated from measurements at 10°C, 20°C, and 30°C. For reference, the osmotic pressures and viscosities of the PEG and glycerol solutions are given in Fig. 1. Concentrations of solutes, PEG or glycerol, are expressed throughout as wt/vol percentage (w/v%), i.e., g of solute in 100 ml of solution. This is related to the weight percentage, wt % = g solute in 100 g solution, used by Reid and Rand (15) by
 |
(1) |
where the partial specific volumes of PEG-4000 and water are  = 0.754 ml/g and
  = 1.006 ml/g at 20°C (derived from Hasse et al. (22)). The difference is 2% at the highest PEG concentration used (30% w/v).
FIGURE 1.
(A) Viscosity and (B) osmotic pressure of PEG-4000 (▪, left-hand ordinate) and glycerol (•, right-hand ordinate) aqueous solutions as a function of cosolvent composition (see text).
Enzyme preparation and assays
Membranous Na,K-ATPase was prepared from the salt gland of Squalus acanthias according to the method of Skou and Esmann (23), with the omission of the treatment with saponin. The specific activity ranged from 1500 to 1700 μmol ATP hydrolyzed/mg protein per hour when assayed at 37°C. Enzymatic activities and protein contents were determined as described previously (24). Assays of steady-state Na,K-ATPase (with 130 mM NaCl, 20 mM KCl, and 4 mM MgCl2 in the assay medium) or Na-ATPase (in 150 mM NaCl and 4 mM MgCl2) activities were performed for the these studies at 23°C by measuring phosphate liberation from ATP (3 mM in assay medium) with colorimetric methods (25,26). Steady-state K-pNPPase activity (150 mM KCl, 20 mM MgCl2, and 10 mM pNPP (p-nitrophenylphosphate) in the assay medium) was assayed at 23°C by following the increase in absorbance at 410 nm from liberation of p-nitrophenol. In all assays (duration 2–20 min) the pH was maintained at 7.2 with a 30 mM histidine buffer, and when required the assay medium also contained glycerol or PEG.
Binding of nucleotide
Equilibrium binding of ADP or ATP was measured in double-labeling filtration experiments, essentially as described previously (27). Before filtration of the Na,K-ATPase suspension, two stacked Millipore HAWP 0.45-μm filters (Millipore, Bedford, MA) were washed with 1 ml of buffer solution (30 mM NaCl and 10 mM histidine, adjusted to pH 7.0 with 0.65 mM CDTA (cyclohexane diamine tetraacetic acid)) containing glycerol or PEG, when required, but with neither radioactivity nor enzyme present. Na,K-ATPase was allowed to equilibrate at 20°C for 10 min in the same buffer that contained various concentrations of [14C]ADP or [14C]ATP and [3H]glucose and when required also 50% glycerol or 20% PEG. One milliliter of this enzyme suspension (usually 0.24–0.28 mg protein/ml) was loaded on the filters. Then, without rinsing, the filters were counted separately in 4 ml Packard Filtercount scintillation fluid (Packard, Groningen, The Netherlands). For each filter, the amount of nucleotide bound to the protein was calculated by subtracting from the total amount of nucleotide on the filter (bound plus unbound nucleotide) the amount of unbound nucleotide that was trapped in the filter together with the wetting fluid. The latter was taken to be proportional to the amount of [3H]glucose in the same filter. The concentration of free nucleotide in the suspension was then calculated by subtraction of the amount bound to the protein. In a typical experiment, the volume of the wetting fluid on the filter was ∼40 μl. At a concentration of 10 μM nucleotide (the largest used here), the amount of unbound nucleotide is thus 0.4 nmol, which is comparable to the amount of specifically bound nucleotide (∼0.3 nmol per filter). At a nucleotide concentration equal to Kd (0.1–0.3 μM), the correction for unbound nucleotide is thus only a small fraction of the bound nucleotide. The enzyme was fully retained on the upper filter, as indicated by the absence of protein in the eluate from separate single-filter experiments (data not shown). Counting the second filter, which thus did not contain Na,K-ATPase, also showed that there was no preferential binding of radiolabeled nucleotide to the filters relative to glucose. The binding data were analyzed by nonlinear least-squares fitting with a single term that is hyperbolic in the nucleotide concentration.
Binding of Tl+
The binding of 204Tl+ was measured using a method similar to that described above for nucleotide binding (28). Na,K-ATPase was allowed to equilibrate at 20°C for 30 min in a buffer containing 10 mM histidine (adjusted to pH 7.0 with 0.65 mM CDTA) and 5 mM Tris2SO4. The buffer also contained various concentrations of 204Tl+ and [3H]glucose and, when required, also 50% glycerol or 20% PEG. One milliliter of this suspension (usually 0.20–0.24 mg protein/ml) was loaded on three stacked Millipore HAWP 0.45-μm filters (which had been prewetted with 1 ml buffer solution as above). In contrast to the experiments with ADP and ATP, there is appreciable adsorption of Tl+ to the Millipore filters in the absence of protein. In addition, it was observed that for control enzyme a single filter retained all of the enzyme, but in the presence of PEG ∼40% of the protein could be detected in the eluate from a single filter (estimated from the absorbance at 280 nm after the addition of 1% sodium dodecyl sulfate). With glycerol ∼10–15% of the protein passed through a single filter.
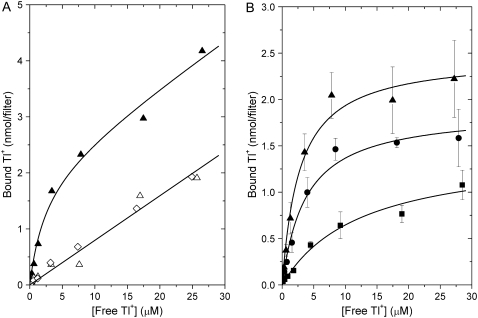
The binding of Tl+ to the control Na,K-ATPase membranes was calculated as the difference between Tl+ binding to the upper filter and to the second filter. The third filter served as an additional control and gave the same Tl+ binding as the second filter did (see Fig. 4 A). For binding Tl+ to membranes in 50% glycerol or 20% PEG, the second or third filters were not adequate controls for Tl+ adsorption due to protein leakage from the upper filter. Therefore, separate filtration experiments with various Tl+ (and [3H]glucose) concentrations and 50% glycerol or 20% PEG, but without Na,K-ATPase, were performed. Binding Tl+ to these filters served as controls for Tl+ adsorption to the filters, and the same Tl+ binding was observed for all three filters in the absence of enzyme. The specific binding of Tl+ to Na,K-ATPase was calculated as the difference between Tl+ binding to the upper filter with and without enzyme. A larger variation in Tl+ binding than in nucleotide binding was observed. The PEG and glycerol solutions are very viscous, and the duration of the filtration step is prolonged relative to that of the control enzyme. This, together with the three-filter setup for Tl+ binding, might contribute to the increased variability.
FIGURE 4.
Tl+ binding to Na,K-ATPase. (A) Na,K-ATPase in 5 mM Tris2SO4, 0.65 mM CDTA, and 10 mM histidine (pH 7.0) was equilibrated with 204Tl+ at the concentrations indicated, and 1 ml containing 0.225 mg protein was filtered through three stacked Millipore 0.45 μm-HAWP filters. The amount of Tl+ bound (in nmol) to the first (▴), second (Δ), and third (◊) filter is shown (see Materials and Methods). The solid lines are fits to Eq. 2, with a linear correction for adsorption on the filter. (B) Tl+ binding (nmol Tl+ per filter) to enzyme in buffer (▴) and to enzyme equilibrated with 50% (w/v) glycerol (•) or 20% (w/v) PEG (▪). Data are obtained from Tl+ binding to the first filter by subtracting that to the third filter, in the case of control enzyme, and by subtraction of Tl+ bound to filters in the absence of enzyme, in the case of samples containing PEG or glycerol (see Materials and Methods for further details). The symbols represent the average of four determinations. Solid lines are fits of Eq. 2, yielding the dissociation constants given in Table 1.
The data for specific binding of Tl+ to Na,K-ATPase (see Fig. 4 B) are fitted by a single hyperbolic function,
 |
(2) |
which gives the binding of Tl+ to the occlusion sites with capacity Bocc and dissociation constant Kd. Equilibrium dissociation constants derived from data fitting with Eq. 2 were compared using Student's test with unequal variance (t′).
Bioinformatic analysis
Crystal structures of the different forms of the Ca-ATPase were obtained from the Research Collaboratory for Structural Bioinformatics protein database (29), with Protein Data Bank (PDB) accession codes 1SU4 (3); 1IWO (4); 1T5S and 1T5T (5); 1XP5 (6); 1WPE and 1WPG (7); 1VFP (8); 2C88, 2C8K, and 2C8L (9); and 2EAR, 2EAS, 2EAT, and 2EAU (10). Potential water binding pockets were identified by using the PASS program (30). A probe radius of 0.18 nm and a burial count threshold of 5.5 nm were used to identify cavities. Dimensions of channels from internal water sites to the exterior aqueous environment were determined by using the Caver program (31). Structures were displayed using PyMOL software (32).
The core volume of protein was calculated using the Voidoo software package (33) with a probe sphere radius of 0.18 nm representing a water molecule. The volumes that are inaccessible to water (and thus represent the core of protein) are ∼208 nm3. Probing the protein surface with a sphere of radius 1.1 nm (corresponding to that of PEG-4000, assuming a molecular mass of 4000 Da and a density of 1.21 g/ml) yields volumes between 540 and 585 nm3, which are inaccessible to PEG. The volume that is accessible to water but inaccessible to PEG (calculated as the difference between the PEG-inaccessible and the water-inaccessible volumes) is thus in the range 332–377 nm3.
RESULTS
ATPase and pNPPase steady-state activities of the sodium pump
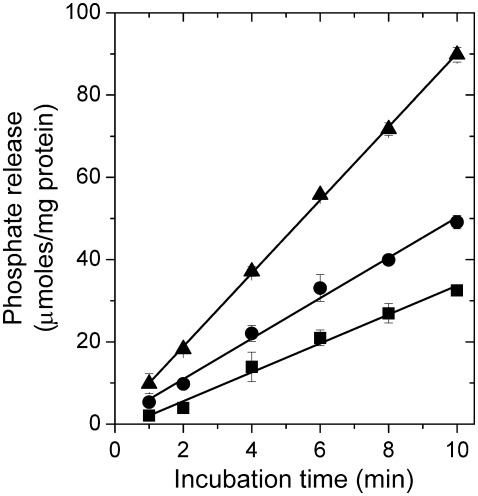
Fig. 2 shows the time course of product formation in the Na,K-ATPase reaction at 23°C for membranous enzyme suspended in aqueous solutions of PEG or glycerol with different cosolvent concentrations. The enzyme is inhibited in a concentration-dependent manner by the addition of PEG or glycerol, but the release of product still increases linearly with time under all conditions. Increasing the concentration of the substrate ATP from 3 mM to 4 mM did not increase the steady-state rate of hydrolysis in PEG or glycerol (data not shown), suggesting that the reduction in steady-state enzyme activity by these agents is not due to substrate limitation.
FIGURE 2.
Time course of phosphate release (μmoles per mg protein) on ATP hydrolysis at 23°C under Na,K-ATPase assay conditions (130 mM NaCl, 20 mM KCl, 4 mM MgCl2, 3 mM ATP, 30 mM histidine, pH 7.4) for enzyme suspended in assay buffer (▴), in assay buffer with 20% PEG (▪), or with 20% glycerol (•).
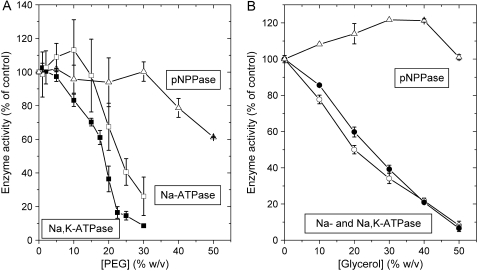
Fig. 3 shows the effects of PEG (panel A) and glycerol (panel B) during hydrolysis of ATP and pNPP at 23°C. For the overall Na,K-ATPase reaction, the steady-state activity is reduced to half by 18% (w/v) PEG and 27% (w/v) glycerol, respectively, whereas slightly higher concentrations of PEG are required to halve the Na-ATPase activity. Note that the profile of inactivation by PEG shows no obvious relation with the pattern of PEG-induced aggregation of the enzyme that is detected by saturation-transfer electron spin resonance (21). In contrast to the ATPase activities, the K-pNPPase activity is stimulated slightly by 30–40% (w/v) glycerol and not affected by PEG up to 30% (w/v). Steady-state hydrolysis rates for the Na-ATPase are the same at 3 and 4 mM ATP and were also the same at 10 and 13 mM pNPP for the phosphatase reaction. As for the Na,K-ATPase activity (see above), this suggests that the reduction in steady-state Na-ATPase and K-pNPPase activity by PEG or glycerol is not due to substrate limitation (data not shown).
FIGURE 3.
Effects of glycerol and PEG on steady-state enzyme activities at 23°C associated with the sodium pump. PEG (A) or glycerol (B) is present during turnover, and the activities for Na,K-ATPase (▪,•), Na-ATPase (□,○), and K-pNPPase (Δ) are given as percentages of the activity in the absence of glycerol or PEG. Averages of two to four determinations are given ± SD.
The effects of glycerol and PEG on the steady-state activities are fully reversible at the concentrations studied here. This was determined, after 5 min incubation, by dilution of the assay medium by a factor of three with PEG- or glycerol-free assay medium. A new steady-state rate was obtained, which was identical to that seen when the assay medium had these concentrations from the start of the assay period (data not shown).
Tl+ binding at equilibrium
Equilibrium binding of 204Tl+ to Na,K-ATPase membranes is shown in Fig. 4. In the absence of PEG or glycerol, the upper filter fully retains the membranes, together with a concentration-dependent amount of Tl+, as shown in Fig. 4 A. In the absence of membranes, the filters also absorb Tl+, as evidenced by the identical amounts of Tl+ associated with the second and third filters. The straight line through the data for the second and third filters has a slope of 0.080 nmol Tl+/filter per μM Tl+. The binding of Tl+ to the first filter is thus the sum of specific binding to the protein (Eq. 2) and adsorption on the filter. Subtraction of the amount of nonspecifically absorbed Tl+ on the third filter from that on the first filter, at each Tl+-concentration, leads to the binding curve for control enzyme that is shown in Fig. 4 B (solid triangles). This gives the average of four experiments and the corresponding fit by Eq. 2. Nonlinear regression for the enzyme in the absence of PEG or glycerol yields an occlusion capacity Bocc = 2.5 ± 0.1 nmol Tl+/filter and a dissociation constant Kd = 2.8 ± 0.5 μM. The latter is of the same order as the values reported for kidney enzyme (34).
For calculation of the specific binding of Tl+ in the presence of 50% glycerol or 20% PEG, the nonspecific adsorption of Tl+ to filters in the absence of enzyme was used as the reference for subtraction. The average of four such experiments for Na,K-ATPase membranes in 50% glycerol (solid circles) and 20% PEG (solid squares) are shown in Fig. 4 B. Values of Kd that result from hyperbolic fits to the Tl+ binding curves are listed in Table 1. The dissociation constant for binding to the Tl+ occlusion sites increases from ∼2.8 μM in buffer alone to 3.8 μM on addition of 50% (w/v) glycerol and to 12.5 μM with 20% (w/v) PEG (see Table 1). Statistical analysis shows that the probability that the value of Kd determined in 20% PEG is different from that for the control samples is larger than 99.5%, whereas the effect of 50% glycerol on Kd is much less significant (probability >95%).
TABLE 1.
Effects of PEG and glycerol on dissociation constants for ligand binding
|
Kd (μM)
|
|||
|---|---|---|---|
| Ligand | Buffer | 50% (w/v) glycerol | 20% (w/v) PEG |
| Tl+ | 2.8 ± 0.5 | 3.8 ± 0.7 | 12.5 ± 3.2 |
| ADP | 0.243 ± 0.009 | 0.148 ± 0.008 | 0.215 ± 0.032 |
| ATP | 0.173 ± 0.005 | 0.123 ± 0.015 | 0.162 ± 0.019 |
Na,K-ATPase membranes were suspended in buffer alone or with the indicated concentrations of glycerol or PEG at 23°C. For Tl+ binding, the buffer contained 5 mM Tris2SO4, 0.65 mM CDTA, and 10 mM histidine (pH 7.0). For ADP and ATP binding, the buffer contained 10 mM histidine (adjusted to pH 7.0 with 0.65 mM CDTA) and 30 mM NaCl. Dissociation constants were obtained as described in Materials and Methods.
The occlusion capacity of 2.5 nmol Tl+ per filter for enzyme in buffer corresponds to ∼10 nmol Tl+ per mg protein on the filter. The high affinity binding of nucleotides (see below) shows that this preparation contains ∼3 nmol ADP or ATP sites per mg protein. This corresponds to ∼3 occluded Tl+ ions per nucleotide site, which is larger than the two Tl+ expected from the transport stoichiometry (see below). We have previously observed ∼2 Tl+ ions occluded per nucleotide site by using a centrifugation technique, which allows a larger range of Tl+ concentrations to be tested. But in addition, the data indicated a large nonspecific low-affinity binding of Tl+ to the membranes (28,35). It is possible that the errors in the determination of Tl+ bound at high concentrations in the filter experiments obscure the nonspecific component. Using the data for nonspecific binding to shark enzyme from Jakobsen et al. (35), we estimate this to be ∼2.5 nmol/mg at 30 μM Tl+, which corresponds to almost one Tl+ per nucleotide binding site. To within experimental uncertainty, the Tl+ occlusion capacity in the presence of 50% glycerol or 20% PEG is similar to that of the control enzyme, but precision is severely limited by the differential retention of the protein on the filters.
Equilibrium nucleotide binding
The dissociation constants determined for high-affinity binding of ATP and ADP are listed, along with those for Tl+ occlusion, in Table 1. For high-affinity nucleotide binding, there is a small but significant effect of glycerol and no effect of PEG. The dissociation constant for ADP binding in buffer containing 30 mM Na+ is ∼0.24 μM, and the addition of 50% (w/v) glycerol results in a decrease to Kd = 0.15 μM (probability of a difference is larger than 99.9%). The addition of 20% (w/v) PEG, on the other hand, only causes a decrease in Kd to 0.22 μM. The binding capacity for ADP determined from single hyperbolic fitting of the data are 2.9 ± 0.2 nmol/mg protein for the enzyme in buffer and is not affected by glycerol or PEG. For ATP binding, the dissociation constant is smaller than that for ADP by a factor of 1.4, and again glycerol increases the affinity for nucleotide in a significant manner (probability of difference is larger than 99.8%), whereas PEG does not.
Modeling with Ca-ATPase structures
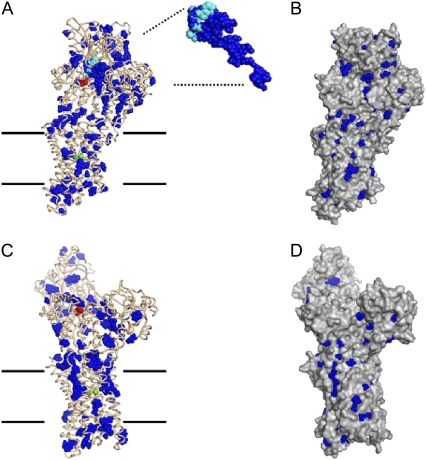
Fig. 5 shows the location of water-filled cavities in the crystal structures of the E1-Ca and E1-CaAMPPCP forms of the Ca-ATPase, as predicted by the PASS program (AMPPCP is a nonhydrolysable analog of ATP). The PASS software is developed to identify potential ligand binding sites in proteins, and these are characterized by water-filled pockets or internal cavities in the protein. The major internal cavity identified is that associated with the nucleotide binding site in the E1-CaAMPPCP form, which is located in the large cytoplasmic domain of the Ca-ATPase near the phosphorylation residue Asp-351. This cavity is indicated by the blue spheres of radius 0.18 nm (representing a water molecule) in Fig. 5. It is completely absent in the open, Ca-bound form that is shown in the lower row of Fig. 5. This feature is a characteristic of the large-scale conformational change between the two forms that is evident from comparing the structure in the upper row of Fig. 5 with that in the lower row. In the right-hand panels of Fig. 5, the same two protein conformations are shown with a nontransparent protein surface, revealing which of the water-filled cavities resolved by the PASS software are only on the surface of the protein and which are buried.
FIGURE 5.
Potential water binding pockets in the Ca-ATPase identified by the program PASS (30) using spheres of radius 0.18 nm. Left-hand column (A and C): protein backbone is shown as wires and water molecules as blue spheres. The phosphorylation site (Asp-351, red), the AMPPCP molecule (cyan), and the two bound Ca2+ ions (green) are indicated in space-filling representation. Right-hand column (B and D): protein is shown as surface contour and water molecules as blue spheres. Top row (A and B): E1-CaAMPPCP form (PDB code: 1T5S). The expanded view shows the major cluster of 386 spheres, together with AMPPCP. Lower row (C and D): E1-Ca form (PDB code: 1SU4).
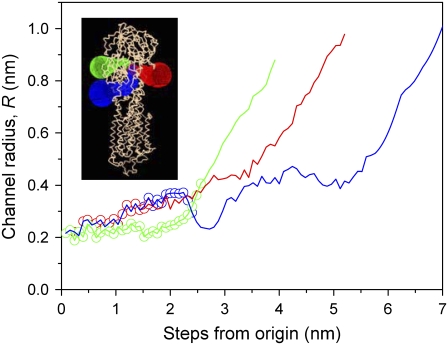
Fig. 6 shows the profiles of three channels from the phosphorylation site at Asp-351 to the exterior of the protein in the E1-CaAMPPCP form, as determined by the Caver program. For each channel, the radius is given as a function of the distance to Asp-351 along the escape path identified between the amino acid side chains of the protein. Segments of the green and blue channel (see inset in Fig. 6) correspond in part to the water-filled cavity that is identified by the PASS program (Fig. 5). The initial part of the third channel (red) is shared with the blue channel. Circles in Fig. 6 indicate how far the water-filled cavity identified by the PASS program extends from the origin of the Caver channels. The channels are sufficiently constricted (R ≈ 0.2–0.4 nm) as to exclude PEG-4000 (r ≈ 1.1 nm) but should be able to accommodate glycerol (r ≈ 0.3 nm) in addition to water. Therefore an osmotic effect can be expected with the former but not with the latter.
FIGURE 6.
Dimensions of the channels giving access to the phosphorylation site in the E1-CaAMPPCP form (PDB code: 1T5S) of the Ca-ATPase. Dependence of the channel radius, R, on the step distance from the phosphorylation site is determined using the Caver program (31). Circular symbols define the extent of the major water-filled cavity identified by the PASS program (see Fig. 5 A). The inset shows the surface of the channel for each pathway.
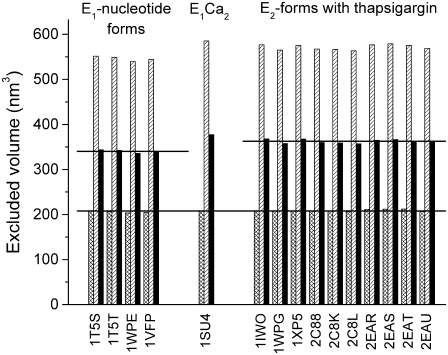
Differences in PEG accessibility that arise from the opening or closing of water channels and cavities can be determined most directly and accurately by using the Voidoo software (33), which precisely maps the surface inaccessible to a probe sphere of defined radius. This analysis was applied to the 15 available crystal structures of the different forms of the Ca-ATPase (3–10). Fig. 7 shows the core volumes of the protein calculated using a sphere of radius 0.18 nm representing a water molecule (cross-hatched bars). The average value for the 15 structures is 207.9 ± 2.4 nm3 (indicated by the lower horizontal line). Similarly, the volumes inaccessible to PEG are given by the hatched bars in Fig. 7. The volume that is accessible to water but inaccessible to PEG is shown for each conformation by the solid bars. The data are grouped into the E1-nucleotide forms (1T5S, 1T5T, 1WPE, 1VFP) and the E2-forms with thapsigargin bound (1IWO, 1WPG, 1XP5, 2C88, 2CK8, 2C8L, 2EAR, 2EAS, 2EAT, and 2EAU). The average PEG-inaccessible water space is 340.4 ± 3.5 nm3 for the E1-forms and 362.8 ± 4.1 nm3 for the E2-forms (indicated by horizontal lines in Fig. 7). The difference between these two average volumes is 22.4 ± 7.6 nm3, which represents an increase in hydration between the two major E1 and E2 conformational states of the Ca-ATPase (the probability of a difference is larger than 99.9%). The E1Ca2-form (1SU4) was omitted from this analysis because it represents an enzyme conformation different from the nucleotide-bound E1-forms and the thapsigargin-bound E2-forms.
FIGURE 7.
Analysis of hydration differences in Ca-ATPase crystal structures. For 15 Ca-ATPase structures (indicated by their PDB accession codes), the Voidoo software (33) was used to calculate the volume inaccessible to a water molecule (represented by a sphere of 0.18 nm radius; cross-hatched bars) and that inaccessible to a PEG molecule (sphere of 1.1 nm radius; hatched bars). The difference between these volumes is also shown for each Ca-ATPase structure (solid bars), and the average volumes are indicated by horizontal lines.
DISCUSSION
Both PEG and glycerol lead to decreased overall Na,K-ATPase activity of the enzyme, when present during turnover. For partial reactions such as K-dependent pNPPase, the effect is less pronounced; and for nucleotide binding, the affinity increases with the addition of glycerol. Tl+ binding affinity is reduced by the addition of PEG. The effects of glycerol on the Na,K-ATPase and pNPPase activities are in agreement with initial reports on the influence of glycerol on these reactions (36,37). We also find inhibition of the Na-ATPase activity by glycerol, which was not reported in earlier experiments.
An interpretation of these findings could be that enzymatic reactions involving large-scale conformational changes, e.g., overall Na,K-ATPase, are most affected by osmotic stress and viscosity. On the other hand, the K-pNPPase activity, which does not involve large-scale conformational transitions, is less perturbed by glycerol and PEG.
Influence of external viscosity on activity
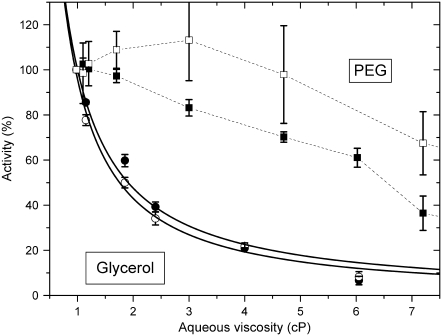
The dependences of the Na,K-ATPase and Na-ATPase activities on aqueous viscosity, in glycerol solutions, are shown in Fig. 8. Both activities are inversely proportional to the external viscosity, consistent with Kramers's theory under high friction (38). This theory characterizes the dependence of the reaction rate on viscosity of the immediate reaction volume. Its extension to proteins involves the coupling of local fluctuations at the active site (strictly speaking those involved with passage of the reaction through a rate-limiting transition state), which drive the enzymatic reaction (13), to the mobility of the solvent molecules (39,40). The dependence of the rate constant on solvent viscosity, ηs, can then be written more generally as (39)
 |
(3) |
where 0 ≤ ɛ ≤ 1, A and ɛ are independent of viscosity, and EA is the activation energy. At the high viscosity limit (ɛ = 1), variations in solvent mobility are fully transferred to the active site. The data analysis suggests values of ɛ ≈ 1, implying that the relevant transition state is strongly coupled to the glycerol environment for both the Na,K-ATPase and the Na-ATPase activities. For pNPPase, glycerol slightly activates rather than exercising a viscous drag (Fig. 3). In this latter case, a more direct involvement of glycerol in the activity is implied.
FIGURE 8.
Dependence of Na,K-ATPase (▪,•) and Na-ATPase (□,○) activities on viscosity, ηs, of the suspending glycerol (•,○) or PEG (▪,□) solutions. Solid lines are nonlinear, least-squares fits of a  dependence from Eq. 3 to the glycerol data with ɛ = 1.07 ± 0.11 and 1.16 ± 0.07 for Na,K-ATPase and Na-ATPase, respectively. Dotted lines through the PEG data are only to guide the eye.
In comparison, PEG at the same aqueous viscosity affects the Na,K-ATPase and Na-ATPase activity much less than does glycerol (see, e.g., the activities at 4 cP in Fig. 8). Also, the reduction in activity by PEG does not correspond to an inverse dependence on solvent viscosity (Fig. 8). Therefore, the effects of PEG on external viscosity are less efficiently transferred (if at all) to the active center (or centers) than are those of glycerol. This result is expected because, as already noted in the Introduction, the PEG polymer is excluded from the hydration shells immediately surrounding the protein (16).
Polymer-inaccessible activation volume
If PEG is excluded from a reaction volume to a greater extent than is glycerol, then the activity is expected to display an exponential, Boltzmann law dependence on the polymer osmotic pressure, Πosm, from which the water contribution to the activation volume, Δv*, may be determined (11,12). The rate of an elementary reaction step depends on pressure according to the expression (∂ ln k/∂p)T = −ΔV‡/RT (41,42), which leads to the following relation between the activity k and the osmotic pressure Πosm,
 |
(4) |
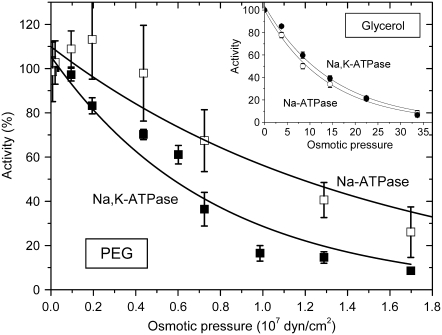
where ko is the activity in the absence of polymer, kB is Boltzmann's constant, and T is the absolute temperature. Δv* is the difference in polymer-inaccessible volume between the initial state and the effective transition state of the enzyme. Fig. 9 shows the Na,K-ATPase and Na-ATPase activities as a function of osmotic pressure of the PEG solutions, which are derived from the data given in Fig. 3. The dependence on osmotic pressure is approximately exponential, as expected for an osmotically active compartment that is essential for activity, and not the sigmoidal form that might be expected if activity depended on, for instance, an association-dissociation reaction (43). From the exponential fit to the osmotic pressure dependence of the Na,K-ATPase activities in PEG solutions, a contribution to the activation volume of Δν* = 5.3 ± 0.5 nm3 is deduced from Eq. 4, which translates to an increase in hydration by ∼185 water molecules. The value of Δv* is approximately half this for Na-ATPase and for the pNPPase activity corresponds to only one water molecule (Fig. 3). For comparison, the increase in internal water volume deduced from osmotic stress experiments on the opening of the voltage-dependent anion channel is in the range 22–48 nm3 (12). The latter corresponds to the opening of a large transmembrane pore (diameter 2–4 nm), in contrast to the more limited conformational changes associated with cation transport by the Na,K-ATPase. Changes in activation volume are less straightforward to interpret than reaction volume changes involved in simple equilibrium binding experiments. Nonetheless, it seems likely that they may be related in some rather direct manner to differences in volume of water-filled cavities between the various catalytic intermediates of the enzyme. Predictions from structures of the closely related Ca-ATPase in different conformational states (Fig. 7) yield volume differences that are of a similar order of magnitude (22 ± 8 nm3) to that determined for the activation volume associated with Na,K-ATPase activity (5.3 ± 0.5 nm3), supporting this interpretation.
FIGURE 9.
Dependence of Na,K-ATPase (▪) and Na-ATPase (□) activities on osmotic pressure of the suspending PEG solutions. Solid lines are nonlinear least-squares fits of a Boltzmann factor (see Eq. 4), yielding kBT/Δν* = 0.77 ± 0.08 × 10⁷ and 1.60 ± 0.40 × 10⁷ dyn cm−2 for Na,K-ATPase and Na-ATPase, respectively. (Inset) Corresponding data for glycerol solutions (Na,K-ATPase, •; Na-ATPase, ○). Note the extended osmotic pressure axis.
The dependence of the Na,K-ATPase and Na-ATPase activities on osmotic pressure for membranes suspended in glycerol solutions is given by the inset to Fig. 9. In contrast to the dependence on viscosity, glycerol at the same osmotic pressure is far less effective in reducing activity than is PEG. Exponential fits yield effective contributions to the activation volume that correspond to only 9–10 water molecules. This suggests that the effect of glycerol on activity is not via osmotic pressure and is consistent with the results of Fig. 6, which show that the principal internal cavities (in addition to the superficial ones) are accessible to glycerol. The principal effect of glycerol on Na,K-ATPase and Na-ATPase activities, therefore, appears to be one of viscosity, as indicated in Fig. 8.
Ligand binding
Viscosity cannot affect an equilibrium thermodynamic property such as the dissociation constant for ligand binding (44). Osmotic stress, however, can shift the binding equilibrium. An exponential dependence on polymer osmotic pressure is expected for ligand binding, if PEG is excluded from the reaction volume (11). If ΔV is the volume of water displaced on binding, then the dissociation constant is given by
 |
(5) |
where  is the dissociation constant in the absence of polymer. From the data in Table 1, the increase in volume is ΔV = 8.7 ± 1.2 nm3 for Tl+ binding, which corresponds to an enhancement in hydration by 290 ± 40 water molecules. If the sole effect of PEG is due to osmotic stress (and not through a conformational effect on the enzyme), this suggests that the deocclusion reaction E2(Tl) → E1 + Tl+ involves a release of 290 water molecules.
Again, this volume change is comparable to the increase in volume of water-filled cavities and channels that are associated with structures of the Ca-ATPase in different E1 and E2 conformational states (see above and Fig. 7). This is in further agreement with the suggestion given above that the inactivation by PEG is primarily an osmotic effect.
On the other hand, PEG has no significant effect on nucleotide binding (see Table 1). This suggests that there is little difference in amount of PEG-inaccessible water between the E1Na and E1NaATP states, as might be expected for a simple association-dissociation equilibrium. The difference between E1Na and E1NaATP is currently believed to lie in the dynamics of the N-to-P domain movements, where the binding of the nucleotide—in the absence of phosphorylation—increases or facilitates the domain movements (6,45). In the NP-docked state, the phosphorylation with Mg2+ present can then occur, leading to the hydrolysis reaction. Presumably the tight docking of N-to-P occurs together with phosphorylation, and in this state a considerable number of water molecules are trapped around the phosphorylation site, as visualized in Fig. 5 A.
Treating the glycerol data from Table 1 in the same way leads to an increase in glycerol-inaccessible volume by only one water molecule on Tl+ binding, which is statistically not significant. The much larger change registered by PEG corresponds to changes in global hydration resulting from conformational changes induced by cation occlusion. The change in hydration registered by PEG of molecular weight ≥1000, on glucose binding to hexokinase, corresponds to 326 waters per monomer but is reduced to 50 waters for PEG of molecular weight 300 (15), which together with the results of Fig. 6 supports the above interpretation. The small but measurable effect of glycerol on nucleotide binding would correspond to a decrease in hydration by ∼13–24 water molecules, if these were contained in a glycerol-inaccessible pocket. However, the similarity in size of glycerol and water, relative to a nucleotide molecule, suggests that the increased affinity might instead be a direct effect of hydration by glycerol in the binding site. Overall, the small size of the effects of glycerol on the ligand binding reactions adds further support to the interpretation given above that the reduction in enzyme activity by glycerol results from modification of solvent viscosity.
CONCLUSION
The overall enzymatic activities of the sodium pump, the Na,K-ATPase and the Na-ATPase reactions, are associated with large changes in hydration volumes involving several hundreds of water molecules. These are probably buried within the protein, and a possible candidate is a large cluster of water molecules near the phosphorylation site that is identified in Ca-ATPase crystals in the E1AMPPCP form. Interestingly also, the occlusion of Tl+ involves a major increase in hydration, suggesting a large rearrangement in the protein conformation associated with the Tl+ binding process. Both the Na,K-ATPase and the Na-ATPase activities are inversely proportional to the viscosity of glycerol solutions, which suggests that the transphosphorylation reactions are strongly coupled to fluctuations in the protein structure that transmit the dynamic effects of the solvent molecules. A similar mechanism, but operating within the membrane, might also contribute to the difference between the temperature dependences of the activity of Na,K-ATPase from mammalian sources and from shark salt glands (46). The lipid bilayer viscosity as well as the activation energy is lower for shark enzyme (EA ≈ 90 kJ/mol) than for kidney and brain enzymes (EA ≈ 120 kJ/mol), supporting the idea that enzyme turnover is modulated by the bilayer properties.
SUPPLEMENTARY MATERIAL
To view all of the supplemental files associated with this article, visit www.biophysj.org.
Acknowledgments
The authors thank Ms. Angelina Damgaard, Ms. Birthe Bjerring Jensen, and Ms. Anne Lillevang for excellent technical assistance, and Jesper V. Møller and Poul Nissen for helpful suggestions. Jarl Underhaug, Claus Olesen, and Peter J. H. Esmann were helpful in the analysis using Caver, Voidoo, and PyMOL software.
This work was supported by the Danish Medical Research Council (grant No. 52-00-0914 to M.E.) and the Aarhus University Research Foundation.
Editor: David D. Thomas.
References
- 1.Møller, J. V., B. Juul, and M. le Maire. 1996. Structural organization, ion transport, and energy transduction of P-type ATPases. Biochim. Biophys. Acta. 1286:1–51. [DOI] [PubMed] [Google Scholar]
- 2.Kaplan, J. H. 2002. Biochemistry of Na,K-ATPase. Annu. Rev. Biochem. 71:511–535. [DOI] [PubMed] [Google Scholar]
- 3.Toyoshima, C., M. Nakasako, N. Nomura, and H. Ogawa. 2000. Crystal structure of the calcium pump of sarcoplasmic reticulum at 2.6 Å resolution. Nature. 405:647–655. [DOI] [PubMed] [Google Scholar]
- 4.Toyoshima, C., and H. Nomura. 2002. Structural changes in the calcium pump accompanying the dissociation of calcium. Nature. 418:605–611. [DOI] [PubMed] [Google Scholar]
- 5.Sørensen, T. L. M., J. V. Møller, and P. Nissen. 2004. Phosphoryl transfer and calcium ion occlusion in the calcium pump. Science. 304:1672–1675. [DOI] [PubMed] [Google Scholar]
- 6.Olesen, C., T. L.-M. Sørensen, R. C. Nielsen, J. V. Møller, and P. Nissen. 2004. Dephosphorylation of the calcium pump coupled to counterion occlusion. Science. 306:2251–2255. [DOI] [PubMed] [Google Scholar]
- 7.Toyoshima, C., H. Nomura, and T. Tsuda. 2004. Lumenal gating mechanism revealed in calcium pump crystal structures with phosphate analogues. Nature. 432:361–368. [DOI] [PubMed] [Google Scholar]
- 8.Toyoshima, C., and T. Mizutani. 2004. Crystal structure of the calcium pump with a bound ATP analogue. Nature. 420:529–535. [DOI] [PubMed] [Google Scholar]
- 9.Jensen, A.-M., T. L. M. Sørensen, C. Olesen, J. V. Møller, and P. Nissen. 2006. Modulatory and catalytic modes of ATP binding by the calcium pump. EMBO J. 25:2305–2314. [DOI] [PMC free article] [PubMed] [Google Scholar]
- 10.Takahashi, M., Y. Kondou, and C. Toyoshima. 2007. Interdomain communication in calcium pump as revealed in the crystal structures with transmembrane inhibitors. Proc. Natl. Acad. Sci. USA. 104:5800–5805. [DOI] [PMC free article] [PubMed] [Google Scholar]
- 11.Rand, R. P., N. L. Fuller, P. Butko, G. Francis, and P. Nicholls. 1993. Measured changes in protein solvation with substrate binding and turnover. Biochemistry. 32:5925–5929. [DOI] [PubMed] [Google Scholar]
- 12.Zimmerberg, J., and V. A. Parsegian. 1986. Polymer inaccessible volume changes during opening and closing of a voltage-dependent ionic channel. Nature. 323:36–39. [DOI] [PubMed] [Google Scholar]
- 13.Welch, G. R., B. Somogyi, and S. Damjanovich. 1982. The role of protein fluctuations in enzyme action: a review. Prog. Biophys. Mol. Biol. 39:109–146. [DOI] [PubMed] [Google Scholar]
- 14.Lee, A. G. 1995. Effect of lipid-protein interactions on membrane function. In Biomembranes. A. G. Lee, editor. JAI Press, Greenwich, CT. 187–224.
- 15.Reid, C., and R. P. Rand. 1997. Probing protein hydration and conformational states in solution. Biophys. J. 72:1022–1030. [DOI] [PMC free article] [PubMed] [Google Scholar]
- 16.Bhat, R., and S. N. Timasheff. 1992. Steric exclusion is the principal source of the preferential hydration of proteins in the presence of polyethylene glycols. Protein Sci. 1:1133–1143. [DOI] [PMC free article] [PubMed] [Google Scholar]
- 17.Sampedro, J. G., R. A. Muñoz-Clares, and S. Uribe. 2002. Trehalose-mediated inhibition of the plasma membrane H+-ATPase from Kluyveromyces lactis: dependence on viscosity and temperature. J. Bacteriol. 184:4384–4391. [DOI] [PMC free article] [PubMed] [Google Scholar]
- 18.Zakim, D., J. Kavecansky, and S. Scarlata. 1992. Are membrane enzymes regulated by the viscosity of the membrane environment? Biochemistry. 31:11589–11594. [DOI] [PubMed] [Google Scholar]
- 19.Marsh, D. 2004. Scaling and mean-field theories applied to polymer brushes. Biophys. J. 86:2630–2633. [DOI] [PMC free article] [PubMed] [Google Scholar]
- 20.Weast, R. C. 1972. Handbook of Chemistry and Physics. CRC Press, Cleveland, OH.
- 21.Esmann, M., K. Hideg, and D. Marsh. 1994. Influence of poly(ethylene glycol) and aqueous viscosity on the rotational diffusion of membranous Na,K-ATPase. Biochemistry. 33:3693–3697. [DOI] [PubMed] [Google Scholar]
- 22.Hasse, H., H. P. Kany, R. Tintinger, and G. Maurer. 1995. Osmotic virial coefficients of aqueous poly(ethylene glycol) from laser-light scattering and isopiestic measurements. Macromolecules. 28:3540–3552. [Google Scholar]
- 23.Skou, J. C., and M. Esmann. 1979. Preparation of membrane-bound and of solubilized (Na++K+)-ATPase from rectal glands of Squalus acanthias. The effect of preparative procedures on purity, specific and molar activity. Biochim. Biophys. Acta. 567:436–444. [DOI] [PubMed] [Google Scholar]
- 24.Esmann, M. 1988. ATPase and phosphatase activity of Na+,K+-ATPase: molar and specific activity, protein determination. Methods Enzymol. 156:105–115. [DOI] [PubMed] [Google Scholar]
- 25.Fiske, C. H., and Y. Subbarow. 1925. The colorimetric determination of phosphorus. J. Biol. Chem. 66:375–400. [Google Scholar]
- 26.Baginski, E. S., P. P. Foà, and B. Zak. 1967. Microdetermination of inorganic phosphate, phospholipids, and total phosphate in biologic materials. Clin. Chem. 13:326–332. [PubMed] [Google Scholar]
- 27.Fedosova, N. U., P. Champeil, and M. Esmann. 2002. Nucleotide binding to Na,K-ATPase: the role of electrostatic interactions. Biochemistry. 41:1267–1273. [DOI] [PubMed] [Google Scholar]
- 28.Jakobsen, L. 2004. Structural studies of cation and nucleotide binding sites in Na,K-ATPase. PhD thesis. University of Aarhus, Denmark.
- 29.Berman, H. M., J. Westbrook, Z. Feng, G. Gilliland, T. N. Bhat, H. Weissig, I. N. Shindyalov, and P. E. Bourne. 2000. The Protein Data Bank. Nucleic Acids Res. 28:235–242. [DOI] [PMC free article] [PubMed] [Google Scholar]
- 30.Brady, G. P. Jr., and P. F. W. Stouten. 2000. Fast prediction and visualization of protein binding pockets with PASS. J. Comput.Aided Mol. Des. 14:383–401. [DOI] [PubMed] [Google Scholar]
- 31.Petřek, M., M. Otyepka, P. Banáš, P. Košinová, J. Koča, and J. Damborský. 2006. A new tool to explore routes from protein clefts, pockets and cavities. BMC Bioinformatics. 7:316–324. [DOI] [PMC free article] [PubMed] [Google Scholar]
- 32.DeLano, W. L. 2002. The PyMOL molecular graphics system. DeLano Scientific, San Carlos, CA. http://www.pymol.org.
- 33.Kleywegt, G. J., and R. A. Jones. 1994. Detection, delineation, measurement and display of cavities in macromolecular structures. Acta Crystallogr. D Biol. Crystallogr. 50:178–185. [DOI] [PubMed] [Google Scholar]
- 34.Jensen, J., and J. G. Nørby. 1989. Thallium binding to native and radiation-inactivated Na+/K+-ATPase. Biochim. Biophys. Acta. 985:248–254. [DOI] [PubMed] [Google Scholar]
- 35.Jakobsen, L. O., A. Malmendal, N. C. Nielsen, and M. Esmann. 2006. Cation binding in Na,K-ATPase investigated using 205T1 solid-state NMR spectroscopy. Biochemistry. 45:10768–10776. [DOI] [PubMed] [Google Scholar]
- 36.Mayer, M., and Y. Avi-Dor. 1970. Interaction of solvents with membranal and soluble potassium ion-dependent enzymes. Biochem. J. 116:49–54. [DOI] [PMC free article] [PubMed] [Google Scholar]
- 37.Albers, R. W., and G. J. Koval. 1972. Sodium-potassium-activated adenosine triphosphatase. VII. Concurrent inhibition of Na+-K+-adenosine triphosphatase and activation K+-nitrophenylphosphatase activities. J. Biol. Chem. 247:3088–3092. [PubMed] [Google Scholar]
- 38.Kramers, H. A. 1940. Brownian motion in a field of force and the diffusion model of chemical reactions. Physica. 7:284–304. [Google Scholar]
- 39.Gavish, B. 1980. Position-dependent viscosity effects on rate coefficients. Phys. Rev. Lett. 44:1160–1163. [Google Scholar]
- 40.Beece, D., L. Eisenstein, H. Frauenfelder, D. Good, M. C. Marden, L. Reinisch, A. H. Reynolds, L. B. Sørensen, and K. T. Yue. 1980. Solvent viscosity and protein dynamics. Biochemistry. 19:5147–5157. [DOI] [PubMed] [Google Scholar]
- 41.Erijman, L., and R. M. Clegg. 1998. Reversible stalling of transcription elongation complexes by high pressure. Biophys. J. 75:453–462. [DOI] [PMC free article] [PubMed] [Google Scholar]
- 42.Klink, B. U., R. Winter, M. Engelhard, and I. Chizhov. 2002. Pressure dependence of the photocycle kinetics of bacteriorhodopsin. Biophys. J. 83:3490–3498. [DOI] [PMC free article] [PubMed] [Google Scholar]
- 43.Silva, J. L., and G. Weber. 1993. Pressure stability of proteins. Annu. Rev. Phys. Chem. 44:89–113. [DOI] [PubMed] [Google Scholar]
- 44.Lee, A. G. 2004. How lipids affect the activities of integral membrane proteins. Biochim. Biophys. Acta. 1666:62–87. [DOI] [PubMed] [Google Scholar]
- 45.Goldshleger, R., G. Patchornik, M. B. Shimon, D. Tal, R. L. Post, and S. J. D. Karlish. 2001. Structural organization and energy transduction mechanism of Na+,K+-ATPase studied with transition metal-catalyzed oxidative cleavage. J. Bioenerg. Biomembr. 33:387–399. [DOI] [PubMed] [Google Scholar]
- 46.Skou, J. C., and M. Esmann. 1988. Temperature-dependencies of various catalytic activities of membrane-bound Na+/K+-ATPase from ox brain, ox kidney and shark rectal gland and of C12E8-solubilized shark Na+/K+-ATPase. Biochim. Biophys. Acta. 944:344–350. [DOI] [PubMed] [Google Scholar]


