Abstract
We investigate how an amoeba mechanically moves its own center of gravity using the model organism Physarum plasmodium. Time-dependent velocity fields of protoplasmic streaming over the whole plasmodia were measured with a particle image velocimetry program developed for this work. Combining these data with measurements of the simultaneous movements of the plasmodia revealed a simple physical mechanism of locomotion. The shuttle streaming of the protoplasm was not truly symmetric due to the peristalsis-like movements of the plasmodium. This asymmetry meant that the transport capacity of the stream was not equal in both directions, and a net forward displacement of the center of gravity resulted. The generality of this as a mechanism for amoeboid locomotion is discussed.
INTRODUCTION
Amoebae form temporary structures for movement called pseudopods. These deformed regions of the cell subsequently disassemble, and the cell continues to form new pseudopods while disassembling the old ones. Thus, amoeboid movement is based on a continuous deformation of cell shape induced by the motive force of the protoplasmic flow, which is driven by osmotic and mechanical pressures. Because the motive force drives the flow of protoplasm and deformation of cell, amoeboid movement can be characterized by the spatiotemporal variation of flow and deformation (1).
Amoeboid movement is associated with drastic changes in cell shape. Studies naturally focus on what mechanical forces are involved and how they are coordinated to move the mass of the cell. In other words, the problem is to determine how the locally generated forces are organized to move the entire cell body.
The local force generation originates from contractile proteins like actin and myosin. The stresses generated by active contraction of actomyosin and osmotic pressures generated by depolymerizing actomyosin are possible sources of force generation. In Amoeba proteus, one of the most widely used model organisms for study on amoeboid movement, it was reported that posterior regions of amoeba actively contracted by consumption of ATP and pushed protoplasmic sol forward (2–6). A contrasting theory was also proposed: naked protoplasmic sol without any cell membrane showed the ability to move; posterior parts were pulled forward by anterior regions where transitions of protoplasm from sol to gel occur (2,6).
The above two theories seem contradictory, and each theory is supported by experimental results. However, it is possible that both mechanisms are involved simultaneously in amoeboid motility. The relative importance of the two mechanisms may vary with internal and external conditions. Understanding the forces involved in amoeboid locomotion is one of the classical problems of cell biology and continues to be an active area of research. At this time, it is very loosely accepted that high pressure generated in the posterior region pushes protoplasm forward (7–9).
In addition to the cytological experiments discussed above, techniques of molecular biology have been used to understand actin-myosin dynamics and their role in pseudopod extension and retraction. Visualizing the spatiotemporal variations of actin protein and associated molecules gives dynamic images of cell movement. Based on these experiments, various mechanisms for pseudopod formation were proposed. Nonetheless, it is still an open question as to how a whole cell can move. It is difficult to coordinate measurements of the extension/retraction of pseudopodia with spatial measurements of mass transport throughout the entire cell body with sufficient resolution.
Here we consider the global problem of amoeboid movement: how do amoebae organize these locally generated forces to move their center of gravity? In this article, we combine experimental measurement for mass transport and a theoretical explanation for the observed phenomena to identify the key processes involved in the displacement of the mass of the cell.
The model organism used here is the plasmodia of the true slime mold Physarum polycephalum, a common model organism for studying cell motility. The P. polycephalum plasmodium is a giant protoplasmic aggregate that shows a wide variety of cell behaviors. Its rhythmic contractions and the resulting streaming of protoplasm have been well studied from a cytological point of view (10–13). Recently, researchers have detected patterns of locally self-sustained rhythmic contraction associated with the cell's behavior (14–21), implying that the streaming pattern is organized as a single system throughout the cell.
Pattern formation of the rhythmic contractions is involved in the coordination of local contractile activity and has been considered from two viewpoints: first, the theory of so-called coupled oscillator systems (22–28); and second, the theory of complex viscoelastic matter (29–33). To unify these two views, it is essential to clarify how the movement of the plasmodium is generated by the spatiotemporal pattern of contraction and streaming. Toward this goal, in this article we make spatiotemporal measurements of the streaming velocity and the body deformation and relate this to the movement of the center of mass of the organism.
To relate the local transport to the displacement of the center of mass, it is necessary to know the flow velocity at all regions of cell to sufficient accuracy. For this purpose, we develop a new technique for measuring the velocity field of protoplasmic streaming through the entire body with a quasi-two-dimensional extent using particle image velocimetry. Although this technique was developed for Physarum, it has the potential to be applied to other model systems of amoeboid movement.
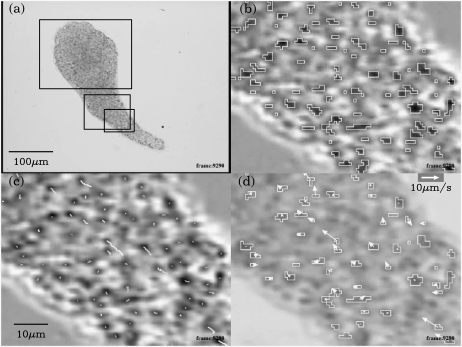
When plasmodia are smaller than ∼100–200 μm, protoplasmic streaming and contraction show no regular rhythmicity. These tiny plasmodia can move, but the speed of movement is very small. When the size reaches 200–300 μm, regular rhythmic contraction and streaming appear and the locomotion speed is much faster than that of the smaller plasmodia. The shape of the body becomes tadpolelike as shown in Fig. 1 a. Thus, there is a critical size for the organism to exhibit fast locomotion and organized rhythmic activity. In our experiments, we studied organisms in the tadpole shape that exhibit the fast locomotion.
FIGURE 1.
The process of particle recognition and identification. All images are captured from processed movies and at the same frame in the movies. Blowups are smoothed by the texture smoothing mechanism of OpenGL to ease the jaggyness. (a) The original image converted to grayscale. The smallest rectangle indicates the position of blowups in panels b–d and Fig. 2, a and b. The middle rectangle indicates the position of blowups in Fig. 2, c and d. The largest rectangle indicates the position of Fig. 9. (b) Blowup of the enhanced image. Darker pixels are now occupied by moving particles and lighter pixels are previously occupied but now free of particles. The open polygons indicate the recognized clusters. The smallest rectangles correspond to one pixel. (c) Trajectories of the center of gravity of the recognized clusters. (d) The velocity of recognized clusters. To avoid the misidentification, the velocity is calculated from last four trajectory points. The underneath plasmodium image is blowup of the original image.
Based on these experiments, we present a physical mechanism for amoeboid movement, focusing on displacement of center of mass, in Physarum. The mechanism is proposed for Physarum but it may be applicable to other model systems such as Amoeba proteus, etc., and we discuss the generality of the mechanism.
ORGANISM AND METHODS
Preparation of plasmodia for observation of protoplasmic streaming and deformation of cell shape
Plasmodia of P. polycephalum were grown on oat flakes for a few days in troughs (35 × 25 cm2) under dim light. Tiny portions (<1 mm3) were cut from the front tips of the plasmodia and placed on a plain agar plate. After waiting for several hours until the plasmodial pieces were moving around and had tubular shapes, portions of their tips were again removed, placed on another agar plate, and cover glasses were placed over them. After standing overnight, the fragments displayed amoeboid movement. Different samples had different forms, but only those with a tadpolelike shape were used, as this seemed to be the simplest structure permitting reasonable migration rates.
Each sample was pressed downward and squeezed by the weight of its cover glass, and was sufficiently transparent for the protoplasm to be observed with a microscope (type VH5000; Keyence, Tokyo, Japan). The protoplasm was full of intracellular vesicles, and the thickness of the organisms remained relatively constant during amoeboid motion. The streaming vesicles were markers yielding information on flow velocity. Microscopic images were taken with a charge-coupled device camera and recorded as a digital video (DV) movie.
Measurement of velocity field of protoplasmic streaming by particle image velocimetry
The DV format movies of plasmodia were transferred from the DV camera to computer files, and then read with analyzing programs. The velocity fields inside the plasmodia were measured by a method called particle image velocimetry (34). In this approach, movies of fluids containing small marker particles are numerically analyzed to determine the velocity fields by tracking the movement of each particle, assuming the velocity of the marker particle to be equal to that of the fluid around it.
In our case, the plasmodia already contained the vesicles and they could not be removed, so we used them as marker particles. Here we briefly describe the process of particle recognition and velocity field measurement. Appendix A gives a more complete and precise description.
The original video is in full color, but the color is not strong enough to be useful in the subsequent analysis. Therefore, we are working with converted grayscale images, like in Fig. 1 a. In this example, the vesicles appear as dark spots.
As we are mainly interested in the moving particles, we want to eliminate immovable particles and enhance the images of moving particles. This is accomplished by subtracting the image accumulated over a long period (∼17 s) from the present image. A sample of the image enhanced in this way is shown in Fig. 1 b. In this image, the darker spots represent moving particles, and the lighter spots represent the free space previously occupied by particles in the accumulated image. To recognize the moving particle, the pixels darker than a threshold are defined to be occupied by particles and one connected group of occupied pixels (indicated by open polygons in Fig. 1 b) is defined as one particle.
Next, we track the movements of recognized particles. This amounts to identifying a particle in one frame with a particle in the next frame. This task is not always possible for every particle. Especially as, in our case, the particles themselves are not stable. The vesicles changed shape and aggregated to form larger particles that may subsequently split again.
To avoid the complexity and to minimize the possible errors in this situation, we take the simplest approach to this task. We only identify two particles in consecutive two frames if and only if two particles overlap each other exclusively: a particle in the present frame overlaps not multiple particles but only one particle in the next frame and vice versa. Some sample trajectories connecting the center of gravity of identified particles are shown in Fig. 1 c. The longest trajectory near the center lasts >1 s.
We calculate the velocity of each particle from these trajectories. To exclude the possible erroneous identifications, we calculate velocity only for trajectories of greater than four-frame length. Thus, we can assign velocity to some particles, as shown in Fig. 1 d.
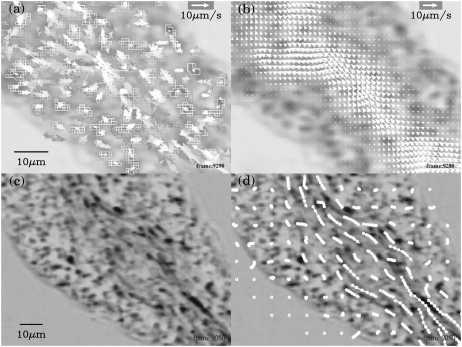
As seen in this figure, the number of particles successfully assigned velocities seems too little at one moment, but if we collect velocity data over a few seconds, we get enough data to interpolate the entire space. In Fig. 2 a, the velocity data of the last three seconds are depicted. We assign some pixels the velocity averaged over time according to the method described in Appendix A. In this stage, the velocity is not defined on every pixel.
FIGURE 2.
The process of vector field measurement and comparison of trajectories of vesicles and the path line obtained from the measured vector field. All images are captured from processed movies. Panels a and b are at the same frame in the movies as in Fig. 1. Panels c and d are at the same frame. (a) The cluster velocity data in the last 3 s. The older the data, the darker the arrows. (b) The resultant vector field obtained by averaging the data depicted in panel a over time (±90 frames) and space (±3 pixels). (c) The superposition of positive enhanced image over ∼10 s. The older the image, the fainter the spot. The moving vesicles should appear as elongated dark spots like comets. (d) The path lines obtained by numerically integrated the constructed vector field are drawn on panel c. A circle is depicted on the path line every 0.5 s.
Then the velocity is averaged over space by the method in Appendix A. If the initial data of velocities of clusters is dense enough, the velocity is assigned on every pixel as depicted in Fig. 2 b.
As a check, we compare the trajectories of the vesicles and the trajectories of virtual fluid particles obtained by integrating the velocity field measured above. The integration is calculated numerically using Runge-Kutta method. The values of the vector field for pixels are assigned to the centers of the pixels. The values of the vector field at the other points are bilinearly interpolated from these values at lattice points.
Depicted in Fig. 2 c is the superposition of the positive part of the enhanced image discussed above. A moving vesicle appears as an elongated spot indicating its direction of movement. In Fig. 2 d, we draw integrated orbits on Fig. 2 c. They agree very well, considering the size of one pixel.
Since the resulted velocity field is obtained by averaging over some tens of individual data, theoretically the error of the mean is only a few percent even if the error of the individual data is some tens of percent. In this case, the error should be measured by the time and space resolutions, which are ∼6 s and 5 μm. Because the typical period of shuttle flow in plasmodia is ∼100 s, this time resolution is good enough to investigate the various phenomena related to shuttle flows. However, the typical width of channels in our plasmodia is 10–30 μm. Therefore, to get the velocity profile across the channel, or to get the total flux through a section of the channel, is beyond the precision of our data.
Determination of cell shape and position of center of mass, and introduction of anterior-posterior coordinate system for plasmodia
The cell shape is detected by outlining the edge of a plasmodium. The center of gravity of a plasmodium is calculated by assuming the existence of unit point mass at the center of each pixel occupied by the plasmodium.
To measure and describe the movement of plasmodia, we need an appropriate time-independent coordinate system. Our coordinate system consists of one longitude curve coinciding roughly with the center line of shuttle flow and/or the trail of the plasmodium (called anterior posterior axis or AP axis), and a set of straight lines perpendicular to the longitude curve (called latitude lines; see Appendix B for more precise definitions).
To construct this coordinate system we only need the edge curve outlining the plasmodium, and the position of the anterior and posterior ends of this edge. As explained in Appendix B, we can calculate the anterior and the posterior positions from two edge curves that are an appropriate time apart.
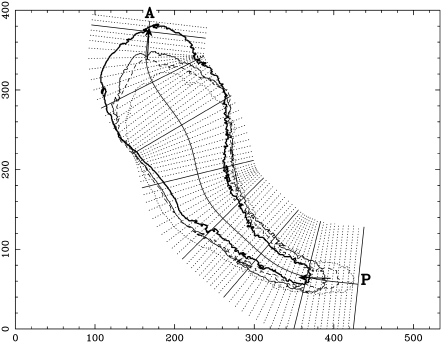
Our coordinate system for a sample plasmodium is shown in Fig. 3. The same sample was used for most of the following figures. This coordinate system is calculated from the four edge curves 140 s apart, which are depicted in Fig. 3. We define the length of the longitude curve measured from point P as the longitude coordinate value. All points on the same latitude line have the same longitude coordinate value. The latitude coordinate value can be defined as the length of the latitude line from the longitude curve with the appropriate sign to distinguish the two sides. However, we do not need the latitudinal coordinates here.
FIGURE 3.
Coordinate system of the plasmodium in Fig. 4. This plasmodium has come from the right and is completing an upward turn. Edge curves are shown at 10 s (thin dotted curve), 150 s (thin broken curve), 290 s (thin solid curve), and 430 s (thick solid curve). The numbers indicate length scale (μm). The curve P to A is the longitude curve. The solid and dotted lines perpendicular to this longitude curve are the latitudinal lines. Arrows are examples of anterior and posterior dipole vectors, which are defined in Appendix B.
The width of a plasmodium is defined as the area occupied by the plasmodium between two adjacent latitude lines equally spaced on the longitude line divided by the space between two adjacent latitude lines. In our sample case, the spacing is 6.5 μm. This amounts to measuring the width in the direction perpendicular to the longitude line.
RESULTS
Propagation of changes in streaming direction from posterior to anterior end
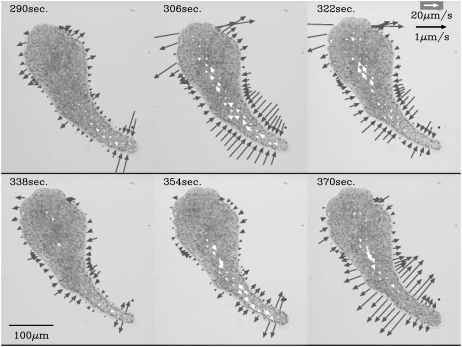
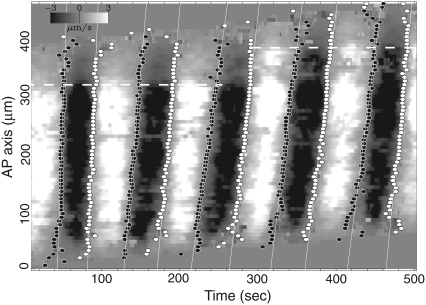
Fig. 4 shows a sequence of velocity fields of protoplasmic streaming in two-dimensional space (open arrows) and rates of width changes measured perpendicularly to the AP axis (shaded arrows). The width of the tail end began to become thinner although the anterior parts became thicker (see the figure at 290 s). This thinning motion propagated forward (306 s and 322 s). At 338 s, the tail began to thicken, although the anterior parts still showed thinning, and the thickening propagated forward again (354, 370 s). The width changes always propagated from the posterior end to the anterior end.
FIGURE 4.
A sequence of velocity fields and the rate of width change of the plasmodium moving upwards. The open arrows represent the vector field at the points on the lattice whose size is arbitrarily chosen. The solid arrows represent the rate of change of the width of the plasmodium. The width is measured in the direction perpendicular to the longitude line. A pair of solid vectors of opposite direction and equal length is drawn on the line perpendicular to the longitude line.
Changes in the direction of protoplasmic streaming also propagated from the tail to the front similar to the propagation of width changes. The forward flow was observed only in the rear region at 290 s, and then became clear at the middle region at 306 s. At 322 s, the forward flow was observed only in the anterior region. At 338 s, backward flow appeared in the tail region and propagated forward at 354 and 370 s. Accompanying the propagation of the width changes, the changes of streaming direction also propagated from the posterior to anterior end. Fig. 4 shows a typical sequence of a sample, but these propagation patterns were always observed with almost no exceptions in a few tens of fast migrating samples.
We concluded that flows in both directions and the deformation of both contraction and relaxation all begin at the posterior end of the plasmodium, and then propagate toward the anterior. These flows are established by the cooperative contraction and relaxation of actomyosin systems distributed throughout the plasmodium. The contraction and relaxation of these systems appear as shrinkage or expansion of width of the plasmodium.
To capture the spatiotemporal patterns of the propagation of these changes, a spatiotemporal plot was depicted by reducing two-dimensional space to one-dimensional space along the AP axis in Fig. 5. The maximum streaming velocity over a latitude line is assigned at the corresponding position on the AP axis. Grayscale in Fig. 5 indicates this velocity. Brighter levels correspond to the forward direction and darker levels correspond to the backward direction. Closed and open circles indicate zero velocity points, which are the points where the streaming direction reverses. The set of zero velocity points comprise almost straight lines in Fig. 5. Each straight line defines a velocity with which the vector field is moving from the posterior to the anterior part of the plasmodium. We will call this type of velocity field a shifting velocity field or SVF, and call this velocity the shifting velocity.
FIGURE 5.
The grayscale plot of the maximum velocity vector of the same plasmodium as in Fig. 4 on the time-AP axis plane. The length of the maximum velocity vector over the latitude line with sign indicating the direction of the flow is plotted. The forward flows are represented by the lighter shade, and the backward flows are represented by the darker shade. The open circles mark the onset of the forward flow, and the solid circles mark the onset of the backward flow. These circles are fitted with lines to obtain the shifting velocity of the vector field. The shifting velocities except first two flows are 12 ± 1μm/s. The absolute value of the averaged velocity of the flow over the channel is 3 ± 0.5μm/s.
Consider this vector field in relation to the locomotive mechanism of plasmodia. The center of gravity moves forward by the forward streaming flow and backward by the backward flow. Therefore, the center of gravity of the plasmodium is oscillating with the shuttle streaming. Consider the ratio of the displacement by the forward flow to the displacement by the backward flow. In a migrating cell, the ratio should be larger than one. The problem is to determine the origin of this imbalance.
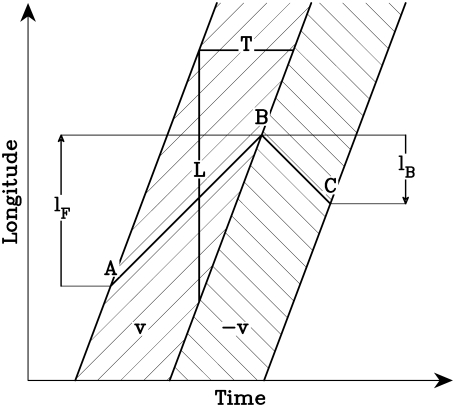
Let us consider the movement of a virtual particle in the plasmodium as shown in Fig. 6, assuming the type of space-time structure of vector field such as we observed in the plasmodia. The hatched band on the left-hand side is the forward flow region, and the band on the right-hand side is the backward flow region. A virtual fluid particle starting from point A is carried to point B by the forward flow, and then reaches point C via the backward flow. We will call the forward and backward migration distances lF and lB, respectively. The migration distance reflects the transportation capability of each flow. If there is no other constraint in the system, the longer migration distance means the longer displacement of the center of gravity.
FIGURE 6.
Schematic drawing of the locomotive mechanism of shuttle flow in plasmodia. The two hatched bands on the time-latitude plane are the shifting vector fields from Fig. 4. The width of the vector field is L, and the duration at the fixed latitudinal point is T. Hence the shifting velocity of the vector field is u = L/T. A fluid particle starting from point A on the latitude curve is carried by the forward flow to point B, then by the backward flow to point C. The migration distance lF is the distance between A and B and lB is the distance between B and C.
The forward migration distance lF is always greater than the backward one lB when the shifting velocity of the flow is forward, namely lB < lF. If this asymmetry in migration distance is a major source that eventually moves the plasmodium forward, the ratio of migration distance lF/lB should correspond to the ratio of the displacement by the forward flow to the displacement by the backward flow in amoeboid movement. In the next subsection, we check this relationship experimentally.
Examination of relationship between migration distance ratio and displacement of center of gravity
First, we calculate the migration distances in Fig. 6. For simplicity, assume that the flow velocity is constant in one band of Fig. 6. We can estimate the migration distance from the shifting velocity of the flow u > 0, the constant velocity of the flow v, and duration of the flow in one direction T. The length of each forward or backward flow region is given by L = uT. This region is moving with velocity u in the positive direction. In accordance with the experimental results, we assume |v| < u. Then, a virtual fluid particle is in the flow region for time duration of t, as given by
 |
The migration distance of the virtual fluid particle for this flow is given by
 |
(1) |
This formula holds for the forward flow when v > 0 and for the backward flow when v < 0.
For the actual data in Fig. 5, the shifting velocity u was calculated as the average of inclinations of the two sides of the flow band and T was measured at the center of the figure . For v, we first find the maximum velocity vector for each forward and backward flow band in Fig. 5. As these values can be anomalous, we took v as the average velocity over 10 pixels around the position of that maximum in the original velocity field at the time of that maximum.
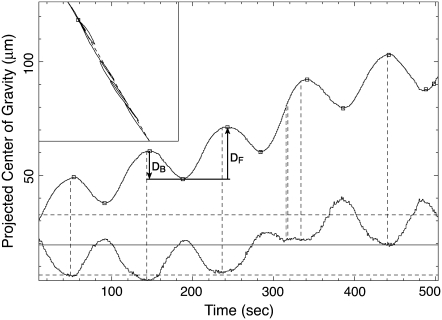
Next we calculated the ratio of the forward displacement to the backward displacement of the center of gravity. Fig. 7 shows the orbit of the center of gravity projected onto the line connecting the initial and the last positions of the center of gravity plotted against time. The extrema are marked by small squares. The forward displacement DF from one local minimum to the next local maximum is due to the forward flow, and the backward displacement DB from a maximum to the next minimum is due to the backward flow.
FIGURE 7.
Movement of the center of gravity of the plasmodium in Fig. 4. The inset in the upper left-hand corner is the movement on the original image plane, and a broken line connects the first and last data points. A small square marks the last data point. The upper curve is the projection of the two-dimensional data onto the dotted line of the inset. Small squares mark the extreme points. The bottom curve is the area of the plasmodium in the movie image. The central solid line of this curve is the average. The broken lines above and below the center line represent 105% and 95% of the average value. Vertical broken lines are drawn from the local minimum of this curve to the center of gravity curve. Note the coincidence between the extrema of the two curves.
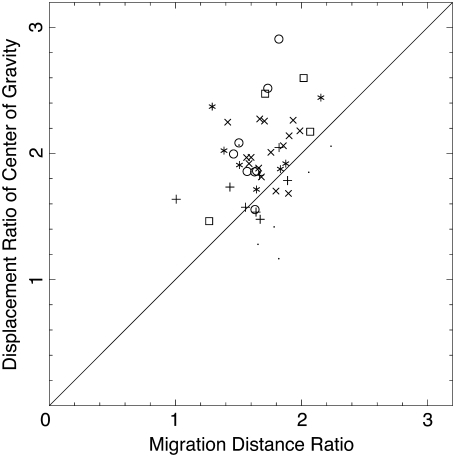
The displacement ratios DF/DB in six samples of freely migrating plasmodia are plotted against the migration distance ratio, lF/lB, in Fig. 8. The sizes of the samples ranged from 200 μm to 500 μm. Although some points deviate considerably from the diagonal, the agreement is good in the sense that the center of the distributed data points is close to the theoretical diagonal line despite the crude approximation. This implies that the asymmetry of migration distance ratio is the major source of asymmetric displacement of the center of gravity. Furthermore, the above plot can detect the anomalous data points as explained below. We conclude that SVF is the main cause of directional migration of center of gravity.
FIGURE 8.
The ratio of displacement of the center of gravity versus the ratio of the migration distances of forward and backward flows, lF/lB. Data from six experiments are plotted. The shifting velocity of the velocity field u, the velocity of the flow v, and the duration of the flow T are obtained from the data in Fig. 5 and the migration distance is calculated from Eq. 1. Displacement ratios are calculated from every three consecutive extrema in the projected center of gravity curve. A different symbol is used for each experiment.
Abrupt formation of streaming channel in relation to deviation in ratio
Many factors might contribute to the deviation in Fig. 8. We now present a case in which we can identify a cause of the large deviations in Fig. 8. This is related to the structure of the shuttle flow near the anterior ends of plasmodia.
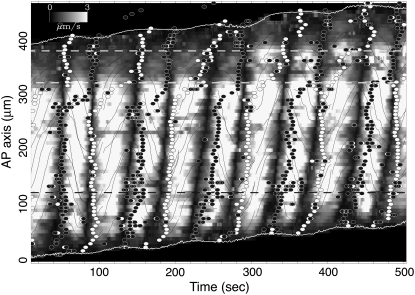
As seen in Fig. 5, the strong shuttle flow abruptly disappears ∼100 μm short of the anterior end in the time from 0 to 260 s, as indicated by the dashed line. Judging only from this figure, the flow seems to contradict the law of continuity in fluid dynamics. But actually, at this point of disappearance, the strong flow plunges into a gel-rich region and slowly fans out.
One of the shortcomings of presenting the movements of plasmodia by the velocity fields is that the slow flow tends to be ignored. To investigate the slow flow near the anterior end, we utilized the superposed image of the positive part of the enhanced images used in Fig. 2 c.
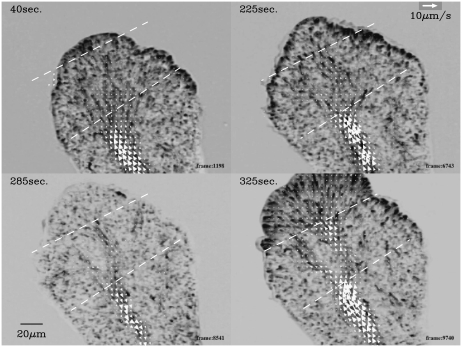
We depicted in Fig. 9 the superposed enhanced image and velocity field near the anterior end. A semi (or quarter) spokewise pattern formed by the elongated solid spots was visible at 40 s and 325 s and less obviously at 225 s. Those images were captured at the height of the forward flows. The channel of shuttle-streaming ended at the center of the spokewise pattern. There was no definite channel in the spokewise pattern. This kind of flow structure seemed ubiquitous. In larger plasmodia, the same structures were also found at the posterior end.
FIGURE 9.
Semispokewise flow patterns near the anterior end. The dashed lines are the latitude lines at the longitude positions indicated by the two dashed lines in Fig. 11.
This flow structure is relevant to the above deviation of ratio because the position of this flow structure did not gradually move forward. It stayed at the same position for a few periods of shuttle streaming, then abruptly a new channel of considerable length was formed and the spokewise pattern appeared at the end of this new channel, as shown in Fig. 9. When the flow pattern changed in this way, the above deviation in the ratio was observed. We will show this by checking flow data and the corresponding ratio data.
The process of the formation of the new channel is shown in Fig. 9 at 225, 285, and 325 s. From 40 to 225 s, the position of the end of the channel stayed at the almost same position (lower dashed line). But at 325 s, it appeared at a position ∼50-μm closer to the anterior end than the previous position (upper dashed line). A new channel appeared between these two positions during the forward flow at 325 s. This new channel can already be recognized during the backward flow at 285 s.
This same process was also apparent in Fig. 5. The slanted solid and open columns corresponding to shuttle streaming expand 50 μm to the anterior end at 300 s.
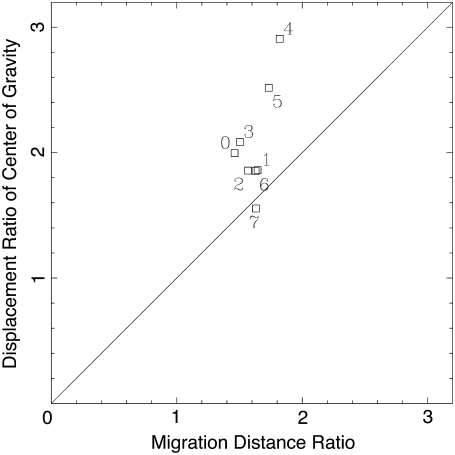
The corresponding ratio data is shown in Fig. 10. This is one of the six experiments from Fig. 8. The attached numbers are the temporal order of the data points. Each data point was calculated from three consecutive extrema from the projected center of gravity curve shown in Fig. 7. Data point 0 was calculated from the first, second, and third extrema of the center of gravity curve; data point 1 was calculated from the second, third, and fourth extrema; and so on.
FIGURE 10.
The displacement ratio versus the migration distance ratio of the plasmodium in Fig. 4. Data points are numbered in temporal order. Data point 0 is calculated from the first, second, and third extrema marked by small squares of the projected center of gravity curve in Fig. 7; data point 1 is calculated from the second, third, and fourth extrema; and so on.
The deviations of data points 4 and 5 were the largest in Fig. 10. This means that the anomaly causing these deviations occurred between the sixth and seventh extrema of the projected center-of-gravity curve shown in Fig. 7, and that it arose in the time period from 290 to 340 s. The anomaly consisted of the fact that the displacement ratio was too large. This means that the center of gravity moved forward anomalously fast during the forward flow corresponding to the open column at 300 s in Fig. 5.
So, the deviation in ratio was observed at the open column at 300 s in Fig. 5, exactly when a new channel was formed (or opened). Because of the new expanded channel, the transportation capability of the forward flow was also expanded larger than before. The large movement of the center of gravity resulted from this fact.
When the channel was formed, the total area of the plasmodium suddenly enlarged as shown by the lower time-course in Fig. 7. Normally in forward displacement, the total area decreased, meaning that the plasmodium contracted. However, in the anomaly, the total area did not decrease, but instead remained constant. The increased area gradually decreased during each contraction. We consider the variations in total area in the Discussion.
Variation of channel width in relation to wave propagation of changes in flow direction
There are two frames of reference for describing the fluid motion: Lagrangian and Eulerian. In the Lagrangian representation, the fluid motion is described by the motion of the fluid particles. In the Eulerian representation, the fluid motion is described by the velocities of the fluid at spatially fixed points. In the above experiment and analysis, we used both reference frames. The raw experimental data are Lagrangian because we measured the positions of vesicles. From these data, we construct velocity fields in the Eulerian frame. We did this because these velocity fields are easier to display, and the Lagrangian representation can be recovered by integrating the Eulerian velocity field to obtain the orbits of fluid particles. In the argument of SVF we returned to Lagrangian representation, but this simplified the presentation.
Switching between the two frames is not always trivial. The kind of flow described in the argument of SVF in the Lagrangian frame is difficult to describe in the Eulerian frame. This is because in such a flow the channel width is not constant in time. Now we explain this and then check the data to show that the channel was really wider during the forward flow than during the backward flow.
Assume that protoplasm is flowing through a channel of a plasmodium according to the velocity profile in Fig. 6. Furthermore, assume that the diameter of the channel is constant in time and space. Consider a cross section of the channel at position B. During each of forward and backward flow, the amount of protoplasm flowing through the cross section is given by (migration distance) × (area of the cross section). Let FF be the total amount of protoplasm flowing through this cross section during the forward flow and FB be that during the backward flow. We have FF > FB both from the migration length argument and from the fact that the plasmodium is moving forward.
On the other hand, the amount of protoplasm flowing through the cross section is also given by (duration of flow) × (absolute value of velocity of fluid) × (area of the cross section). According to the velocity profile in Fig. 6, the duration and absolute value of velocity of flows are almost the same for the forward and backward flows. So the constant radius channels cannot accommodate the flows described in Fig. 6. The channel radius must be wider during the forward flow than during the backward flow. Now we confirm this fact from the experimental data.
Fig. 11 shows the relationship of the velocity field (shaded pattern) and the width variation (circles) in the same sample as Fig. 5. Brighter grayscale indicates high speed of flow and it gives no information on flow direction. The flow direction is indicated by the trajectories of virtual fluid particles, drawn by the solid lines. Solid and open circles indicate the lower and upper extrema, respectively, of width variation, which mean the rate of width change is zero. For instance, the thickening process begins at the time indicated by solid circles, and thinning begins at open circles. The most relevant result here is that the extrema of width variations almost always occurred a little after the reversal (expressed by the solid regions) of the flow direction.
FIGURE 11.
Joint plot of the absolute value of the velocity field (grayscale), points of onset of contractions (open circles) and relaxation (solid circles), orbits of fluid particles obtained by numerically integrating the velocity field (solid curves), and the longitudinal positions of the anterior and posterior ends of the plasmodium (open curves) on the time-longitude plane. The time series of width and velocity of the flow at longitude 120 μm (indicated by the dashed line) is depicted in Fig. 12. Two open dashed lines indicate the corresponding positions of the white dashed lines in Fig. 9.
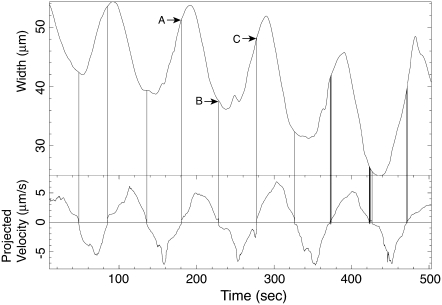
Fig. 12 shows the time course of the width change (the upper curve) and the maximum flow velocity (the lower curve) at a fixed position (indicated by the dashed line in Fig. 11) on AP coordinate. The forward flows begin before the peaks of the width variation and end before the bottom of the width variation. Similarly, the backward flows start before the bottom of width variation and end before the peak. The vertical lines in Fig. 12 mark the time of flow reversal, and they indicate the relationship between the flow direction and the width variation. This delay means that the average width over the period of forward flow is wider than that of backward flow.
FIGURE 12.
The time series of the width (upper curve) and the maximum flow velocity (lower curve), both at the solid dashed line in Fig. 11. The length of the maximum velocity vector over the latitude line is plotted with sign indicating the direction of the flow. The positive velocity means the forward flow. The mass center of line segment AB (thus the time-average of width in forward flow) is larger than that of BC (the averaged width in backward flow). Due to the delay of the extrema of the width, the width is wider during the forward flow than during the backward flow. Vertical lines indicate the points of reversal of the flow.
DISCUSSION
Possible mechanisms for how the propagation begins from the tail end
It was found that SVF was a major source of asymmetric net transport in protoplasmic mass. We discuss here how the characteristic propagation of various movements begins from the posterior end. One possible explanation is that the intracellular Ca2+ concentration is not the same at tail and front. In fact, in Physarum, some patterns and periodic wave trains of Ca2+ are observed (35,36). This asymmetry may form the characteristic pattern of propagation from tail to front.
According to the two-pool model for intracellular Ca2+ dynamics, the frequency of the calcium oscillation increases as the basal level of cytoplasmic Ca2+ increases (37). Cytoplasmic calcium varies through calcium entry from extracellular space. When the ratio of surface area to protoplasmic volume is compared in every local region of the amoeba, it is relatively higher in the tail than in the front because the cell shape of the tail region is long and thin. This is a possible cause of high cytoplasmic Ca2+ in the tail. According to the theory of coupled limit-cycle oscillators, phase-waves propagate from high-frequency regions (38).
The above argument may be applicable to other cells. In Amoeba proteus, contraction in the posterior region is regarded as a motive force of mass transport and Ca2+ is actually high in the posterior region (39–42). Although there is no direct evidence of wave propagation of contraction and Ca2+, periodicity of contraction is observed (43). In the above sense, cytological events are common in Amoeba proteus and Physarum. So the locomotive mechanism proposed here might not be limited only to Physarum.
On the other hand, another explanation for the characteristic propagation comes from a mathematical model for coupled oscillator systems with a mass conservation law, which was proposed for rhythmic amoeboid movement in Physarum (28). According to this theory, directional propagation of phase waves can spontaneously appear without any macroscopic asymmetry initially given. The symmetry is broken by small random fluctuations. These ideas from nonlinear dynamics are useful in explaining the symmetry-breaking necessary for amoeboid movement.
Release of pressure accompanying total area variations
As shown in Fig. 7, the total areas of plasmodia were not preserved during the experiments; instead, they oscillated, and their extreme values coincided precisely with those of the projected center of gravity curves. In Fig. 7, vertical broken lines are drawn from the local minima of the total area curve. Except for a few cases, those vertical lines are very close to, or simply coincide with, the local maxima of the projected center of gravity curves. This very precise correspondence suggests that the variation in area directly reflects the variation of some physical quantity, most likely the pressure.
At a local maximum of the projected center of gravity curve, most regions of the plasmodium are contracting and the anterior part is being pushed forward. This is the state where the inner pressure of the plasmodium is presumably the greatest. At this point, the area is at its local minimum.
We propose two possible reasons for the total area variations. The higher the inner pressure, the rounder the plasmodium becomes to contain it. Then it may sink deeper into flat agar gel. The second explanation is that the volume changes observed are related to morphological changes in the plasmodium. There are many invaginated pits filled with water on surface of plasmodium. The water may be squeezed out of cavity of invagination when the plasmodium contracts. This explanation is supported by the previous observation: the ectoplasm cortex of plasmodial veins become thinner when contracting (44,45). In fact, the thickness of endoplasmic cortex varied temporally as shown in Fig. 4.
The oscillation of the total area is interrupted during the anomaly in the period from 290 to 340 s in Fig. 7. It then resumes with a new and larger baseline. Considering that the total area is inversely proportional to the inner pressure, the change of the total area is consistent with the expansion of the channel. Up to 290 s, the gel-rich region at the anterior end hinders the forward flow and the inner pressure mounts. This reveals itself in the slight decrease of the baseline of the oscillation in total area. At the anomaly, the mounted pressure is released by the forward flow, which propels the center of gravity forward faster than usual. This release of pressure appears as an increase of the baseline of the total area. Subsequently, the total area oscillates around a higher baseline as the inner pressure is lowered by the expansion of the channel.
We have observed similar sets of characteristic data (large displacement ratios, blockages, release of forward flow, and anomalous total area curves) in other experiments and samples. These observations were all consistent with the above-mentioned interpretation.
Formation of flow channel in viscoelastic protoplasm in cell
The technique used in this report allowed us to record spatiotemporal variations of protoplasmic flow in the anterior region of the sheetlike structure. Protoplasmic streaming is not clear in this region, and the flow is relatively slow compared with that in a tube because of the spongelike structure of gel in the anterior sheetlike part. Sol flows slowly through narrow cavities of the sponge. However, we noted some channels in which the protoplasmic flow was much faster; such channels appear suddenly rather than developing gradually and their positions do not vary. Subsequently, one of the channels grows into a tubular structure known as a plasmodial vein. Hence, channels are the precursor of tubes. These observations provide insight into the morphogenesis of veins.
The protoplasm is a complex viscoelastic material with the characteristics of a non-Newtonian fluid. Thixotropy is one such feature, and a gel converts to a flowing sol when the pressure is large enough to break some of the intermolecular structures of the gel. Once flow starts, the viscosity decreases so that the flow becomes easier. This complex process is difficult to understand unless its dynamics are considered in terms of mathematics and physics. In fact, regular shuttle streaming is not observed in organisms <100 μm in diameter. This implies the occurrence of some kind of instability. A mathematical model capturing the essence of the complex cell dynamics will be greatly needed in future work.
Amoeboid movements based on nonlinear waves and oscillations
The relationship between these results and previous findings that appear to contradict them (17,18) must be considered here. In our previous work, we observed that the contraction waves transmit from the anterior to the posterior part of large plasmodia with veins and sheets. At that time, due to technological limitations (that is, analog television cameras and less-powerful personal computers), we used coarse-grained images instead of detailed ones. Under those conditions, we mainly observed changes in the thickness of the sheets. Preliminary observations show that in large plasmodia with veins and sheets, the forward flow in veins enters the sheets near the anterior rim, then bounces off the rim and transforms into backward flow through the sheet. We believe that what we observed in the previous work was this backward flow in the sheet. Further investigation to clarify this point is underway.
In large plasmodia with veins and sheets, velocity measurements cannot be made by the present methods due to the lack of transparency and the large velocity of flow. However, now that we can measure the thickness of the veins with precision, we can estimate the velocity fields inside them based on the present mechanism. We hope, soon, to be in a position to confirm this theory.
In this article, we have established that the direction of locomotion and the direction of propagation of the contraction phase coincide in small plasmodia. The next question is whether this relationship still holds in other situations, such as tactic responses to stimulation and the locomotion of organisms with more complex shapes. When this question is answered, we might begin to understand how the amoeba organizes the various regions of its protoplasm to achieve behavioral feats such as maze solving. Dynamical aspects of oscillations and waves should be studied at a level of the whole body of the amoeba to clarify mechanics of amoeboid locomotion by integrating molecular events of mechanochemical interactions.
APPENDIX A
One DV movie consists of 29.97 frames per second, each of which has 720 × 480 pixels,
 |
where S is a set of pixels in a frame. Each pixel has an integer value from 0 (brightest) to 255 (darkest). A movie g is expressed as a mathematical function:
 |
To enhance the moving vesicles in the images of the movie, we subtract the accumulated image Gm(x, y, t) from the original image. In the following analysis, we set m = 500 to be ∼16.6 s:
 |
 |
We recognize the moving vesicles as the black granules in gm. As a threshold, we set Ct = 256 × 0.75:
 |
To separate one vesicle from the rest of C(t), we decompose C(t) into connected components called clusters c(t|i), i = 1, …, Nc(t) and 
A set c ⊂ S is connected, when for any pair of points (x1, y1), (x0, y0) ∈ c there is a sequence of points (x1, y1), (x2, y2), …, (xk, yk), (xk, yk) = (x0, y0), all in c, such that (xi+1, yi+1) ∈ n(xi, yi), i = 1, 2, …, k − 1 where n(x, y) = {(x + 1, y), (x − 1, y), (x, y + 1), (x, y − 1)} ∩ S is a set of nearest neighbors of (x, y). We can reach (x0, y0) from (x1, y1) by a route in c.
To track the movements of clusters we have to establish the correspondences between the clusters in two consecutive frames. The cluster c(t|i) in frame t corresponds to c(t − 1|j) in frame t − 1, when c(t|i) overlaps only c(t − 1|j), and c(t − 1|j) overlaps only c(t|i). We express this correspondence by the function l(i, t) = j.
More precisely, l(i, t) = j if and only if both sets {j:c(t|i) ∩ c(t − 1|j) ≠ Ø} and {i: c(t|i) ∩ c(t − 1|j) ≠ Ø} have just one element. Otherwise, it is undefined.
The center of gravity of the ith cluster in frame t is defined as
 |
From N + 1 consecutive corresponding clusters, we obtain the velocity per frame of the ith cluster in frame t:
 |
We use N = 3 in the following formulae.
From the velocities of the clusters we construct the velocity field. First, we assign velocities to the points in the clusters with defined velocities. The function  is 1 at a point where the velocity is thus defined, 0 at other points:
 |
 |
Then we smooth the velocity field by geometric series in time. But the velocity is not always defined at the point. We compensate for this effect by modifying the normalization factor F1 defined as
 |
We set w = 90. If the zero terms θ0 = 0 are too numerous in this series, the velocity cannot be defined at that point. We set the threshold Ft = 0.02 × w. The value θ1 indicates whether the velocity is thus defined or not:
 |
 |
Finally, we interpolate the velocity to fill the undefined points. The average velocity in a square Sq(x, y) is assigned to that point. We set nx = 4 and ny = 4:
 |
Then, the velocity field we use in subsequent analysis is given by
 |
where
 |
APPENDIX B
To extract the edge of a plasmodium we use the accumulated image defined in Appendix A. We choose the threshold at ∼Et = 0.5*256, but sometimes we need to find the optimum value manually. This depends on the quality of the original movie. Let
 |
We denote the connected component of G(t) corresponding to our plasmodium by E(t). To construct the coordinate system, we take two sets E(t1) and E(t2), where t1 < t2. Then the forward set is defined as
 |
where  is t he complement of E(t1) with respect to S. The connected components of F are denoted by Fi, where F = ∪ iFi.
Each component Fi has two kinds of boundaries. One is the boundary of E(t2):
 |
The other is the boundary adjacent to E(t1):
 |
We can express movements of boundaries by analogy with the dipole moment vector of electromagnetism. We assume that a positive charge 1 is distributed uniformly on the boundary  and negative charge − 1 on
Then we define the dipole vector of Fi as
 |
where we denote the number of elements in set F by |F|. The length of the vector pi is set proportional to the area of Fi.
We can similarly define the backward set as
 |
The connected components of B are B = ∪ iBi.
The boundaries of Bi are
 |
and
 |
The backward dipole vector is
 |
The center of gravity of a set A is defined as
 |
The boundary of a set A is defined as
 |
We denote by D the displacement vector of the center of gravity from E(t1) to E(t2), where
 |
With respect to this vector D, we pick a frontmost forward dipole vector and a rearmost backward dipole vector of more than a defined size. We denote the inner product of vectors by (,)
 |
 |
The main motivation for defining forward and backward dipole vectors is to pinpoint the heads and tails of plasmodia. The head Ph(t) is the foremost boundary point with respect to the forward dipole vector 
 |
Likewise, the tail Pt(t) is defined as
 |
Thus, for a pair of sets E(t1) and E(t2), we obtain four points on the plane Pt(t1), Pt(t2), Ph(t1), and Ph(t2) and for sets E(t1), …, E(tn), we have Pt(t1), …, Pt(tn) and Ph(t1), …, Ph(tn). Assuming (D, Pt(tn)) < (D, Ph(t1)) (if not, just discarding some Phs), the sequence of points {Pt(t1), …, Pt(tn), Ph(t1), …, Ph(tn)} is the first approximation to our longitude curve.
If the segment from Pt(tn) to Ph(t1) is relatively long as in Fig. 3, we take some extra points on this segment P1, …, Pk and shift their position to the center of the plasmodium P′1, …, P′k in a direction perpendicular to this segment. We now have a second approximation {Pt(t1), …, Pt(tn), P′1, …, P′k, Ph(t1), …, Ph(tn)} to our longitude curve.
Finally, to round the corners, the sequence of points is passed through a low-pass filter using a two-dimensional fast-Fourier transform.
Editor: Alexander Mogilner.
References
- 1.Bray, D. 2001. Cell Movements: From Molecules to Motility. Garland, New York.
- 2.Allen, R. D. 1961. A new theory of amoeboid movement and protoplasmic streaming. Exp. Cell Res. 8:17–31. [DOI] [PubMed] [Google Scholar]
- 3.Goldacre, R. J. 1964. On the mechanism and control of amoeboid movement. In Primitive Motile Systems in Cell Biology. R. D. Allen and N. Kamiya, editors. Academic Press, New York and London.
- 4.Opas, M. 1976. Course of glycerination of Amoeba proteus and contraction of glycerinated models. Acta Protozool. 15:485–499. [Google Scholar]
- 5.Rinaldi, R., and M. Opas. 1976. Graphs of contracting glycerinated Amoeba proteus. Nature. 260:522–526. [DOI] [PubMed] [Google Scholar]
- 6.Taylor, D. L., P. L. Moore, and R. D. Allen. 1973. Contractile basis of amoeboid movement. I. the chemical control of motility in isolated cytoplasm. J. Cell Biol. 59:378–394. [DOI] [PMC free article] [PubMed] [Google Scholar]
- 7.Taylor, D. L., J. R. Blinks, and G. Reynolds. 1980. Contractile basis of amoeboid movement. VIII. Aquorin luminescence during amoeboid movement, endocytosis, and capping. J. Cell Biol. 86:599–607. [DOI] [PMC free article] [PubMed] [Google Scholar]
- 8.Janson, L. W., and D. L. Taylor. 1993. In vitro models of tail contraction and cytoplasmic streaming in amoeboid cell. J. Cell Biol. 123:345–356. [DOI] [PMC free article] [PubMed] [Google Scholar]
- 9.Yanai, M., C. M. Kewnyon, J. P. Butler, P. T. Macklem, and S. M. Kelly. 1996. Intracellular pressure is a motive force for cell motion in Amoeba proteus. Cell Motil. Cytoskeleton. 33:22–29. [DOI] [PubMed] [Google Scholar]
- 10.Kamiya, N. 1959. Protoplasmic streaming. Protoplasmatologia. 8:1–199. [Google Scholar]
- 11.Kamiya, N. 1968. The mechanism of cytoplasmic movement in a myxomycete plasmodium. In Aspects of Cell Motility. Cambridge University Press, Cambridge, UK. [PubMed]
- 12.Kessler, D. 1982. Cell Biology of Physarum and Didymium, Vol. I. H. C. Aldrich and J. W. Daniel, editors. Academic Press, New York.
- 13.Stockem, W., and K. Brix. 1994. Analysis of microfilament organization and contractile activities in Physarum. Int. Rev. Cytol. 149:145–215. [Google Scholar]
- 14.Grebecki, A., and M. Cieslawska. 1978. Plasmodium of Physarum polycephalum as a synchronous contractile system. Cytobiologie. 17:335–342. [PubMed] [Google Scholar]
- 15.Ueda, T., T. Nakagaki, and Y. Kobatake. 1988. Patterns in intracellular ATP distribution and rhythmic contraction in relation to amoeboid locomotion in the plasmodium of Physarum polycephalum. Protoplasma. (Suppl 1):51–56.
- 16.Ueda, T. 1993. Intracellular oscillations and pattern formation in the cell behavior of Physarum. In Oscillations and Morphogenesis. L. Rensing, editor. Marcel Dekker, New York.
- 17.Matsumoto, K., T. Ueda, and Y. Kobatake. 1986. Propagation of phase wave in relation to tactic responses by the plasmodium of Physarum polycephalum. J. Theor. Biol. 122:339–345. [Google Scholar]
- 18.Matsumoto, K., T. Ueda, and Y. Kobatake. 1988. Reversal of thermotaxis with oscillatory stimulation in the plasmodium of Physarum polycephalum. J. Theor. Biol. 131:175–182. [Google Scholar]
- 19.Miyake, Y., S. Tabata, H. Murakami, M. Yano, and H. Shimizu. 1996. Environment-dependent self-organization of positional information field in chemotaxis of Physarum plasmodium. J. Theor. Biol. 178:341–353. [Google Scholar]
- 20.Nakagaki, T., H. Yamada, and T. Ueda. 2000. Interaction between cell shape and contraction pattern. Biophys. Chem. 84:195–204. [DOI] [PubMed] [Google Scholar]
- 21.Nakagaki, T., and T. Ueda. 1996. Phase switching of oscillatory contraction in relation to the regulation of amoeboid behavior by the plasmodium of Physarum polycephalum. J. Theor. Biol. 179:261–267. [DOI] [PubMed] [Google Scholar]
- 22.Takahashi, K., G. Uchida, Z. S. Hu, and Y. Tsuchiya. 1997. Entrainment of the self-sustained oscillation in a Physarum polycephalum strand as a one-dimensionally coupled oscillator system. J. Theor. Biol. 184:105–110. [Google Scholar]
- 23.Takamatsu, A., K. Takahashi, M. Nagao, and Y. Tsuchiya. 1997. Frequency coupling model for dynamics of responses to stimuli in plasmodium Physarum polycephalum. J. Phys. Soc. Jpn. 66:1638–1646. [Google Scholar]
- 24.Takamatsu, A., T. Fujii, and I. Endo. 2000. Time delay effect in a living coupled oscillator system with the plasmodium of Physarum polycephalum. Phys. Rev. Lett. 85:2026–2029. [DOI] [PubMed] [Google Scholar]
- 25.Takamatsu, A., R. Tanaka, H. Yamada, T. Nakagaki, T. Fujii, and I. Endo. 2001. Spatiotemporal symmetry in rings of coupled biological oscillators of Physarum plasmodium. Phys. Rev. Lett. 87:781021–781024. [DOI] [PubMed] [Google Scholar]
- 26.Miyake, Y., Y. Yamaguchi, M. Yano, and H. Shimizu. 1993. Environment-dependent self organization of positional information in coupled nonlinear oscillator system. IEICE Trans. Fundamentals E. 76A:780–785. [Google Scholar]
- 27.Nakagaki, T., H. Yamada, and M. Ito. 1999. Reaction diffusion advection model for pattern formation of rhythmic contraction in a giant amoeboid cell of the Physarum plasmodium. J. Theor. Biol. 197:497–506. [DOI] [PubMed] [Google Scholar]
- 28.Tero, A., R. Kobayashi, and T. Nakagaki. 2005. A coupled oscillator model with a conservation law for the rhythmic amoeboid movements of plasmodial slime molds. Physica D. 205:125–135. [Google Scholar]
- 29.Teplov, V. A., Yu. M. Romanovsky, and O. A. Latushkin. 1991. A continuum model of contraction waves and protoplasm streaming in strands of Physarum polycephalum. Biosystems. 24:269–289. [DOI] [PubMed] [Google Scholar]
- 30.Teplov, V. A., Y. M. Romanovsky, D. A. Pavlov, and W. Alt. 1997. Auto-oscillatory processes and feedback mechanisms in Physarum plasmodium motility. In Dynamics of Cell and Tissue Motion. W. Alt, A. Deutsh, and G. Dunn, editors. Bïrkhauser, Basel, Switzerland.
- 31.Alt, W. 1987. Mathematical models in actin myosin interaction. In Fortschritte der Zoologie, Band 34, Wolfarth Botterman (Hrsg.). Nature and Function of Cytoskeletal Proteins in Motility and Transport. Gustav Fisher Verlag, Stuttgart, New York.
- 32.Oster, G. F., and G. M. Odell. 1984. Mechanics of cytogels. I. Oscillations in Physarum. Cell Motil. 4:469–503. [DOI] [PubMed] [Google Scholar]
- 33.Kobayashi, R., A. Tero, and T. Nakagaki. 2006. Mathematical model for rhythmic amoeboid movement in the true slime mold. J. Math. Biol. In press. [DOI] [PubMed]
- 34.Adrian, R. J. 2005. Twenty years of particle image velocimetry. Exp. Fluids. 39:159–169. [Google Scholar]
- 35.Natsume, K., Y. Miyake, M. Yano, and H. Shimizu. 1992. Development of spatio-temporal pattern of calcium on the chemotactic behavior of Physarum plasmodium. Protoplasma. 166:55–60. [Google Scholar]
- 36.Natsume, K., Y. Miyake, M. Yano, and H. Shimizu. 1993. Information propagation by spatio-temporal pattern change of calcium concentration throughout Physarum polycephalum with repulsive stimulation. Cell Struct. Funct. 18:111–115. [DOI] [PubMed] [Google Scholar]
- 37.Keener, J. P., and J. Sneyd. 1998. Mathematical Physiology. Springer-Verlag, New York, Berlin, Heidelberg.
- 38.Kuramoto, Y. 1984. Chemical Oscillations, Waves and Turbulence. Springer-Verlag, Berlin, Heidelberg.
- 39.Taylor, D. L., Y. L. Wang, and J. M. Heiple. 1980. Contractile basis of amoeboid movement. VII. The distribution of fluorescently labeled actin in living amoebas. J. Cell Biol. 86:590–598. [DOI] [PMC free article] [PubMed] [Google Scholar]
- 40.Kuroda, K., Y. Yoshimoto, and Y. Hiramoto. 1988. Temporal and spatial localization of Ca2+ in moving Amoeba proteus visualized with aquorin. Protoplasma. 144:64–67. [Google Scholar]
- 41.Gollnick, F., R. Meyer, and W. Stockem. 1991. Visualization and measurement of calcium transients in Amoeba proteus by Fura-2 fluorescence. Eur. J. Cell Biol. 55:261–271. [PubMed] [Google Scholar]
- 42.Sonobe, S., and E. Nishihara. 2003. Cell biology of Amoeba proteus. Jpn J Protozool. 37:159–167. [Google Scholar]
- 43.Ueda, T., and Y. Kobatake. 1985. Oscillation in cell shape and size during locomotion of amoeboid cells. In Cell Motility: Mechanism and Regulation. H. Ishikawa, S. Hatano, and H. Sato, editors. University of Tokyo Press, Tokyo, Japan.
- 44.Grebecki, A., and M. Cieślawska. 1978. Dynamics of ectoplasmic walls during pulsation of plasmodial veins of Physarum polycephalum. Protoplasma. 97:365–371. [Google Scholar]
- 45.Grebecki, A., and M. Moczoń. 1978. Correlation of contractile activity and of streaming direction between branching veins of Physarum polycephalum plasmodium. Protoplasma. 97:153–164. [Google Scholar]


