Abstract
Sonoporation has been exploited as a promising nonviral strategy for intracellular delivery of drugs and genes. The technique utilizes ultrasound application, often facilitated by the presence of microbubbles, to generate transient, nonspecific pores on the cell membrane. However, due to the complexity and transient nature of ultrasound-mediated bubble interaction with cells, no direct correlation of sonoporation with bubble activities such as acoustic cavitation, i.e., the ultrasound-driven growth and violent collapse of bubbles, has been obtained. Using Xenopus oocytes as a model system, this study investigated sonoporation in a single cell affected by colocalized cavitation in real time. A confocally and collinearly-aligned dual-frequency ultrasound transducer assembly was used to generate focused ultrasound pulses (1.5 MHz) to induce focal sonoporation while detecting the broadband cavitation acoustic emission within the same focal zone. Dynamic sonoporation of the single cell was monitored via the transmembrane current of the cell under voltage-clamp. Our results demonstrate for the first time, to our knowledge, the spatiotemporal correlation of sonoporation with cavitation at the single-cell level.
Safe and efficient intracellular delivery of drugs and genes is critically important in such applications as targeted cancer treatment and gene therapy. Ultrasound has been used to transiently increase the cell membrane permeability and has been exploited as a promising nonviral strategy for intracellular delivery of DNAs, proteins, and other agents (1–3). While it is hypothesized that ultrasound energy mechanically creates nonspecific pores on the cell membrane to allow entry of extracellular agents into the cell, the biophysical mechanisms of this process, often called sonoporation (2,4,5), has not been fully understood. Despite increasing interest in ultrasound-mediated delivery, challenges remain to achieve controllable sonoporation outcome. The dearth of real-time measurements of sonoporation at the single-cell level makes it difficult to examine the exact mechanism and process of sonoporation. Determination and attempted optimization of sonoporation parameters have largely relied on the retrospective analysis of post-ultrasound assay results. In particular, although the presence of micron-sized bubbles has been shown to facilitate cell sonoporation (6), association of sonoporation with dynamic microbubble activities (5,7–9) such as inertial acoustic cavitation (the rapid expansion and violent collapse of gaseous bubbles driven by an ultrasound field) is often derived based on statistical comparison of results from post-ultrasound assay of cellular uptake and/or cell survival in the presence or absence of microbubbles. Such approaches lack temporal and spatial specificity, inevitably leading to uncertainty in relating actual sonoporation parameters with outcome, given the complexity of ultrasound interaction with cells and bubbles. As such, the exact relationship between cavitation and sonoporation has not been obtained.
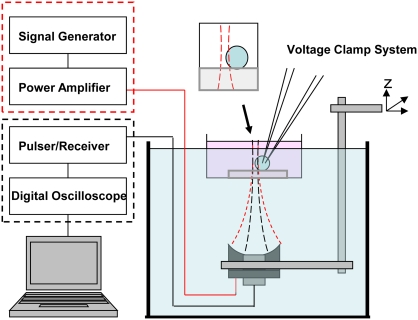
This study investigated the impact of microbubble cavitation on the cell membrane by measuring in real-time the colocalized and concurrent cavitation activities and sonoporation of a single cell. Using Xenopus oocytes as a model system (4) along with a focused ultrasound strategy, localized cavitation, and sonoporation were only generated and detected within the ultrasound focus (Fig. 1). Sonoporation was measured, in real-time, via the inward transmembrane (TM) current of the single Xenopus oocyte under voltage-clamp, as demonstrated in our previous study (4). Before ultrasound application, the TM current is constant at a fixed membrane holding potential (voltage-clamped) in the absence of activation of endogenous ion channels, since the whole cell membrane is regarded as a resistor with constant resistance (10). In sonoporation, ultrasound generates nonspecific pores on the cell membrane, thereby decreasing its resistance. The resulting change in the TM current due to the ions flowing through the pores is determined by the pore size and ion concentration gradient across the cell membrane, therefore providing a novel means to monitor the dynamics of sonoporation in a single cell with high temporal resolution and sensitivity.
FIGURE 1.
Simultaneous monitoring of sonoporation and cavitation via voltage-clamp and acoustic signal detection within the ultrasound focus. (Inset) Ultrasound focus centered at the edge of the cell, placed on top of a gel block in a dish.
Fig. 1 shows the experimental setup. Defolliculated Xenopus oocytes were prepared following a protocol approved by our Institutional Animal Care and Use Committee. A single oocyte (diameter 0.8 ∼ 1.0 mm) placed on a 2-mm-thick acoustic gel block (Parker Laboratories, Fairfield, NJ) was immersed in 4 mL ND96 solution (in mM: 96 NaCl, 2 KCl, 1 MgCl2, 1.8 CaCl2, 5 HEPES, pH 7.6) in a 35-mm petri dish with a thin glass bottom (∼0.8 mm) (MatTek, Ashland, MA). The gel block, with an acoustic impedance similar to water, and the solution, created a standoff distance to acoustically separate the dish bottom from the cell without disturbing the ultrasound fields.
A dual-frequency ultrasound transducer assembly, including two concentric ultrasound transducers confocally and collinearly-aligned, was utilized in this experimental study. The donut-shaped, outer transducer (excitation transducer) with inner and outer diameters of 14 and 30 mm was used to generate a focused ultrasound beam at 1.5-MHz (focal distance 48 mm, full 3-dB lateral beam width 0.9 mm) to induce cavitation and sonoporation. The circular, center transducer (detection transducer) with a diameter of 14 mm is a broadband ultrasound transducer (center frequency 7 MHz, 50% bandwidth, focal distance 48 mm, 3-dB beam width 0.45 mm). It was used to detect acoustic signals from the overlapped focal zone. The transducer assembly was immersed in a water tank aiming upward with its center of focus positioned at the equator of the cell (Fig. 1, inset). Localization of cavitation and sonoporation was achieved at the intersection of the cell membrane with the ultrasound focus (∼0.25 × 2 mm2 within 1 dB).
The excitation ultrasound pulses were applied to irradiate the cell in the presence of 0.1% activated Definity microbubbles (Bristol-Myers Squibb Medical Imaging, North Billerica, MA), which were used as cavitation nuclei to facilitate sonoporation (5,8). Definity is an ultrasound imaging contrast agent consisting of perflutren lipid shelled bubbles (diameter 2.2 ± 1.1 μm). Coupled to an ultrasound pulser/receiver (Panametrics NDT, 5910R; Waltham, MA), the detection transducer was operated in pulse-echo mode with a pulse-repetition frequency of 5.88 kHz. During each period (170 μs) of pulse-echo operation, the detection transducer sent a short detection or probing pulse and then immediately switched to “receive mode” to detect the backscattered (BS) signals from existing bubbles (active cavitation detection) and the acoustic-emission (AE) signals from collapsing bubbles (passive cavitation detection) within the focal zone. During application (from 34 to 200 ms), the excitation pulses were applied in sync with the detection pulses at 5.88 kHz pulse-repetition frequency, with each excitation pulse in every pulse-echo period delayed 17 μs from the detection pulse. This minimal delay was used to separate the BS signals from the AE signals received by the detection transducer. Each excitation pulse included five cycles of oscillating acoustic pressure of 2.09 MPa (acoustic pressures indicated are peak negative values); the short pulse duration avoided the buildup of a standing wave and the effects of multiple reflections inside the dish.
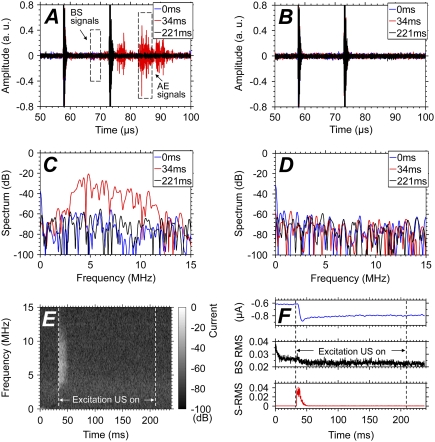
Fig. 2, A and B, shows examples of the acoustic signals (in arbitrary unit) received by the detection transducer (at sampling rate 50 MHz) with and without Definity in the solution. The horizontal axis represents the time duration for the ultrasound pulses to travel from the transducer to the scattering targets and back to the transducer at sound speed 1480 m/s (in water), corresponding to the spatial location of an acoustic source. As the cell was placed near the ultrasound focus (48 mm, equivalent to a round-trip travel time of 64.9 μs for the ultrasound pulse), the signal segments indicated in the plots correspond to the BS signals (65–67 μs) and the AE signals (82–86.5 μs) from bubbles within the intersection zone of the ultrasound focus with the cell. (The AE signals arrived 17 μs after the BS signals because of the delay of each excitation pulse from the detection pulse.) The AE signals also lasted longer because of the longer pulse duration of the 1.5 MHz excitation pulse than the (7 MHz) detection pulse. The echoes (at 58 μs and 73 μs) are reflections from the dish bottom and the solution-air interface.
FIGURE 2.
(A and C) Increased AE signals and broadband spectra during bubble destruction. (B and D) No acoustic signals detected without Definity (Bristol-Myers Squibb Medical Imaging). (E) The AE spectrum shows bubble destruction occurred in 15 ms after activation of the excitation ultrasound pulses. (F) The inward transmembrane current increases with the decrease of BS RMS (middle plot) and increase of spectral RMS (3–11 MHz) (bottom plot).
Because the excitation ultrasound was on from 34 to 210 ms, AE signals were not present at 0 ms (blue curve), but showed marked increase at the start of ultrasound application (red curve at 34 ms) before returning to noise level later (black curve at 221 ms). Destruction of bubbles by the excitation pulses is clearly seen via the characteristic broadband spectrum of AE signals (Fig. 2, C and E), in contrast to the cases when the same ultrasound exposures were applied without bubbles in the solution (Fig. 2, B and D), or when no excitation pulses were applied with bubbles present (data not shown). The dynamic evolution of the broadband AE (Fig. 2 E) shows that cavitation lasted for only 15 ms after the ultrasound activation since no AE signals were detected beyond 49 ms, even though more excitation pulses were applied—indicating rapid and complete destruction of bubbles within the ultrasound focal zone.
Correspondingly, the inward TM current (recorded at sampling rate of 20 kHz) of the Xenopus oocyte under voltage-clamp (at −50 mV holding potential) exhibited a rapid increase correlated with the increase of AE signals, as shown by the spectral root-mean-square (RMS) calculated from 3 to 11 MHz (Fig. 2 F). Similarly, the TM current also showed no further increase beyond 49 ms (Fig. 2, E and F). The change in the BS signals is less pronounced visually; nevertheless, it is evident from the change of the RMS of the signals (Fig. 2 F). The decrease of BS RMS after the application of the excitation ultrasound (Fig. 2 F, middle plot) has a time course similar to the AE signals, correlating to the decreased number of scattering bubbles in the focal zone due to bubble destruction by the excitation pulses. The BS RMS shows an initial decrease, because the radiation force of the detection pulses pushed the bubbles out of the focus.
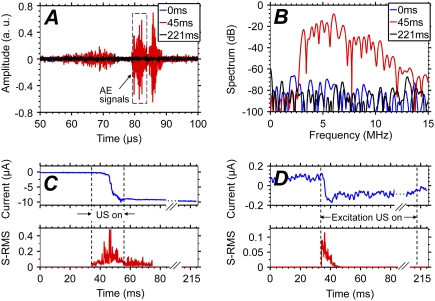
The correlation of sonoporation with cavitation is further demonstrated by the results shown in Fig. 3, wherein the amplitude of the excitation ultrasound was linearly ramped from 0 to 3.74 MPa in a period of 21 ms. In these experiments, only the AE signals from the collapsing bubbles in the focal zone were detected using passive cavitation detection (no detection pulses were used). Increase of the AE spectral RMS (3–11 MHz) (Fig. 3 B) correlates well with the increased amplitude of the inward TM current (Fig. 3 C). The initial change of both AE and TM current occurred at ∼41 ms (1.33 MPa) or 7 ms after ultrasound application (at 34 ms), reaching maximum at ∼47 ms or 13 ms after ultrasound activation, in contrast with the immediate increase when constant-amplitude excitation pulses were applied (Fig. 3 D, also Fig. 2 F). The delay was due to the low acoustic pressure amplitude early in the ramp. Furthermore, the amplitude of the TM current correlated with AE spectral RMS values, with both quantities higher during ramping exposure than during the constant-amplitude exposure (Fig. 3, C and D). These acoustic pressures are higher than reported values in sonoporation experiments in nonfocal, larger volumes, but this may be related to the scarcity of cavitation and sonoporation events in a small focal volume.
FIGURE 3.
(A and B) Examples of the AE signals and power spectra in passive detection. (C) Change in TM current corresponds with delayed AE increase when ramping ultrasound pulses were applied. (D) Change in TM current occurs immediately after excitation ultrasound with constant amplitude.
These time-resolved measurements of TM current and AE signals using confocally aligned ultrasound transducers demonstrate for the first time the spatiotemporal correlation of sonoporation with cavitation. Since the detected acoustic signals came from the collapsing bubbles within the overlapped ultrasound focal zone of the detection and excitation transducers, the precision of the correlation is limited by the small but finite volume of the intersection of the ultrasound focus with the cell membrane (Fig. 1, inset).
Acknowledgments
Helpful suggestions by Ronald Kumon are appreciated.
The work was supported in part by the National Institutes of Health (grant No. R01CA116592).
Editor: Eduardo Perozo.
References
- 1.Mitragotri, S. 2005. Healing sound: the use of ultrasound in drug delivery and other therapeutic applications. Nat. Rev. Drug Discov. 4:255–260. [DOI] [PubMed] [Google Scholar]
- 2.Miller, D. L., S. V. Pislaru, and J. E. Greenleaf. 2002. Sonoporation: mechanical DNA delivery by ultrasonic cavitation. Somat. Cell Mol. Genet. 27:115–134. [DOI] [PubMed] [Google Scholar]
- 3.Newman, C. M., and T. Bettinger. 2007. Gene therapy progress and prospects: ultrasound for gene transfer. Gene Ther. 14:465–475. [DOI] [PubMed] [Google Scholar]
- 4.Deng, C. X., F. Sieling, H. Pan, and J. Cui. 2004. Ultrasound-induced cell membrane porosity. Ultrasound Med. Biol. 30:519–526. [DOI] [PubMed] [Google Scholar]
- 5.Hauff, P., S. Seemann, R. Reszka, M. Schultze-Mosgau, M. Reinhardt, T. Buzasi, T. Plath, S. Rosewicz, and M. Schirner. 2005. Evaluation of gas-filled microparticles and sonoporation as gene delivery system: feasibility study in rodent tumor models. Radiology. 236:572–578. [DOI] [PubMed] [Google Scholar]
- 6.Ohl, C. D., M. Arora, R. Ikink, N. de Jong, M. Versluis, M. Delius, and D. Lohse. 2006. Sonoporation from jetting cavitation bubbles. Biophys. J. 91:4285–4295. [DOI] [PMC free article] [PubMed] [Google Scholar]
- 7.Hallow, D. M., A. D. Mahajan, T. E. McCutchen, and M. R. Prausnitz. 2006. Measurement and correlation of acoustic cavitation with cellular bioeffects. Ultrasound Med. Biol. 32:1111–1122. [DOI] [PubMed] [Google Scholar]
- 8.Mehier-Humbert, S., F. Yan, P. Frinking, M. Schneider, R. H. Guy, and T. Bettinger. 2007. Ultrasound-mediated gene delivery: influence of contrast agent on transfection. Bioconjug. Chem. 18:652–662. [DOI] [PubMed] [Google Scholar]
- 9.Lai, C. Y., C. H. Wu, C. C. Chen, and P. C. Li. 2006. Quantitative relations of acoustic inertial cavitation with sonoporation and cell viability. Ultrasound Med. Biol. 32:1931–1941. [DOI] [PubMed] [Google Scholar]
- 10.Stuhmer, W. 1998. Electrophysiologic recordings from Xenopus oocytes. Methods Enzymol. 293:280–300. [DOI] [PubMed] [Google Scholar]


