Abstract
Context:
Many National Football League (NFL) teams practice 2 times per day over consecutive days in a hot and humid environment. Large body surface area (BSA) and use of protective equipment result in high sweat rates and total sweat loss in these football players.
Objective:
To compare sweat rate, sweat loss, fluid consumption, and weight loss between NFL linemen and backs during preseason practices.
Design:
Between-groups design.
Setting:
Preseason training camp with wet bulb globe temperature between 19°C and 25°C.
Patients or Other Participants:
Eight linemen and 4 backs and receivers participated.
Main Outcome Measure(s):
Data were collected during both practice sessions on 2 separate days during the first week of August. Sweat rate was calculated as change in mass adjusted for all fluids consumed between prepractice and postpractice body mass measurements and the urine produced during practice divided by the length of the practice session. Gross daily sweat losses also were calculated.
Results:
Height, mass, and BSA were higher in linemen than in backs. Sweat rate was also higher in linemen (2385 ± 520 mL/h) than in backs (1410 ± 660 mL/h, P < .001), as was the total volume of sweat lost during both practices in 1 day (6870 ± 1034 mL/d versus 4110 ± 2287 mL/d, P = .014). Compared with backs, linemen consumed more fluids during practice (2030 ± 849 mL versus 1179 ± 753 mL, P = .025) but produced less urine (53 ± 73 mL versus 163 ± 141 mL, P = .018). There was no difference in postpractice weight loss (linemen = −1.15 ± 0.83%, backs = −1.06 ± 0.76%).
Conclusions:
Linemen sweated at higher rates, lost larger volumes of sweat, consumed more fluids, and produced less urine during practice compared with the physically smaller backs, but they did not lose a greater percentage of body weight. Sodium losses could be considerable in NFL players during the preseason because of high daily sweat losses in backs and in linemen.
Keywords: thermoregulation, fluid replacement, sodium losses, hyperthermia
Key Points.
During twice-daily preseason practices, professional football linemen demonstrated higher sweat rates and greater sweat loss volume compared with backs and receivers.
Linemen consumed more fluids than receivers and backs but produced less urine, resulting in a smaller percentage of weight loss.
Significant correlations existed between sweat rate and body surface area and between sweat rate and mass.
In a review of numerous early studies of adult male subjects, Torii1 indicated that maximal sweat rates during exercise in hot conditions ranged from 900 mL/h to 2000 mL/h, depending on heat acclimatization, with typical mean sweat rates between 1000 mL/h and 1800 mL/h. In 1979, Nadel2 reported that the maximal rate of sweating was 20 g/min (1200 mL/h) to 25 g/min (1500 mL/h). More recently, researchers3,4 reported mean sweat rates of 1380 mL/h and 1710 mL/h for the average man during cycling and running in hot conditions. In a study of collegiate cross-country runners, Fowkes Godek et al5 found sweat rate data similar to those of Millard-Stafford et al.4 These runners, who ranged in mass from 58 kg to 75 kg, sweated at an average rate of 1700 mL/h while running continuously in hot (35°C) conditions. However, one of the runners sweated at nearly 2500 mL/h, indicating considerable individual variability.5
Male athletes participating in sports such as soccer, running, or cycling present relatively homogeneous physical characteristics. They are typically average-sized athletes with a height of 178 cm to 183 cm, a mass of 68 kg to 78 kg, and a body surface area (BSA) of 1.85 m2 to 2.0 m2. Unlike these athletes, American football players present a heterogeneous population with greater variations in height, mass, BSA, and percentage of body fat.6,7 For example, a running back with a mass of 82 kg and height of 175 cm has a BSA of 2.0 m2, whereas an offensive lineman with a mass of 138 kg and height of 188 cm has a BSA of 2.6 m2.
Extrinsic factors, such as environmental conditions, clothing type, and equipment worn, and intrinsic factors, such as metabolic rate and BSA, contribute to an athlete's sweat rate. Athletes with greater body mass, particularly lean muscle mass, have a higher metabolic rate than smaller athletes exercising at the same intensity.8 Additionally, athletes with greater BSA may have additional sweat glands or, more likely, larger-diameter sweat glands that promote higher rates of sweating compared with smaller BSA athletes.9,10 In the group of runners that Fowkes Godek et al5 studied, the mean BSA of 1.87 m2 and mean sweat rate of 1700 mL/h were identical to those means reported by Millard-Stafford et al.4 Conversely, the mean body mass and BSA of the 10 collegiate football players in this aforementioned study,4 which included receivers, defensive backs, linebackers, and linemen, were 117 kg and 2.4 m2, respectively. Subsequently, these football players exhibited a greater sweat rate (>2 L/h) than runners exercising in identical environmental conditions.5 Because the body mass and BSA of football players vary considerably depending on the positions that they play, it is intuitive to expect sweat rates and, therefore, sweat losses would differ as well. However, this has not been investigated. Physical variation among football players is especially true at the professional level, where backs and receivers often weigh approximately 80 kg and have a BSA of 1.9 m2, whereas offensive linemen may exceed 160 kg with a BSA of 2.8 m2.6 Athletic trainers who work with American football athletes must understand positional differences in fluid turnover if, in fact, they exist. Therefore, the purpose of our study was to compare sweat rate, sweat loss, fluid consumption, and body weight loss between National Football League (NFL) linemen and backs during preseason practices.
Methods
Participants
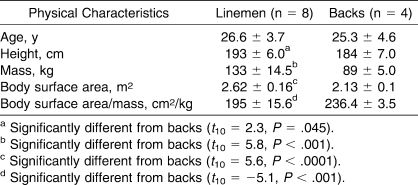
Eight linemen (1 offensive guard, 2 offensive tackles, 1 center, 2 tight ends, 1 defensive end, and 1 defensive tackle) and 4 backs (2 corner backs and 2 wide receivers) volunteered to participate in the study. Physical characteristics for the 2 groups are reported in the Table. All 12 players were members of the same NFL team that held preseason practices at an eastern Pennsylvania university during the last week of July and early August. All participants signed consent forms. The Institutional Review Board of Human Subjects Subcommittee at the lead author's university approved the study.
Table.
Physical Characteristics of Linemen and Backs
Procedures
Sweat rate data were collected during both the 2-hour morning (8:45–10:45 am) and 1-hour afternoon (2:45–3:45 pm) practice sessions on 2 separate days during the first week of August. Four linemen and 2 backs were studied on each day, and environmental conditions were similar. Mean wet bulb globe temperatures during the 2 morning practices were 21.5°C and 19°C and during the 2 afternoon practices were 25°C and 24.5°C. The players wore full equipment consisting of helmets, shoulder pads, football pants, and jerseys for the morning sessions and wore helmets, shells, shorts, and jerseys for afternoon practices.
Before each practice, players voided their bladders and, under the supervision of a research assistant, recorded body mass to the nearest 0.5 lb (0.225 kg) on a scale (Cambridge GSE 460; Blackstone Scale Systems, Loveland, OH) while dressed in dry shorts or a towel just before putting on their equipment. They refrained from drinking until on-field warm-ups, at which time all subjects drank water, carbohydrate-and-electrolyte drinks, or both from premeasured, individually labeled containers. For every 2 subjects, a personal fluid attendant offered free access to the fluids of their choice throughout the practice sessions. Players were instructed not to let fluids fall to the ground while they were drinking. Urinals were available during practice, but no player in the study used them. After practice, participants immediately showered, towel dried, voided their bladders completely for volumetric measurements, and recorded postpractice body mass. Sweat rate was calculated as change in mass adjusted for all fluids consumed between prepractice and postpractice measurements of mass. Urine produced during practice was divided by the length of the practice session as follows:
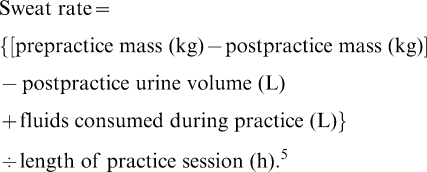 |
Mean sweat rate was calculated as the average of the morning and afternoon rates of sweating for each player. Sweat rate data were not adjusted for weight losses associated with energy metabolism or respiratory fluid losses. Gross daily sweat losses were calculated as total volume of sweat lost in the morning and afternoon practices and did not account for additional sweat losses outside of practice. The BSA was calculated using the following formula11:
Statistical Analysis
Group differences for the dependent variables of sweat rate (mL/h), BSA-adjusted sweat rate (mL/m2 per hour), gross daily sweat loss (L/d), fluids consumed during practices (mL), urine produced during practices (mL), postpractice percentage of dehydration, and all physical characteristics were analyzed using independent t tests. We calculated Pearson product moment correlations to assess the relationships between sweat rate and BSA, sweat rate and mass, and sweat loss and fluid consumption during practices. The α level was set a priori at .05. We used VassarStats (2008; Vassar College, Poughkeepsie, NY) to analyze the data.
Results
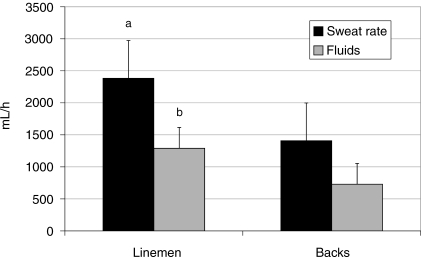
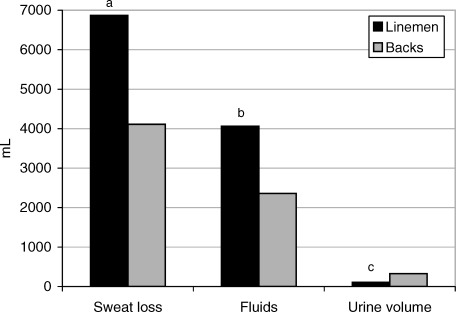
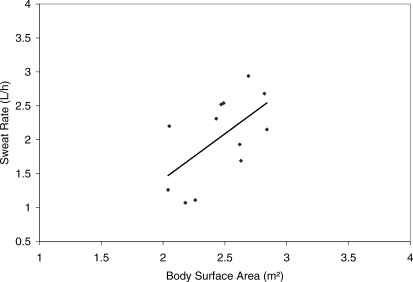
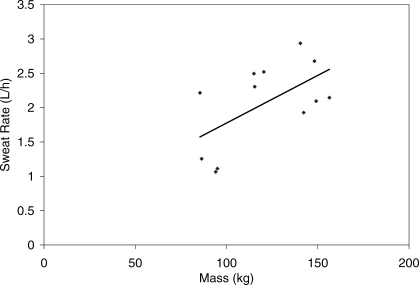
Height, mass, and BSA were higher in the linemen than in the backs, but the BSA-to-mass ratio was lower in the linemen (Table). As depicted in Figure 1, sweat rate (mL/h) was also higher in linemen (2385 ± 520 mL/h) than in backs (1410 ± 660 mL/h, t22 = 3.9, P < .001) and ranged from 520 mL/h in a wide receiver during a morning practice to 3284 mL/h in an offensive guard during an afternoon practice. However, when adjusted for BSA, the difference in sweat rates approached, but did not reach, significance (linemen = 888 ± 219 mL/m2 per hour, backs = 670 ± 328 mL/m2 per hour, t22 = 2.0, P = .06). The rate of fluid consumption was also greater in linemen than in backs (1288 ± 260 mL/h versus 729 ± 390 mL/h, t10 = 2.96, P = .014) (Figure 1). Mean fluid consumption during practices was greater in linemen (2030 ± 849 mL versus 1179 ± 753 mL, t22 = 2.4, P = .025); however, linemen produced less urine (53 ± 73 mL versus 163 ± 141 mL, t22 = −2.6, P = .018). Total volume of sweat lost during both practices in 1 day was higher in linemen (6870 ± 1034 mL/d) than in backs (4110 ± 2287 mL/d, t22 = 2.96, P = .014) and ranged from 2300 mL/d to 8230 mL/d (Figure 2). Total daily fluid consumption during practices was higher in linemen (4.06 ± 1.02 L) than in backs (2.36 ± 1.45 L); however, total daily urine production was less in linemen (106 ± 128 mL) than in backs (327 ± 134 mL) (Figure 2). Percentage of weight lost during practices was not different between the linemen (−1.15 ± 0.83%) and backs (−1.06 ± 0.76%, t22 = −0.3, P = .80), ranging from 0.0% to 2.78%. As shown in Figure 3, a moderate but significant correlation existed between sweat rate and BSA (r = .59, P = .043) and between sweat rate and mass (r = .59, P = .046, Figure 4). The correlation between sweat loss and fluid consumption approached significance (r = .57, P = .053).
Figure 1. Sweat rate and fluid consumption rate in linemen versus backs. a Indicates P < .001; b P = .014.
Figure 2. Total volume of sweat loss, fluids consumed, and urine volume produced in morning and afternoon practices combined.a Indicates P = .014; b P = .025; c P = .018.
Figure 3. Correlation between sweat rate and body surface area.
Figure 4. Correlation between sweat rate and body surface area.
Discussion
We are the first investigators to report on positional differences in sweat rate and fluid turnover in American football players. The data confirmed our expectation that linemen sweat at a greater rate and, therefore, lose a greater volume of fluid during practices than physically smaller backs. Several explanations are possible for this finding, including larger BSA and greater body mass in the linemen and potential differences in evaporative cooling. Interestingly, in 2 reports describing environmental and host factors influencing the control of sweat rate during exercise, body size and BSA were not included as potential contributing factors.2,12 We believe that this oversight may be a result of previous research that did not include subjects the size of American football players exercising in hot conditions while wearing protective equipment. Although we chose to cite only a few, the literature is filled with studies of sweat rate, sweat loss, and fluid replacement in average male runners, cyclists, or soccer players in various environmental conditions.3–5,13–19 The average sweat rates of these athletes exercising in warm or hot conditions were between 1000 mL/h and 1800 mL/h, as documented in both experimental studies and in field investigations.3–5,13,16,18,19 Indeed, the average sweat rate of the backs in our study (1410 mL/h), who had a mean body mass of 89 kg and BSA of 2.13 m2, was similar to that of average-sized males.
Both the onset and rate of sweating are determined largely by the athlete's metabolic rate and core body temperature, which are a consequence of exercise intensity and body mass.1,2,8,19,20 Although we were not able to quantify exercise intensity, the linemen did have a significantly higher mass and, therefore, would have a greater metabolic rate at a given exercise intensity.20 Investigators21,22 recently documented higher maximal core temperatures in football interior linemen than in smaller players.
Additionally, the considerable difference in BSA between linemen (2.62 m2) and backs (2.13 m2) might explain the higher sweat rates in the linemen. The lead author and colleagues5 reported substantial differences in the sweat rates of athletes whose range in body mass was 58 kg to 141 kg and BSA was 1.6 m2 to 2.7 m2, which is likely due to differences in the number, diameter, and total size of sweat glands. Sato and Sato10 isolated eccrine sweat glands from skin biopsies of 12 male subjects and reported that the diameter of sweat glands varied from 30 μm to 48 μm, with total sweat gland size ranging from 1.35 mm3 × 10−3 to 7.27 mm3 × 10−3. Subsequently, the maximal rate of sweat production from individual sweat glands was as low as 0.76 nL/min per gland and as high as 10.1 nL/min per gland. Importantly, the correlation between sweat rate and glandular size was significantly high (r = 0.81, P < .005).10 Compared with backs, linemen likely have larger sweat glands. Recently reported data showed a moderately high correlation (r = 0.77) between sweat rate and BSA in football players.21 The notion that both mass and BSA contribute to higher rates of sweating in larger players is further supported by the significant correlations between sweat rate and mass and between sweat rate and BSA in our study.
Another contributing factor to higher sweat rates in linemen may be lower rates of evaporative cooling. Because of inherent differences in the type of exercise that linemen perform and the type that backs perform, linemen may experience reduced air flow and, therefore, less evaporative heat loss, subsequently causing a greater rate of sweating.23 Researchers have suggested that this, along with lower BSA to mass ratios,24 may be a contributing factor to the higher core temperatures documented in linemen compared with backs.21
Adams et al23 showed that in a 35°C environment, participants who exercised in still-air conditions (<0.2 m/s) experienced less evaporative cooling, higher sweat rates, and higher core temperatures than those who cycled with a facing wind speed of 3 m/s. Saunders et al25 identified the importance of appropriate air flow and evaporative cooling. Empirically, backs typically run a minimum of 10 yd (9.14 m) and often 25 yd (22.86 m) or more per play, whereas linemen rarely move more than 10 yd (9.14 m) off the line of scrimmage. In addition, backs begin plays in an upright posture and generally not in close proximity to other players. On the other hand, linemen line up within 1 yd (0.9 m) to 2 yd (1.8 m) of each other and, before the snap of the ball, maintain a 3-point stance, placing their bodies closer to the ground, where airflow is likely to be diminished. Laboratory research clearly shows that evaporative cooling is much less effective in still-air conditions than when air velocity across the skin is more than 3 m/s, which is equal to the facing wind speed that would occur while jogging 40 yd (36.58 m) in 12.12 seconds. In actuality, NFL receivers, defensive backs, and running backs who run at their top speeds would have a rate of evaporative cooling approximately 3 times higher than the rate Saunders et al25 quantified in their experimental study.
With the exception of Fowkes Godek et al,5 no investigators have compared the sweat rates of football players and average-sized athletes. Most studies have involved average-sized participants and have been experimental in nature, which may not accurately reflect the conditions under which a football player practices on the field in equipment.3,8,13,17,23,25,26 Bartolozzi and Fowkes Godek28 documented differences in sweat rates in collegiate football players when they exercised in an environmental chamber compared with when they participated in football practices. Specifically, 10 collegiate football players (height = 188 ± 4.8 cm, mass = 116.6 ± 16 kg) participated in 2 separate experimental dehydration trials and 2 days of field data collection during preseason practices. Similar to many of the aforementioned studies, the experimental protocol consisted of 60 minutes to 90 minutes of continuous cycling and walking at a moderate intensity in an environmental chamber. Sweat rates were measured during the experimental trials while the participants exercised in shorts, shirts, and shoes and then again using the identical method on 2 separate days (4 practices) during the preseason while they practiced in equipment. Environmental conditions (range, 32–35°C) were similar during all trials. Sweat rates were averaged for the 2 experimental and 4 field trials and were different during football practice (2091 ± 560 mL/h) than during the experimental trials (1813 ± 330 mL/h) (P < .02).27 This finding led to the conclusion that sweat rate responses to continuous exercise in football players participating in experimental trials while dressed in shirts, shorts, and shoes do not accurately reflect their actual sweat rate responses during practices when they are wearing protective equipment. In addition, exercise intensity and, therefore, metabolic heat production were likely greater while participating in actual football practices. It is notable that the mean sweat rate of the 10 collegiate players (2091 ± 560 mL/h) with a mass of approximately 117 kg and BSA of 2.41 m2 was nearly identical to the mean sweat rate of the 12 NFL players in our study (2033 ± 629 mL/h) who had an average mass of 120 kg and BSA 2.46 m2.
During the last several years, we have learned considerably more about thermoregulation in football players during actual preseason football practices, and our findings have not always supported data from previous laboratory research in which authors sought to generalize their results to actual football activity.28,29 Many authors4,24,30,31 adjusted for BSA or mass by analyzing sweat rate data in terms of mL (or g)/m2 per minute or mL/kg per hour. This is likely of little consequence when the cohort is homogenous with respect to body size, and we believe that understanding actual player sweat rates and volume of fluid lost on a daily basis is more important for the clinician. The NFL players in our study were only practicing for 3 h/d on data collection days, yet some of them lost more than 8.2 L/d of sweat. Importantly, investigators5,32 documented mean sweat losses of approximately 9.5 L/d in a group of collegiate subjects including linemen and backs, with one 139-kg lineman exceeding 14.5 L/d.
Given the large volume of sweat lost per day, some players could struggle to maintain normal blood-sodium levels. Researchers33–36 have reported significantly lower blood-sodium levels and hypovolemia in both collegiate and NFL players during the preseason, which we believe is partially due to excessive sodium losses over consecutive days. Burkholder et al37 recently reported a mean sodium concentration of 53 ± 17 mmol/L (range, 20–85 mmol/L) in sweat samples taken from 18 professional football players during the first and third weeks of preseason practice. Therefore, increased sodium consumption is clearly necessary for most NFL players during the preseason because of high daily sweat losses in both smaller (4.1 L/d) and larger (6.9 L/d) players. This is especially true for heavy sweaters, who may lose 11 g of sodium per day.37 Two of the 8 linemen in our study lost more than 8 L/d of sweat while practicing for only 3 hours, indicating that with twice-daily practices longer than 2 hours each, sodium replacement requirements could be substantially higher. Additionally, all players were mildly dehydrated (range of body weight loss, 0.0–2.8%), which should have helped protect them from blood-sodium dilution. However, the fact that the players consumed adequate hypotonic fluids during practices to maintain near-normal hydration (mean body weight losses of 1.15% in linemen and 1.06% in backs) suggests an even greater importance for increased sodium intake, particularly at meals.
Conclusions
Many NFL teams practice 2 times per day on consecutive days during July and August when environmental conditions are frequently hot and humid. The combination of large BSA, large body mass, and use of protective equipment results in higher sweat rates among football players compared with sweat rates of average-sized athletes in other sports. Additionally, positional differences may also be a contributing factor in evaporative heat loss and warrant further investigation. In our study, NFL linemen sweated at higher overall rates and lost larger volumes of sweat during practices compared with backs. They consumed more fluids and produced less urine during practices compared with backs and, therefore, did not lose a larger percentage of body weight. Clinicians must recognize the high sweat rate and volume that football players regularly lose during days when they participate in double sessions. Importantly, replacing large daily sweat losses with hypotonic fluids may predispose these athletes to low blood-sodium levels; therefore, significant sodium intake is likely necessary for maintaining fluid homeostasis.
Acknowledgments
This study was supported by a Faculty Development Grant from West Chester University, West Chester, PA. We thank the 12 football players and the coaching staff of the Philadelphia Eagles for their commitment to this study. We also thank Tom Hunkele, PT, ATC; Rob Roche, MS, ATC; and Bill Fowkes for assisting with the data collection.
Footnotes
Sandra Fowkes Godek, PhD, ATC, contributed to conception and design; acquisition and analysis and interpretation of the data; and drafting, critical revision, and final approval of the article. Arthur R. Bartolozzi, MD, contributed to conception and design, analysis and interpretation of the data, and critical revision and final approval of the article. Richard Burkholder, MS, ATC, contributed to acquisition of the data, and critical revision and final approval of the article. Eric Sugarman, MEd, ATC, contributed to acquisition and analysis and interpretation of the data, and critical revision and final approval of the article. Chris Peduzzi, MA, ATC, contributed to acquisition of the data, and critical revision and final approval of the article.
References
- 1.Torii M. Maximal sweating rate in humans. J Human Ergol (Tokyo) 1995;24(2):137–152. [PubMed] [Google Scholar]
- 2.Nadel E.R. Control of sweating rate while exercising in the heat. Med Sci Sports Exerc. 1979;11(1):31–35. [PubMed] [Google Scholar]
- 3.Green J.M, Pritchett R.C, Tucker D.C, Crews T.R, McLester J.R. Sweat lactate response during cycling at 30 degrees C and 18 degrees C WBGT. J Sports Sci. 2004;22(4):321–327. doi: 10.1080/02640410310001641575. [DOI] [PubMed] [Google Scholar]
- 4.Millard-Stafford M, Sparling P.B, Rosskopf L.B, Snow T.K, DiCarlo L.J, Hinson B.T. Fluid intake in male and female runners during a 40-km field run in the heat. J Sports Sci. 1995;13(3):257–263. doi: 10.1080/02640419508732235. [DOI] [PubMed] [Google Scholar]
- 5.Fowkes Godek S, Bartolozzi A.R, Godek J.J. Sweat rates and fluid turnover in American football players compared with runners in a hot and humid environment. Br J Sports Med. 2005;39(4):205–211. doi: 10.1136/bjsm.2004.011767. [DOI] [PMC free article] [PubMed] [Google Scholar]
- 6.Kraemer W.J, Torine J.C, Silvestre R, et al. Body size and composition of National Football League players. J Strength Cond Res. 2005;19(3):485–489. doi: 10.1519/18175.1. [DOI] [PubMed] [Google Scholar]
- 7.Noel M.B, VanHeest J.L, Zaneteas P, Rodgers C.D. Body composition in Division I football players. J Strength Cond Res. 2003;17(2):228–237. doi: 10.1519/1533-4287(2003)017<0228:bcidif>2.0.co;2. [DOI] [PubMed] [Google Scholar]
- 8.Marino F.E, Mbambo Z, Kortekaas E, et al. Advantages of smaller body mass during distance running in warm, humid environments. Pflugers Arch. 2000;441(2–3):359–367. doi: 10.1007/s004240000432. [DOI] [PubMed] [Google Scholar]
- 9.Havenith G, Luttikholt V.G, Vrijkotte T.G. The relative influence of body characteristics on humid heat stress response. Eur J Appl Physiol Occup Physiol. 1995;70(3):270–279. doi: 10.1007/BF00238575. [DOI] [PubMed] [Google Scholar]
- 10.Sato K, Sato F. Individual variations in structure and function of human eccrine sweat gland. Am J Physiol. 1983;245(2):203R–208R. doi: 10.1152/ajpregu.1983.245.2.R203. [DOI] [PubMed] [Google Scholar]
- 11.DuBois D, Dubois E.F. A formula to estimate the approximate surface area if height and weight be known. Arch Int Med. 1916;17:863–871. [Google Scholar]
- 12.Armstrong L.E, Maresh C.M. Effects of training, environment, and host factors on the sweating response to exercise. Int J Sports Med. 1998;19(suppl 2):103S–105S. doi: 10.1055/s-2007-971969. [DOI] [PubMed] [Google Scholar]
- 13.Daries H.N, Noakes T.D, Dennis S.C. Effect of fluid intake volume on 2-h running performances in a 25 degrees C environment. Med Sci Sports Exerc. 2000;32(10):1783–1789. doi: 10.1097/00005768-200010000-00019. [DOI] [PubMed] [Google Scholar]
- 14.Leiper J.B, Pitsiladis Y, Maughan R.J. Comparison of water turnover rates in men undertaking prolonged cycling exercise and sedentary men. Int J Sports Med. 2001;22(3):181–185. doi: 10.1055/s-2001-15912. [DOI] [PubMed] [Google Scholar]
- 15.Maughan R.J, Merson S.J, Broad N.P, Shirreffs S.M. Fluid and electrolyte intake and loss in elite soccer players during training. Int J Sport Nutr Exerc Metab. 2004;14(3):333–346. doi: 10.1123/ijsnem.14.3.333. [DOI] [PubMed] [Google Scholar]
- 16.Shirreffs S.M, Aragon-Vargas L.F, Chamorro M, Maughan R.J, Serratosa L, Zachwieja J.J. The sweating response of elite professional soccer players to training in the heat. Int J Sports Med. 2005;26(2):90–95. doi: 10.1055/s-2004-821112. [DOI] [PubMed] [Google Scholar]
- 17.Sanders B, Noakes T.D, Dennis S.C. Water and electrolyte shifts with partial fluid replacement during exercise. Eur J Appl Physiol Occup Physiol. 1999;80(4):318–323. doi: 10.1007/s004210050598. [DOI] [PubMed] [Google Scholar]
- 18.Vrijens D.M, Rehrer N.J. Sodium-free fluid ingestion decreases plasma sodium during exercise in the heat. J Appl Physiol. 1999;86(6):1847–1851. doi: 10.1152/jappl.1999.86.6.1847. [DOI] [PubMed] [Google Scholar]
- 19.Noakes T.D, Myburgh K.H, du Plessis J, et al. Metabolic rate, not percent dehydration, predicts rectal temperature in marathon runners. Med Sci Sports Exerc. 1991;23(4):443–449. [PubMed] [Google Scholar]
- 20.Dennis S.C, Noakes T.D. Advantages of a smaller body mass in humans when distance-running in warm, humid conditions. Eur J Appl Physiol Occup Physiol. 1999;79(3):280–284. doi: 10.1007/s004210050507. [DOI] [PubMed] [Google Scholar]
- 21.Godek S.F, Bartolozzi A.R, Burkholder R, Sugarman E, Dorshimer G. Core temperature and percentage of dehydration in professional football linemen and backs during preseason practices. J Athl Train. 2006;41(1):8–17. [PMC free article] [PubMed] [Google Scholar]
- 22.Burkholder R, Fowkes Godek S, Bartolozzi A, Sugarman E, Garvin G, Dorshimer G. Core temperature response in NFL players during pre-season practices in full pads versus shell and shorts [abstract]. J Athl Train. 2006;41(suppl 2):47S–48S. [Google Scholar]
- 23.Adams W.C, Mack G.W, Langhans G.W, Nadel E.R. Effects of varied air velocity on sweating and evaporative rates during exercise. J Appl Physiol. 1992;73(6):2668–2674. doi: 10.1152/jappl.1992.73.6.2668. [DOI] [PubMed] [Google Scholar]
- 24.Shvartz E, Saar E, Benor D. Physique and heat tolerance in hot-dry and hot-humid environments. J Appl Physiol. 1973;34(6):799–803. doi: 10.1152/jappl.1973.34.6.799. [DOI] [PubMed] [Google Scholar]
- 25.Saunders A.G, Dugas J.P, Tucker R, Lambert M.I, Noakes T.D. The effects of different air velocities on heat storage and body temperature in humans cycling in a hot, humid environment. Acta Physiol Scand. 2005;183(3):241–255. doi: 10.1111/j.1365-201X.2004.01400.x. [DOI] [PubMed] [Google Scholar]
- 27.Sanders B, Noakes T.D, Dennis S.C. Sodium replacement and fluid shifts during prolonged exercise in humans. Eur J Appl Physiol. 2001;84(5):419–425. doi: 10.1007/s004210000371. [DOI] [PubMed] [Google Scholar]
- 28.Bartolozzi A.R, Fowkes Godek S. Sweat rate and core temperature responses to dehydration induced experimentally versus during actual pre-season practice in college football players [abstract]. J Athl Train. 2004;39(suppl 2):56S. [Google Scholar]
- 29.Kulka T.J, Kenney W.L. Heat balance limits in football uniforms: how different uniform ensembles alter the equation. Physician Sportsmed. 2002;30(7):29–39. doi: 10.3810/psm.2002.07.377. [DOI] [PubMed] [Google Scholar]
- 30.McCullough E.A, Kenney W.L. Thermal insulation and evaporative resistance of football uniforms. Med Sci Sports Exerc. 2003;35(5):832–837. doi: 10.1249/01.MSS.0000064998.48130.22. [DOI] [PubMed] [Google Scholar]
- 31.Millard-Stafford M, Sparling P.B, Rosskopf L.B, Hinson B.T, DiCarlo L.J. Carbohydrate-electrolyte replacement during a simulated triathlon in the heat. Med Sci Sports Exerc. 1990;22(5):621–628. doi: 10.1249/00005768-199010000-00013. [DOI] [PubMed] [Google Scholar]
- 32.Shapiro Y, Pandolf K.B, Goldman R.F. Predicting sweat loss response to exercise, environment and clothing. Eur J Appl Physiol Occup Physiol. 1982;48(1):83–96. doi: 10.1007/BF00421168. [DOI] [PubMed] [Google Scholar]
- 33.Fowkes Godek S, Bartolozzi A.R. Hydration and core temperature in a football player during preseason: a case study. Athl Ther Today. 2004;9(4):64–70. [Google Scholar]
- 34.Fowkes Godek S, Bartolozzi A.R, Kelly M. Changes in blood electrolytes and plasma volume in NFL football players during pre-season training. Med Sci Sports Exerc. 2004;36(5):49S. [Google Scholar]
- 35.Fowkes Godek S, Sugarman E, Burkholder R, Dorshimer G. Blood, urine and body weight measures of hydration status in NFL players exposed to an aggressive hydration program during preseason training [abstract]. J Athl Train. 2004;39(suppl 2):59S. [Google Scholar]
- 36.Godek J.J, Fowkes Godek S. Core temperature and dehydration status in Division II collegiate football players during two different NCAA mandated pre-season practice schedules [abstract]. J Athl Train. 2004;39(suppl 2):59S–60S. [Google Scholar]
- 37.Godek S.F, Godek J.J, Bartolozzi A.R. Hydration status in college football players during consecutive days of twice-a-day preseason practices. Am J Sports Med. 2005;33(6):843–851. doi: 10.1177/0363546504270999. [DOI] [PubMed] [Google Scholar]
- 38.Burkholder R, Fowkes Godek S, Peduzzi C, Condon S, Kopec J, Greene R. Sweat sodium content and sodium losses in NFL players during practices in week 1 versus week 3 of preseason [abstract]. J Athl Train. 2007;42(suppl 2):59S. [Google Scholar]


