Abstract
Type I IFNs (interferons) (IFNα/β) form a family of related cytokines that control a variety of cellular functions through binding to a receptor composed of IFNAR (IFNα receptor subunit) 1 and 2. Among type I IFNs, the α2 and β subtypes exhibit a large difference in their binding affinities to IFNAR1, and it was suggested that high concentrations of IFNAR1 may compensate for its low intrinsic binding affinity for IFNα2. We tested whether receptor-proximal signalling events are sensitive to IFNAR1 surface concentration by investigating the relationship between relative IFNAR1/IFNAR2 surface levels and IFNα2 and IFNβ signalling potencies in several cell lines. For this, we monitored the activation profile of JAK (Janus kinase)/STAT (signal transducer and activator of transcription) proteins, measured basal and ligand-induced surface decay of each receptor subunit and tested the effect of variable IFNAR1 levels on IFNα2 signalling potency. Our data show that the cell-surface IFNAR1 level is indeed a limiting factor for assembly of the functional complex, but an increased concentration of it does not translate into an IFNα/β differential JAK/STAT signalling nor does it change the dynamics of the engaged receptor. Importantly, however, our data highlight a differential effect upon routing of IFNAR2. Following binding of IFNα2, IFNAR2 is internalized, but, instead of being routed towards degradation as it is when complexed to IFNβ, it recycles back to the cell surface. These observations suggest strongly that the stability and the intracellular lifetime of the ternary complex account for the differential control of IFNAR2. Moreover, the present study opens up the attractive possibility that endosomal-initiated signalling may contribute to IFNα/β differential bioactivities.
Keywords: interferon α (IFNα), interferon β (IFNβ), interferon α/β receptor, internalization, Janus kinase (JAK), signal transducer and activator of transcription (STAT)
Abbreviations: Ab, antibody; APC, allophycocyanin; CHX, cycloheximide; EGFP, enhanced green fluorescent protein; HEK, human embryonic kidney; IFN, interferon; IFNAR1/2, IFNα receptor subunit 1/2; JAK, Janus kinase; mAb, monoclonal Ab; RNAi, RNA interference; siRNA, small interfering RNA; STAT, signal transducer and activator of transcription; TfR, transferrin receptor; Tyk2, tyrosine kinase 2
INTRODUCTION
Type I IFNs (interferons) are helical cytokines with pleiotropic activities that contribute to immediate defence against pathogens, development of adaptive immunity and protective anti-tumour responses [1]. Accordingly, type I IFNs regulate diverse activities of non-immune and immune cells and are also regulators of bone homoeostasis. A unique feature of this cytokine family is the existence of a multiplicity of ligands. In humans, the family comprises 16 IFN subtypes, broadly referred to as IFNα/β, all binding the ubiquitously expressed type I IFN receptor, made of IFNAR (IFNα receptor subunit) 1 and 2. These latter are single-membrane-spanning proteins belonging to the class 2 cytokine receptor superfamily [2]. Upon IFN binding, membrane-proximal immediate signalling is initiated through catalytic activation of receptor-associated Tyk2 (tyrosine kinase 2) and JAK1 (Janus kinase 1) tyrosine kinases [3,4]. STAT (signal transducer and activator of transcription) family members, such as the ubiquitously expressed STAT1/2/3, are then tethered to the activated receptor complex via specific phosphotyrosine recruitment motifs, undergo phosphorylation on tyrosine residues and translocate to the nucleus to drive gene expression. Non-STAT signalling pathways can also be activated by type I IFNs and are believed to modulate gene expression and to shape IFN-induced bioactivities in defined cellular contexts [5,6]. IFN also activates membrane-proximal signalling events that promote receptor down-modulation and signal termination [7,8].
It is well documented that IFNα and IFNβ engage the receptor components with different efficiencies [9–11]. Recent work has extended previous studies and has determined the biophysical parameters of binding (association and dissociation rate constants) of type I IFN subtypes to the extracellular domains of the two receptor subunits immobilized on an artificial lipid support [12]. These in vitro analyses showed that affinities and rate constants of IFNα2 and IFNβ interaction with the receptor ectodomains are different. IFNα2 exhibits nanomolar binding affinity, and IFNβ exhibits ∼100 pM binding affinity for IFNAR2. Larger differences were observed in the ligand-binding affinity for IFNAR1. IFNα2 exhibits micromolar binding affinities to the IFNAR1 ectodomain, whereas IFNβ exhibits ∼50 nM binding affinity for IFNAR1. It was demonstrated that the kinetics of dissociation of IFNα, but not of IFNβ, from the immobilized complex is strongly affected by the concentration of IFNAR1 [12,13]. Moreover, it was proposed that the differential potency of IFN subtypes to elicit an antiproliferative response lies in their different ability to bind IFNAR1 [14]. Overall, these studies suggested that recruitment of IFNAR1 is a rate-limiting step in the assembly of the ternary ligand–receptor complex and that a sufficiently high concentration of IFNAR1 may compensate for its low intrinsic affinity for IFNα2.
Since IFNAR1 is the low-affinity component in the formation of the ternary complex, one would predict that immediate receptor-initiated signalling events may be sensitive to IFNAR1 surface concentration. Indeed, the level of cellular IFNAR1 appears to be tightly regulated. We have shown that IFNAR1 is a relatively short-lived protein that matures to the cell surface and is rapidly internalized and degraded, unless stabilized through its association with Tyk2 [15]. Upon IFNα binding, IFNAR1 is targeted to degradation through a biochemical cascade that has been in part elucidated and requires Tyk2 catalytic activity [8,16].
On the basis of these premises, our primary goal was to investigate the relationship between IFNAR1 and IFNAR2 surface levels and immediate-early signalling events, i.e. activation of JAK/STAT molecules and receptor down-modulation, induced by IFNα2 or IFNβ. For this, in the present study, we have measured relative levels of IFNAR1 and IFNAR2 expressed in different human cell lines and monitored early kinetics and dose-dependence of JAK/STAT activation. We have also studied basal and ligand-induced surface decay of IFNAR1 and IFNAR2. To test directly the effect of variable IFNAR1 levels, we have artificially modulated its concentration and analysed possible effects on IFN signalling potency.
Despite the heterogeneity in the levels of the two subunits in different cell lines, a unifying concept emerges from this comprehensive analysis that points to comparable levels of activation of JAK/STAT molecules in response to the two IFN subtypes and to a differential effect on traffic of IFNAR2.
EXPERIMENTAL
Cell culture and transfection procedures
HEK-293T (human embryonic kidney) and HeLa cells were cultured in DMEM (Dulbecco's modified Eagle's medium), and Daudi and Jurkat cells were cultured in RPMI 1640 medium, supplemented with 10% foetal calf serum at 37 °C in 6% CO2. Human amnion-derived WISH cells were transfected using the calcium phosphate DNA-precipitation technique. To overexpress IFNAR1, a plasmid encoding IFNAR1 and pSV2neo were co-transfected at a ratio of 10:1. Clones were selected in 1.2 mg/ml G418 (Geneticin; Invitrogen).
To silence IFNAR1, a 19 nt siRNA (small interfering RNA) was designed to target the 3′-UTR (untranslated region) mRNA sequence of IFNAR1. The sequence ATACGGGCAAGCTCTTAAC was inserted into the RNAi (RNA interference) vector pSUPERretro (OligoEngine) as indicated by the manufacturer. This puroR (puromycin-resistant) siRNA plasmid was co-transfected with pSV2neo at molar ratio of 10:1. Cells were first selected in G418 to favour clones with highest amount of plasmid DNA. G418R (G418-resistant) clones were then kept in puromycin to maintain pressure for the siRNA plasmid. Clones were screened for IFNAR1 levels by flow cytometry using mAb [monoclonal Ab (antibody)] AA3. For the experiment shown in Figure 8, HEK-293T cells were transiently transfected using Lipofectamine™ (Invitrogen) with an expression plasmid encoding either IFNAR1 or the IFNAR1-specific RNAi described above. All transfections included an EGFP (enhanced green fluorescent protein) expression plasmid at a ratio of 1:50 of total DNA. Transfection mixtures were normalized for the same concentration of total DNA with the corresponding empty vector. At 2 days after transfection, cells were treated for 2 h with 200 pM IFNα2 or IFNβ or left untreated, and receptor levels were analysed by flow cytometry.
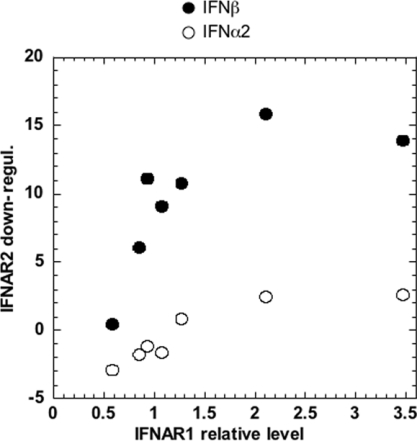
Figure 8. Ligand-induced down-regulation of IFNAR2 in HEK-293T cells expressing different levels of IFNAR1.
HEK-293T cells were transiently co-transfected with EGFP and either an IFNAR1-silencing vector or an IFNAR1-expression vector. An aliquot of the transfected cells was monitored for EGFP and IFNAR1 levels. In parallel, cells were treated with 200 pM IFNα2 or IFNβ for 2 h, or left untreated, and levels of IFNAR2 were measured in chosen EGFP-positive subpopulations. IFNAR1 relative level (x-axis) represents the amount of surface IFNAR1 in transfected cells relative to endogenous IFNAR1 (marked as 1) in untreated cells. The extent of IFNAR2 down-regulation (y-axis) is expressed as the difference in the geometric mean of IFNAR2-specific fluorescence between untreated cells and cells treated with IFNα2 (○) or IFNβ (●).
Ab and other reagents
Recombinant IFNα2b was a gift from Dr Dirk Gewert (Wellcome Foundation, Beckenham, Kent, U.K.; now at BioLauncher Ltd, Cambridge, U.K.) or Dr Günther Adolf (Ernst Boehringer Institute, Vienna, Austria), and IFNβ was from Dr Laura Runkel (Biogen Idec, Cambridge, MA, U.S.A.). IFNs were purified to specific activities >108 IU/mg of protein. CHX (cycloheximide) (Sigma) was used at 20 μg/ml on HeLa and HEK-293T cells and at 10 μg/ml on Jurkat and Daudi cells. Monensin (Sigma) was solubilized in 100% ethanol and used at 25 μM. Human transferrin (Sigma) was solubilized in cell culture medium and was used at 50 μg/ml. Phospho-Ser535-specific IFNAR1 Abs (antibodies), described in [17], were a gift from Dr Serge Fuchs (School of Medicine, University of Pennsylvania, Philadelphia, PA, U.S.A.). Tyk2 phospho-specific Abs were from Calbiochem. Tyk2 mAb T10-2 was described in [18]. Phosphotyrosine-specific anti-STAT1 and anti-STAT2 Abs were from Upstate and phosphotyrosine-specific anti-STAT3 Abs were from BioLabs. Anti-STAT1, -STAT2 and -STAT3 Abs and 4G10 anti-phosphotyrosine mAb were from Upstate. Anti-ubiquitin FK2 mAb was from Biomol; anti-IFNAR1 mAbs (AA3 and EA12) were gifts from Dr Laura Runkel, and 64G12 was from Dr Pierre Eid (CNRS, Villejuif, France). Anti-IFNAR2 mAb CD118 was purchased from PBL Biochemical Laboratories. Anti-IFNAR2 mAbs H10 and D5 were from Dr Laura Runkel.
Flow-cytometric analysis
Transiently transfected HEK-293T cells (see Figure 8) were stained with mAbs AA3 (IFNAR1) and D5 (IFNAR2) and signals were amplified with biotinylated rat anti-(mouse IgG) (Jackson Immunochemicals) and APC (allophycocyanin)-conjugated streptavidin (Becton Dickinson) and analysed with a FACScalibur. IFNAR1 and IFNAR2 expression levels were determined by the geometric mean APC fluorescence values within subpopulations of transfected cells identified by the intensity of EGFP fluorescence. To assess the effect of monensin (shown in Figure 9A), down-regulation of the TfR (transferrin receptor) from the cell surface was studied. Briefly, HeLa cells were starved for 1 h, pre-incubated for 15 min with 25 μM monensin before the addition of 50 μg/ml transferrin for 30 min. For the results shown in Figure 9(B), cells were pre-incubated with monensin 15 min before addition of IFNα or IFNβ. Surface IFNAR1 was monitored by incubating cells with 10 μg/ml mAb AA3, and surface IFNAR2 was monitored using 10 μg/ml mAb CD118 for 30 min on ice, followed by 30 min incubation with 10 μg/ml biotinylated anti-(mouse IgG) and with streptavidin–phycoerythrin (Jackson ImmunoResearch Laboratories). The level of surface TfR was monitored with OKT9 mAb (a gift from Dr Andres Alcover, Institut Pasteur, Paris, France). Cells were analysed using a FACscan (Becton Dickinson), using CellQuest software.
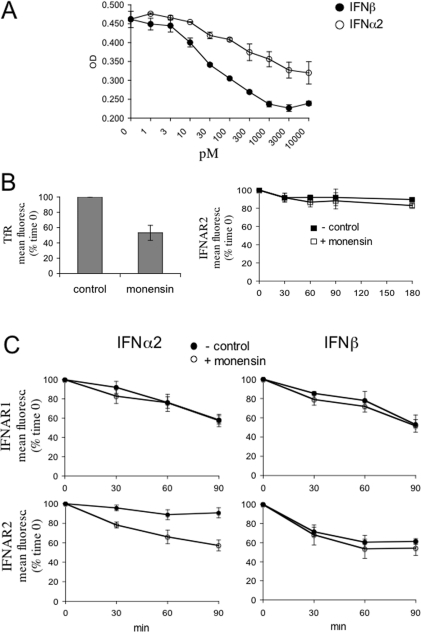
Figure 9. IFNα2-induced recycling of IFNAR2 in HeLa cells.
(A) IFN-induced antiproliferative effect in HeLa cells. Cells were either left untreated or treated with the indicated concentrations of IFNα2 (○) or IFNβ (●) for 72 h. Cell density was monitored by Crystal Violet staining as described in the Experimental section. The mean absorbance (OD) values of triplicate datasets are shown. (B) HeLa cells were either left untreated or treated with 25 μM monensin for 30 min in the presence of transferrin (50 μg/ml) and the level of TfR at the cell surface was measured by flow cytometry (left-hand panel). Results are percentages of the mean fluorescence (fluoresc.) at zero time (means±S.E.M. for four experiments). In the right-hand panel, the basal decay of IFNAR2 from the cell surface was monitored in the presence (□) or absence (■) of monensin for the indicated times using flow cytometry. Results are percentages of the mean fluorescence (fluoresc.) at zero time (means±S.E.M. for three experiments). (C) IFNα2-induced IFNAR2 recycling. HeLa cells were treated with 500 pM IFNα2 (left-hand panels) or IFNβ (right-hand panels) in the presence (○) or absence (●) of monensin for the indicated times, and the surface levels of IFNAR1 and IFNAR2 were analysed by flow cytometry. Results are percentages of the mean fluorescence (fluoresc.) at zero time (means±S.E.M. for three experiments).
Protein analysis by immunoblot
Cell lysates were prepared in modified RIPA buffer (50 mM Tris/HCl, pH 8, 150 mM NaCl, 1% Nonidet P40, 0.5% sodium deoxycholate and 0.03% SDS) with 1 mM Na3VO4 and a cocktail of antiproteases from Sigma. For the experiment shown in Figure 5, cells were lysed in NP40 buffer (50 mM Tris/HCl, pH 8, 150 mM NaCl, 1% Nonidet P40, 0.5 mM EDTA, 1 mM Na3VO4, 10 mM N-ethylmaleimide and antiproteases). IFNAR1 was immunoprecipitated with 1 μg of mAb EA12 and detected with mAb 64G12. IFNAR2 was immunoprecipitated with 1 μg of mAb CD118 and detected with a mixture of H10 and D5 mAbs.
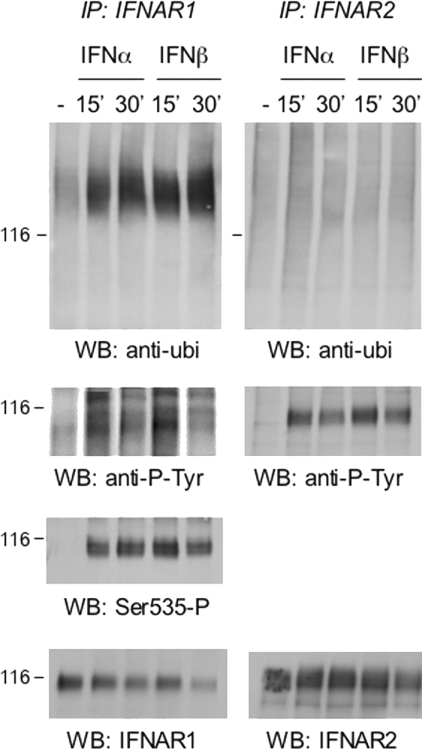
Figure 5. Ligand-induced post-translational modifications of IFNAR1 and IFNAR2.
Daudi cells were treated with 500 pM IFNα2 or IFNβ for the indicated times. Total lysates (5 mg) were used to immunoprecipitate endogenous IFNAR1 and IFNAR2. Immunoprecipitates were resolved by SDS/PAGE, and the extent of ubiquitination of the receptors was analysed using anti-ubiquitin (ubi) Abs (top panels). Note the shift in migration of IFNAR1 due to induced ubiquitination. The left-hand membrane was stripped and reprobed with anti-phosphotyrosine 4G10 mAb, phospho-Ser535-IFNAR1-specific Abs and anti-IFNAR1 mAb, as indicated. The right-hand membrane was stripped and reprobed with anti-phosphotyrosine 4G10 mAb and anti-IFNAR2 mAb, as indicated. Migration of the 116 kDa marker is indicated on the left (116). Results are representative of at least three different experiments. IP, immunoprecipitation; WB, Western blot.
Antiproliferative effect
HeLa cells were plated in 96-well plates at a density of 2500 cells/well. After 20 h, cells were left untreated or treated with 1 pM–10 μM of either IFNα or IFNβ for an additional 72 h. Cells were then washed with PBS, fixed with paraformaldehyde and stained with 0.5% (w/v) Crystal Violet for 5 min. After removing the solution, cells were washed with deionized water and air-dried. Crystal Violet was solubilized with 1% (v/v) Triton X-100. Absorbance was measured at 570 nm.
RESULTS
Lack of correlation between R2/R1 ratios and JAK/STAT activation
In order to analyse early signalling events in cells expressing different surface levels of IFNAR1, we first measured the relative ratio of IFNAR1 and IFNAR2 present at the surface of four human cell lines. The steady-state levels of IFNAR1 and IFNAR2 were measured by flow cytometry, using two mAbs (AA3 and CD118) and an identical staining protocol (see the Experimental section). Daudi (Burkitt's lymphoma B-lymphocytes), Jurkat (leukaemia T-lymphocytes), HEK-293T (human embryonic kidney cells) and HeLa (carcinoma-derived epithelioid cells) were analysed. As shown in Figure 1(A), the relative expression of the two subunits (referred as the R2/R1 ratio) was remarkably dissimilar, with two extreme profiles represented by Jurkat (R2/R1 ratio of approx. 4) and HeLa (R2/R1 ratio of approx. 0.5) cells.
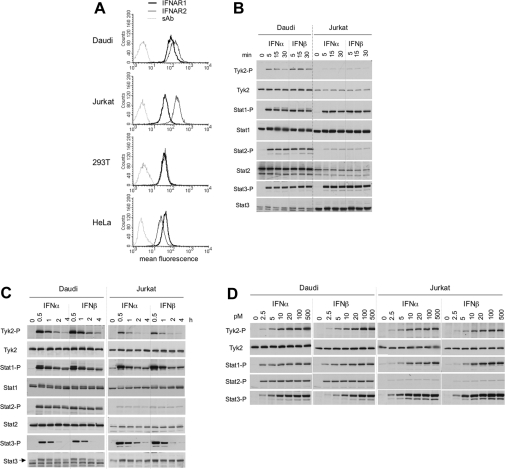
Figure 1. Surface levels of IFNAR1 and IFNAR2 and profiles of IFN-induced JAK/STAT phosphorylation in four cell lines.
(A) Steady-state levels of IFNAR1 and IFNAR2 at the cell surface of the indicated cell lines were measured by flow cytometry. 293T, HEK-293T. (B and C) Kinetics of IFNα- and IFNβ-induced Tyk2 and STAT1/2/3 phosphorylation in Daudi and Jurkat cells. Cells were incubated with 500 pM IFNα2 or IFNβ for the indicated time. Total lysates (40 μg) were resolved by SDS/PAGE, and the levels of phosphorylated or total Tyk2 and STAT1/2/3 were analysed by Western blotting. (D) Dose–response profiles of Tyk2 and STAT1/2/3 phosphorylation (-P) after IFNα2 or IFNβ treatment of Daudi and Jurkat cells. Cells were treated with the indicated doses (from 2.5 to 500 pM) of IFNα2 or IFNβ for 30 min. Lysates (40 μg) were analysed as described in (A). Results are representative of at least three different experiments.
On the basis of these profiles, we chose Daudi and Jurkat cells for further studies. These cells express different R2/R1 ratios (approx. 2 in Daudi cells and approx. 4 in Jurkat cells) and, being both of lymphoid origin, are best amenable to direct comparison. We first analysed early kinetics of JAK/STAT phosphorylation induced by a single dose (500 pM) of either IFN subtype. Within 15 min of stimulation, phosphorylation of examined proteins was close to maximal levels (Figures 1B and 1C). At approx. 30 min, phosphorylation started to decline, with the exception of STAT2 which persisted for at least 4 h. The profiles of IFNα2- and IFNβ-stimulated signals in each cell line were remarkably similar. However, phosphorylated Tyk2 and STAT2 were more abundant in Daudi cells, whereas phosphorylated STAT3 was more abundant in Jurkat cells. Notably, the extent of phosphorylation of these proteins closely reflected their total content in each cell line (Figures 1B and 1C).
Next, we analysed dose–response profiles of Tyk2 and STAT1/2/3 phosphorylation after 30 min of treatment with IFNα2 or IFNβ (Figure 1D). In both cell lines, phosphorylation of Tyk2 and STAT1/3 was dose-dependent, reaching saturation at approx. 100 pM of either IFN subtype. Surprisingly, phosphorylation of STAT2 appeared not to be dose-dependent within the range of cytokine dose tested (Figure 1D). In conclusion, the magnitude and duration of JAK/STAT activation by IFNα and IFNβ were virtually identical in each of the two cell lines and similar conclusions were reached from analyses of phosphorylation profiles in HEK-293T and HeLa cells (results not shown). Moreover, we could not directly correlate R2/R1 ratios either with IFNα/β differential signalling or with sensitivity to IFNα2.
IFNAR1 is limiting for ligand-induced JAK/STAT activation
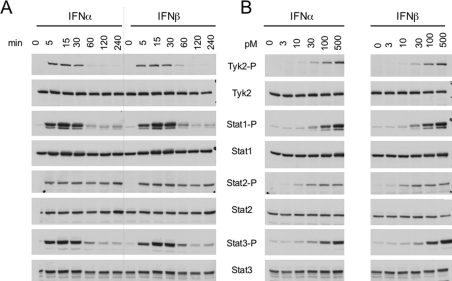
Comparison of signalling in different cell types presents obvious limitations, one being the variable content of signalling effectors. Thus we decided to monitor IFNα/β signalling in sister clones expressing different levels of IFNAR1. For this, we chose human WISH cells, well known for their IFNα/β differential antipro-liferative response [13]. As shown in Figure 2, the comparative analysis performed in these cells did not reveal IFNα/β differential potency in JAK/STAT signalling and confirmed the distinctive profile of STAT2 activation with respect to STAT1/3.
Figure 2. IFNα2- and IFNβ-induced phosphorylation profiles in WISH cells.
(A) Kinetics of Tyk2 and STAT1/2/3 phosphorylation in WISH cells treated with 500 pM IFNα2 or IFNβ for the indicated times. (B) Dose–response profiles of Tyk2 and STAT1/2/3 phosphorylation (-P) in WISH cells treated for 15 min with IFNα2 or IFNβ. Lysates (40 μg) were analysed by Western blotting. Results are representative of at least three different experiments.
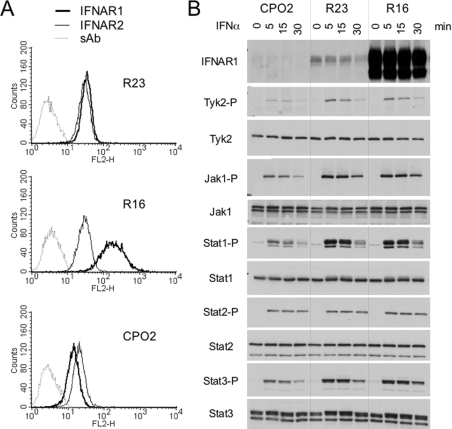
Three stable transfectants were derived from WISH (parental) cells: a control clone (R23) expressing IFNAR1 at the same level as parental cells, a clone that overexpressed IFNAR1 (R16) and a clone with low IFNAR1 (CPO2) which was obtained by RNAi technology (see the Experimental section). The relative surface level of the two receptor subunits in these clones is shown in Figure 3(A). IFNAR1 was approx. 7-fold higher in R16 cells and 2-fold lower in CPO2 cells with respect to R23 or parental WISH cells. As expected, IFNAR2 levels were comparable in all clones. Using Western blot analysis, the IFNAR1 level was barely detectable in CPO2 cells and was strongly increased in R16 cells compared with endogenous IFNAR1 in R23 cells (Figure 3B, top panel).
Figure 3. Levels of IFNAR1 and IFNAR2 and IFNα2-induced phosphorylation profiles in WISH-derived clones.
(A) Surface IFNAR1 and IFNAR2 levels in stable WISH clones measured by flow cytometry. Three stable clones were derived from WISH parental cells: one depleted of endogenous IFNAR1 (CPO2), one overexpressing IFNAR1 (R16), and one expressing IFNAR1 as in parental cells (R23). (B) Total IFNAR1 content and IFNα-induced JAK/STAT phosphorylation (-P) in CPO2, R23 and R16 clones. Cells were incubated with 500 pM IFNα2 for the indicated time. Lysates (40 μg) were analysed by Western blotting. Results are representative of at least three different experiments. The lower band visible in the R16 samples represents a 95 kDa incompletely processed IFNAR1 species which accumulates when the protein is overexpressed [15].
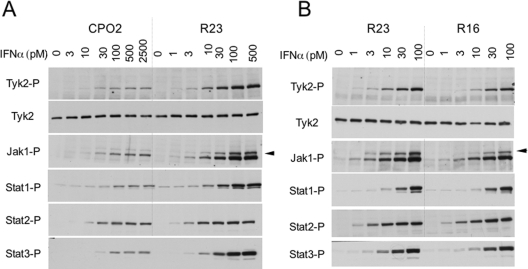
To investigate whether surface IFNAR1 concentration affected sensitivity to IFNα2, we compared the JAK/STAT activation profile of these clones. Cells were incubated with 500 pM IFNα2 for 5, 15 or 30 min, and protein phosphorylation was monitored (Figure 3B). Phosphorylation of all proteins, with the exception of STAT2, was reduced in CPO2 cells compared with the other clones. Interestingly, STAT2 phosphorylation was comparable in the three clones and did not decay with time. We further compared CPO2 and R23 cells to assess whether the weak response of CPO2 cells could be augmented further by increasing the IFNα2 dose. As shown in Figure 4(A), even at the highest dose tested (2500 pM), the response of CPO2 cells remained low, approaching that of control R23 cells stimulated with 10 pM.
Figure 4. Dose–response profiles of IFNα2-induced JAK/STAT phosphorylation in WISH-derived clones.
(A) CPO2 and R23 cells were treated with increasing doses of IFNα2 for 15 min. Note the maximal dose (2500 pM) added on CPO2 cells. (B) R23 and R16 cells were treated with IFNα2 (from 1 to 100 pM) for 15 min. Total lysates (40 μg) were resolved by SDS/PAGE and levels of phosphorylated (-P) Tyk2, JAK1 and STAT1/2/3 were analysed by Western blotting. The arrowhead points to a band, identified as phospho-Tyk2, which cross-reacts with anti-phospho-JAK1 Abs.
Despite the remarkable difference of IFNAR1 levels in R16 and R23 cells, their JAK/STAT phosphorylation profiles by IFNα were quite comparable (Figure 3B). To explore the possibility of an increased IFNα2 sensitivity of R16 cells, we compared response profiles of the two clones to low ligand doses (Figure 4B). If anything, R16 cells were slightly less responsive than R23 to low cytokine doses. Altogether, these data showed that a mere 2-fold decrease in surface IFNAR1, as in CPO2 cells, had a considerable impact on the magnitude of signalling and on the IFNα sensitivity threshold. Conversely, a surplus of IFNAR1 over endogenous level did not translate into increased signalling or in increased sensitivity to IFNα. These results demonstrate that cell-surface IFNAR1 concentration is indeed a critical factor for assembly of a functional signalling complex, but its increased concentration does not augment IFNα, or IFNβ (results not shown), signalling potency. Moreover, these results imply that assembly of the trimeric ligand–receptor complex is the step determining the extent of downstream JAK/STAT activation.
IFNβ, but not IFNα2, induces IFNAR2 down-regulation
Along with JAK/STAT engagement, binding of IFN also triggers membrane-proximal signals which promote internalization and drive endosomal sorting of the engaged receptor. Numerous studies have implicated ubiquitination of ligand-activated receptors as a signal for endosomal sorting towards degradation [19–21]. Previous findings showed that, upon IFNα binding, IFNAR1 becomes serine phosphorylated and consequently ubiquitinated before lysosomal degradation [8]. Much less is known about ligand-induced post-translational modification and traffic of IFNAR2. We therefore tested whether IFNα2 and IFNβ led to differential modification of IFNAR1 and/or IFNAR2. As shown in Figure 5 (left-hand panels), IFNAR1 was inducibly phosphorylated on tyrosine and on Ser535 and heavily ubiquitinated. IFNAR2 was inducibly phosphorylated on tyrosine, but was not ubiquitinated (Figure 5, right-hand panels). All modifications were induced to a similar extent by IFNα2 and IFNβ. Similar conclusions were reached upon analysis of HeLa cells (results not shown).
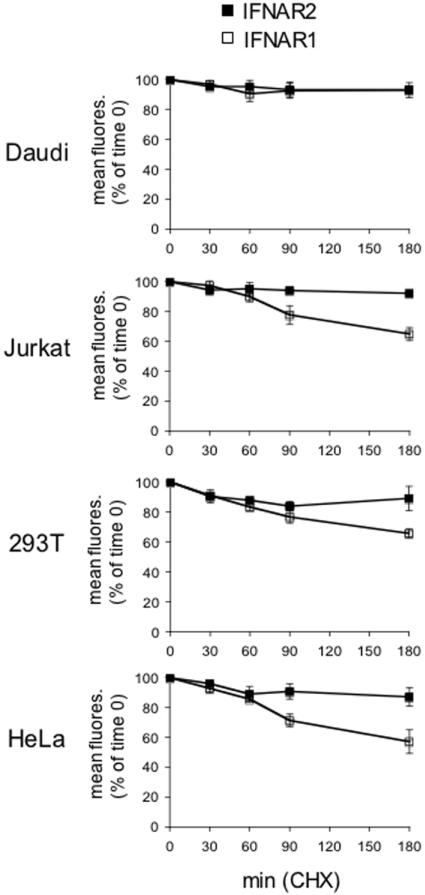
Jaitin et al. [13] recently showed that a 2 h stimulation of HEK-293T cells with IFNβ, but not IFNα, causes down-regulation of surface IFNAR2. We thus asked whether this IFNβ-specific effect could be generalized to other cell types and whether different surface R2/R1 ratios (as in cell lines shown in Figure 1A) influenced this IFNα/β differential trait. In order to thoroughly assess the effect of ligand binding on receptor dynamics, we first determined in the four cell lines the surface stability of each receptor subunit in the absence of stimulus. Cells were treated with CHX to prevent new protein synthesis and the decay of each subunit was followed by flow cytometry (Figure 6). Interestingly, IFNAR2 displayed an apparent slow basal turnover, with 90% of the initial content present at 3 h. On the other hand, surface IFNAR1 decayed rapidly in all but Daudi cells, with between 55 and 60% of the initial values remaining at 3 h (Figure 6). The different stability of the two receptor subunits was also confirmed by Western blot analyses (results not shown). Overall, these results showed that the two receptor subunits have different basal turnovers, with IFNAR1 being considerably more dynamic than IFNAR2.
Figure 6. Basal decay of surface IFNAR1 and IFNAR2.
Surface stability of IFNAR1 and IFNAR2 in unstimulated cells. Decay of IFNAR1 (□) and IFNAR2 (■) from the surface of Daudi, Jurkat, HEK-293T (293T) and HeLa cells treated with CHX was measured by flow cytometry. Results are percentages of the mean fluorescence (fluores.) at zero time (means±S.E.M. for four experiments).
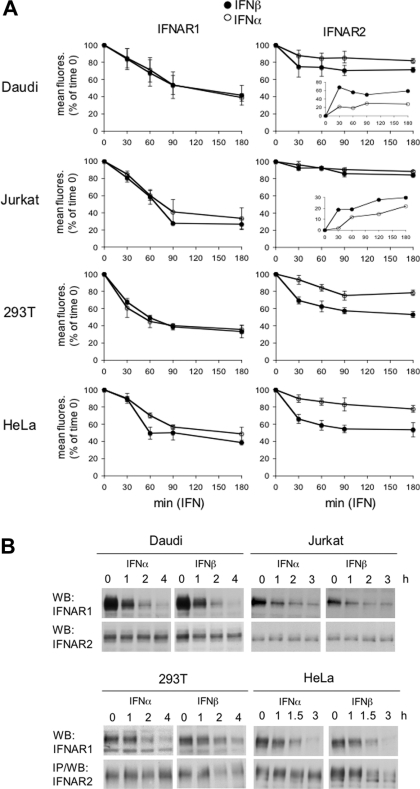
Surface IFNAR1 and IFNAR2 levels were then monitored in cells treated with IFNα2 or IFNβ in the presence of CHX (Figure 7A). Within the first 1 h, IFNAR1 decreased more rapidly in cells treated with either ligand than in CHX-only-treated cells shown in Figure 6. This ligand-induced acceleration was observed in all cell types (Figure 7A, left-hand panels). At 90 min, the rate of decay decreased, approaching the basal rate seen in Figure 6. Importantly, a clear difference in down-regulation of IFNAR2 by the two ligands was observed for HEK-293T and HeLa cells. IFNβ caused a substantial decrease (approaching 50% at 90 min) in surface IFNAR2, whereas IFNα2 had a minimal effect (Figure 7A, right-hand panels). The differential effect of IFNα2 and IFNβ on IFNAR2 down-regulation was less pronounced in Daudi cells and appeared negligible in Jurkat cells. Since these cells express higher levels of IFNAR2 relative to IFNAR1 (high R2/R1 ratio), the percentage of mobilized IFNAR2 may be small and uncomplexed IFNAR2 may remain at the cell surface. Indeed, a differential effect between IFNα2 and IFNβ was evident upon plotting arbitrary IFNAR2 internalization units instead of percentages of initial values (insets in Figure 7A). Western blot analyses of total receptor content confirmed the ligand-induced decrease in IFNAR1 in the four cell lines. The decrease in IFNAR2 was detectable in IFNβ-treated HEK-293T and HeLa cells, but not in Jurkat or Daudi cells (Figure 7B).
Figure 7. Ligand-induced down-regulation of IFNAR1 and IFNAR2.
(A) IFNAR1 (left-hand panels) and IFNAR2 (right-hand panels) decay from the cell surface was measured by flow cytometry in cells treated with CHX and 500 pM IFNα2 (○) or IFNβ (●) for the indicated times. Results are percentages of the mean fluorescence (fluores.) at zero time (means±S.E.M. for at least three different experiments). Insets show the difference between mean fluorescence values measured in untreated and IFN-treated cells. 293T, HEK-293T. (B) Daudi, Jurkat, HEK-293T (293T) and HeLa cells were treated with 500 pM IFNα2 or IFNβ for the indicated times. Total lysates (40 μg) were resolved by SDS/PAGE, and levels of IFNAR1 and IFNAR2 were analysed by Western blotting (WB) using corresponding Abs. IP, immunoprecipitation.
To study the effect of varying IFNAR1 level on IFNAR2 down-regulation, we depleted or overexpressed IFNAR1 in HEK-293T cells (see the Experimental section) and monitored by FACS receptor levels after 2 h of treatment with IFNα2 or IFNβ. As seen in Figure 8, in response to IFNα2, the surface decay of IFNAR2 was minimal even in cells with a surplus of IFNAR1 compared with control cells (endogenous IFNAR1 level taken as 1). Thus the failure of IFNα2 to promote IFNAR2 down-regulation is not due to limiting amounts of IFNAR1. In response to IFNβ, IFNAR2 was down-regulated in control cells as expected. The amount of down-regulated IFNAR2 diminished in cells depleted of IFNAR1, but did not proportionally increase in cells with a surplus of IFNAR1.
Overall, these results demonstrate a differential effect on post-binding receptor dynamics, with IFNβ solely being able to down-modulate IFNAR2. Although this IFNβ-specific effect can be generalized to different cell types, the extent by which it is experimentally detectable appears to depend on the relative expression level of the two chains and hence on the proportion of IFNAR2 which is engaged in the trimeric complex.
IFNα2 induces IFNAR2 recycling
We have shown above that IFNα2 failed to down-regulate surface IFNAR2, although it efficiently accelerated IFNAR1 down-regulation. We reasoned that the constant level of IFNAR2 measured at the cell surface could either reflect stability at the plasma membrane or result from the dynamic equilibrium between IFNα-induced internalization and recycling. In order to distinguish between these two possibilities, we used monensin, a drug that blocks recycling without affecting the internalization process [22]. The toxic effect of monensin on the viability of different cell lines was tested. HeLa cells were chosen as they were minimally affected by the drug. Moreover, in these cells a 2-log difference in the antiproliferative potencies of IFNβ and IFNα2 could be measured (Figure 9A).
To control the action of the ionophore, we monitored the surface level of the TfR, which undergoes continuous recycling in the presence of transferrin [23]. As expected, the TfR level decreased approx. 50% in monensin-treated cells. In the same condition, basal IFNAR2 turnover was unaffected (Figure 9B). HeLa cells were then treated with IFNα2 or IFNβ in the presence or absence of monensin, and surface decay of IFNAR1 and IFNAR2 was measured by flow cytometry. Monensin did not affect IFNAR1 dynamics (Figure 9C, upper panels), neither did it affect the disappearance of surface IFNAR2 induced by IFNβ (lower right-hand panel). However, monensin led to a substantial decrease of surface IFNAR2 in cells treated with IFNα (lower left-hand panel). Thus, following binding of IFNα2 to the receptor complex, IFNAR2 is indeed internalized, but, instead of being routed towards a degradation pathway, it appears to recycle back to the cell surface.
DISCUSSION
The evolutionary conservation of multiple type I IFN subtypes in all eutherian mammals evokes distinct physiological roles despite shared receptor usage. In the present study, we have investigated whether IFNα2 and IFNβ, well described for their different mode of engagement of the receptor, differ in membrane-proximal signalling potency and in receptor down-regulation processes. In particular, we have studied cell lines that express endogenous IFNAR1 and IFNAR2 at different relative ratios and evaluated potential contribution of this ratio to early JAK/STAT signalling by the two IFN subtypes. Our major observations can be summarized as follows: (i) within each cell line, the phosphorylation profiles of JAK/STAT molecules induced by IFNα2 or IFNβ are virtually identical within the first 4 h of stimulation; (ii) the extent of tyrosine phosphorylation of JAK/STAT components appears to be proportional to the amount of protein in the cell, rather than to the R2/R1 ratio; (iii) the activation profile of STAT2 differs from that of Tyk2 and STAT1/3 and this in all cellular contexts analysed; (iv) most remarkably, IFNα2 and IFNβ lead to differential down-regulation and routing of IFNAR2.
Previous studies have reported some differences in the phosphorylation profile of JAK/STAT proteins by IFNα and IFNβ. In human myocardial fibroblasts, selective IFNβ-induced activation of JAK1 and higher STAT1/2 phosphorylation were observed, along with a 120-fold higher sensitivity to the antiviral effect of IFNβ as compared with IFNα [24]. In human vascular endothelial cells, a 2–3-fold higher STAT1 phosphorylation was observed with IFNβ, whereas a 2–3-log difference in IFNα/β potency was measured in functional assays [25]. In monocyte-derived immature dendritic cells, levels of activation of STAT1/2 by IFNα2 and IFNβ were found to be comparable [26], as in the four human cell lines described in the present study. In summary, these results suggest that cell-type differences in the potency of the two IFN subtypes to activate membrane-proximal signalling events do exist. However, when present, these differences are relatively modest, do not reflect ligand-binding affinities for IFNAR1 and are unlikely to account for the large differences in potencies measured in functional assays. Indeed, in spite of identical phosphorylation potency, we did measure a 2-log difference in the antiproliferative potencies of IFNα2 and IFNβ on HeLa cells (Figure 9A).
It has been shown previously that IFNAR1 contributes to enhance the affinity of the cellular receptor complex for the ligand and also modulates ligand selectivity [9,27]. Studies of the assembly of the trimeric complex on artificial surfaces argued against a substantial interaction between the receptor subunits in the absence of ligand. Instead, the local concentration of IFNAR1 was shown to influence the assembly of the IFNα ternary complex [12,13]. Not surprisingly, we found that the relative surface expression level of the two IFN receptor subunits varies in different cell lines. Yet, within each cell line and regardless of the R2/R1 ratio, IFNα2- and IFNβ-induced phosphorylation profiles were comparable. Furthermore, IFNAR1 does indeed represent a critical factor for both IFNα2- and IFNβ-driven activation of the JAK/STAT signalling complex. In fact, depletion of endogenous IFNAR1 in WISH cells led to a significant reduction in signal activation which could not be compensated for by increased ligand dose. On the other hand, a surplus of IFNAR1 in WISH cells did not change the IFN sensitivity profile or the kinetics of JAK/STAT activation (Figure 3, and results not shown). Thus, in spite of the ability of IFNAR1 to compensate for weak IFNα binding, increased surface concentration of IFNAR1 does not change signalling potency.
Comparison of IFN signalling in Jurkat and Daudi cells indicated that the basal cellular content of STAT1/3, rather than receptor levels, has an impact on the extent of their phosphorylation and thus, most likely, on downstream gene induction profiles. Although this may contribute to cell-type-specific differences in IFN action, it also evokes the notion that changes in the content of STATs, as upon cell activation or differentiation, may tune IFN responses and gene-induction programmes [28–31]. Interestingly, STAT2 phosphorylation appears to be unique in all cellular contexts tested: it is saturated more readily and at lower IFN doses, is more sustained and barely affected by IFNAR1 depletion. We previously showed that STAT2, as opposed to STAT1/3, is not engaged at all upon induced dimerization of the IFNAR1 cytoplasmic domain [16]. Thus the unique STAT2 activation profile may, at least in part, be consequent to its constitutive association with the IFNAR2 chain [32].
The lack of correlation between ligand–IFNAR1 affinity and JAK/STAT activation potency suggests that IFNα/β differential bioactivities must be achieved through mechanisms other than immediate JAK/STAT activation. Moreover, these mechanisms are likely to be influenced by ligand-binding affinity. Our present analysis of ligand-induced receptor traffic provides some interesting clues to this issue. Despite the heterogeneity in the expression level of the two subunits in different cell lines, consistent differences were observed in the dynamics of the two receptor subunits. With the exception of Daudi cells, where IFNAR1 is highly expressed and stable, in all other cell lines studied IFNAR1 exhibits a relatively short half-life and is down-regulated similarly by IFNα2 and IFNβ. Interestingly, IFNAR2 exhibits a longer half-life which is differentially affected by the two IFN subtypes: following binding of IFNβ, surface IFNAR2 levels decrease, whereas, following binding of IFNα2, surface IFNAR2 remains constant as the internalized pool predominantly recycles back to the cell surface. This notion was supported by an experiment that tested the effect of monensin on receptor dynamics. In the presence of this well-characterized inhibitor of recycling, IFNα2 led to significant down-regulation of IFNAR2 (Figure 9). These results support previous biochemical demonstrations that IFNAR1 and IFNAR2 can be co-immunoprecipitated after stimulation with IFNβ, but not with IFNα [33–36]. Moreover, in one such study performed on Daudi cells, active IFNβ, but not IFNα, could be recovered in the immunoprecipitated complex [37].
Our results extend to several human cell lines the IFNα/β differential down-regulation of IFNAR2 originally reported in HEK-293T cells [13]. Moreover, our studies in these latter cells demonstrate that the IFNβ-induced down-regulation of IFNAR2 indeed depends on the formation of the ternary complex and that increasing IFNAR1 does not modify ligand capacity to down-regulate IFNAR2. These observations strongly suggest that it is the strength of ligand binding and/or the lifetime of the ternary complex which may account for the differential control of IFNAR2.
That the strength of ligand binding may be critical for receptor routing is well established. A more stable ligand–receptor interaction under the moderately acidic conditions of early endosomes may promote receptor degradation and prevent recycling [38,39]. Previous studies have implicated ubiquitination of activated receptors as a signal for endosomal sorting towards degradation [19], and the absence of ubiquitination was shown to divert internalized receptors towards the recycling pathway [20,21,40]. Although ligand-induced ubiquitination of IFNAR1 promotes its efficient sorting towards degradation [8,16], we have shown in the present study that IFNAR2 does not undergo ligand-induced ubiquitination (Figure 5). Hence, differential ubiquitination is unlikely to underlie the IFNα/β differential effect on IFNAR2 routing. An alternative possibility is that IFNβ, through efficiently bridging IFNAR2 to ubiquitinated IFNAR1, drives the complex towards a degradative pathway. Although the molecular steps by which IFNα2 and IFNβ lead to differential intracellular routing of IFNAR2 remain to be elucidated, our results imply that neither ligand properties nor receptor traffic has an impact on immediate-early activation of JAK/STAT.
Divergent endosomal sorting of activated receptors has emerged as a dynamic process that can tune and diversify intracellular signalling [41]. For example, it was shown that TGFβ (transforming growth factor β) receptors, residing in different membrane microdomains, can internalize through distinct endocytic compartments, which in turn mediate either signal activation or receptor degradation [42]. Interestingly, it has been reported that a fraction of IFNAR1 can be found in lipid rafts in HeLa cells and mouse embryo fibroblasts [43,44]. This observation raises the possibility that membrane accessibility of (competent) receptor subunits may control their basal and ligand-induced dynamics. In this scenario, the intrinsic binding property of the ligand combined with cell-type differences in availability of competent receptors would contribute to the IFNα/β differential IFNAR2 routing. Whether divergent traffic routes of the engaged receptors may shape IFN subtype-specific signalling and/or contribute to STAT-independent signalling [6] remains an appealing and open question.
Acknowledgments
We thank Pierre Eid, Dirk Gewert, Günther Adolf, Laura Runkel, Serge Fuchs and Andres Alcover for providing reagents, the platform of cytometry of the Institut Pasteur, and Frédérique Michel and Vincenzo Di Bartolo for advice and critical reading of the manuscript. Z.M. was supported by a Marie Curie International Fellowhip (contract MIF1-CT-2004-509400). This work was supported by a collaborative grant of the Association pour la Recherche sur le Cancer (number 3158 to S.P. and G.U.).
References
- 1.Vilcek J. Fifty years of interferon research: aiming at a moving target. Immunity. 2006;25:343–348. doi: 10.1016/j.immuni.2006.08.008. [DOI] [PubMed] [Google Scholar]
- 2.Pestka S., Krause C. D., Walter M. R. Interferons, interferon-like cytokines, and their receptors. Immunol. Rev. 2004;202:8–32. doi: 10.1111/j.0105-2896.2004.00204.x. [DOI] [PubMed] [Google Scholar]
- 3.Yeh T. C., Pellegrini S. The Janus kinase family of protein tyrosine kinases and their role in signaling. Cell. Mol. Life Sci. 1999;55:1523–1534. doi: 10.1007/s000180050392. [DOI] [PMC free article] [PubMed] [Google Scholar]
- 4.Haan C., Kreis S., Margue C., Behrmann I. Jaks and cytokine receptors: an intimate relationship. Biochem. Pharmacol. 2006;72:1538–1546. doi: 10.1016/j.bcp.2006.04.013. [DOI] [PubMed] [Google Scholar]
- 5.Rani M. R., Ransohoff R. M. Alternative and accessory pathways in the regulation of IFN-β-mediated gene expression. J. Interferon Cytokine Res. 2005;25:788–798. doi: 10.1089/jir.2005.25.788. [DOI] [PubMed] [Google Scholar]
- 6.van Boxel-Dezaire A. H., Rani M. R., Stark G. R. Complex modulation of cell type-specific signaling in response to type I interferons. Immunity. 2006;25:361–372. doi: 10.1016/j.immuni.2006.08.014. [DOI] [PubMed] [Google Scholar]
- 7.Basu L., Yang C. H., Murti A., Garcia J. V., Croze E., Constantinescu S. N., Mullersman J. E., Pfeffer L. M. The antiviral action of interferon is potentiated by removal of the conserved IRTAM domain of the IFNAR1 chain of the interferon α/β receptor: effects on JAK–STAT activation and receptor down-regulation. Virology. 1998;242:14–21. doi: 10.1006/viro.1997.9002. [DOI] [PubMed] [Google Scholar]
- 8.Kumar K. G., Tang W., Ravindranath A. K., Clark W. A., Croze E., Fuchs S. Y. SCFHOS ubiquitin ligase mediates the ligand-induced down-regulation of the interferon-α receptor. EMBO J. 2003;22:5480–5490. doi: 10.1093/emboj/cdg524. [DOI] [PMC free article] [PubMed] [Google Scholar]
- 9.Cutrone E. C., Langer J. A. Contributions of cloned type I interferon receptor subunits to differential ligand binding. FEBS Lett. 1997;404:197–202. doi: 10.1016/s0014-5793(97)00129-4. [DOI] [PubMed] [Google Scholar]
- 10.Lewerenz M., Mogensen K. E., Uzé G. Shared receptor components but distinct complexes for α and β interferons. J. Mol. Biol. 1998;282:585–599. doi: 10.1006/jmbi.1998.2026. [DOI] [PubMed] [Google Scholar]
- 11.Langer J. A., Cutrone E. C., Kotenko S. The Class II cytokine receptor (CRF2) family: overview and patterns of receptor–ligand interactions. Cytokine Growth Factor Rev. 2004;15:33–48. doi: 10.1016/j.cytogfr.2003.10.001. [DOI] [PubMed] [Google Scholar]
- 12.Lamken P., Lata S., Gavutis M., Piehler J. Ligand-induced assembling of the type I interferon receptor on supported lipid bilayers. J. Mol. Biol. 2004;341:303–318. doi: 10.1016/j.jmb.2004.05.059. [DOI] [PubMed] [Google Scholar]
- 13.Jaitin D. A., Roisman L. C., Jaks E., Gavutis M., Piehler J., Van der Heyden J., Uzé G., Schreiber G. Inquiring into the differential action of interferons (IFNs): an IFN-α2 mutant with enhanced affinity to IFNAR1 is functionally similar to IFN-β. Mol. Cell. Biol. 2006;26:1888–1897. doi: 10.1128/MCB.26.5.1888-1897.2006. [DOI] [PMC free article] [PubMed] [Google Scholar]
- 14.Roisman L. C., Jaitin D. A., Baker D. P., Schreiber G. Mutational analysis of the IFNAR1 binding site on IFNα2 reveals the architecture of a weak ligand–receptor binding-site. J. Mol. Biol. 2005;353:271–281. doi: 10.1016/j.jmb.2005.08.042. [DOI] [PubMed] [Google Scholar]
- 15.Ragimbeau J., Dondi E., Alcover A., Eid P., Uzé G., Pellegrini S. The tyrosine kinase Tyk2 controls IFNAR1 cell surface expression. EMBO J. 2003;22:537–547. doi: 10.1093/emboj/cdg038. [DOI] [PMC free article] [PubMed] [Google Scholar]
- 16.Marijanovic Z., Ragimbeau J., Kumar K. G., Fuchs S. Y., Pellegrini S. TYK2 activity promotes ligand-induced IFNAR1 proteolysis. Biochem. J. 2006;397:31–38. doi: 10.1042/BJ20060272. [DOI] [PMC free article] [PubMed] [Google Scholar]
- 17.Kumar K. G., Krolewski J. J., Fuchs S. Y. Phosphorylation and specific ubiquitin acceptor sites are required for ubiquitination and degradation of the IFNAR1 subunit of type I interferon receptor. J. Biol. Chem. 2004;279:46614–46620. doi: 10.1074/jbc.M407082200. [DOI] [PubMed] [Google Scholar]
- 18.Gauzzi M. C., Velazquez L., McKendry R., Mogensen K. E., Fellous M., Pellegrini S. Interferon-α-dependent activation of Tyk2 requires phosphorylation of positive regulatory tyrosines by another kinase. J. Biol. Chem. 1996;271:20494–20500. doi: 10.1074/jbc.271.34.20494. [DOI] [PubMed] [Google Scholar]
- 19.Haglund K., Sigismund S., Polo S., Szymkiewicz I., Di Fiore P. P., Dikic I. Multiple monoubiquitination of RTKs is sufficient for their endocytosis and degradation. Nat. Cell Biol. 2003;5:461–466. doi: 10.1038/ncb983. [DOI] [PubMed] [Google Scholar]
- 20.Sigismund S., Woelk T., Puri C., Maspero E., Tacchetti C., Transidico P., Di Fiore P. P., Polo S. Clathrin-independent endocytosis of ubiquitinated cargos. Proc. Natl. Acad. Sci. U.S.A. 2005;102:2760–2765. doi: 10.1073/pnas.0409817102. [DOI] [PMC free article] [PubMed] [Google Scholar]
- 21.Walrafen P., Verdier F., Kadri Z., Chretien S., Lacombe C., Mayeux P. Both proteasomes and lysosomes degrade the activated erythropoietin receptor. Blood. 2005;105:600–608. doi: 10.1182/blood-2004-03-1216. [DOI] [PubMed] [Google Scholar]
- 22.Basu S. K., Goldstein J. L., Anderson R. G., Brown M. S. Monensin interrupts the recycling of low density lipoprotein receptors in human fibroblasts. Cell. 1981;24:493–502. doi: 10.1016/0092-8674(81)90340-8. [DOI] [PubMed] [Google Scholar]
- 23.Dautry-Varsat A., Ciechanover A., Lodish H. F. pH and the recycling of transferrin during receptor-mediated endocytosis. Proc. Natl. Acad. Sci. U.S.A. 1983;80:2258–2262. doi: 10.1073/pnas.80.8.2258. [DOI] [PMC free article] [PubMed] [Google Scholar]
- 24.Grumbach I. M., Fish E. N., Uddin S., Majchrzak B., Colamonici O. R., Figulla H. R., Heim A., Platanias L. C. Activation of the Jak–Stat pathway in cells that exhibit selective sensitivity to the antiviral effects of IFN-β compared with IFN-α. J. Interferon Cytokine Res. 1999;19:797–801. doi: 10.1089/107999099313659. [DOI] [PubMed] [Google Scholar]
- 25.da Silva A. J., Brickelmaier M., Majeau G. R., Lukashin A. V., Peyman J., Whitty A., Hochman P. S. Comparison of gene expression patterns induced by treatment of human umbilical vein endothelial cells with IFN-α2b vs. IFN-β1a: understanding the functional relationship between distinct type I interferons that act through a common receptor. J. Interferon Cytokine Res. 2002;22:173–188. doi: 10.1089/107999002753536149. [DOI] [PubMed] [Google Scholar]
- 26.Severa M., Remoli M. E., Giacomini E., Ragimbeau J., Lande R., Uzé G., Pellegrini S., Coccia E. M. Differential responsiveness to IFN-α and IFN-β of human mature DC through modulation of IFNAR expression. J. Leukocyte Biol. 2006;79:1286–1294. doi: 10.1189/jlb.1205742. [DOI] [PubMed] [Google Scholar]
- 27.Russell-Harde D., Pu H., Betts M., Harkins R. N., Perez H. D., Croze E. Reconstitution of a high affinity binding site for type I interferons. J. Biol. Chem. 1995;270:26033–26036. doi: 10.1074/jbc.270.44.26033. [DOI] [PubMed] [Google Scholar]
- 28.Dupont S. A., Goelz S., Goyal J., Green M. Mechanisms for regulation of cellular responsiveness to human IFN-β1a. J. Interferon Cytokine Res. 2002;22:491–501. doi: 10.1089/10799900252952280. [DOI] [PubMed] [Google Scholar]
- 29.Radaeva S., Jaruga B., Kim W. H., Heller T., Liang T. J., Gao B. Interferon-γ inhibits interferon-α signalling in hepatic cells: evidence for the involvement of STAT1 induction and hyperexpression of STAT1 in chronic hepatitis C. Biochem. J. 2004;379:199–208. doi: 10.1042/BJ20031495. [DOI] [PMC free article] [PubMed] [Google Scholar]
- 30.Gil M. P., Salomon R., Louten J., Biron C. A. Modulation of STAT1 protein levels: a mechanism shaping CD8 T-cell responses in vivo. Blood. 2006;107:987–993. doi: 10.1182/blood-2005-07-2834. [DOI] [PMC free article] [PubMed] [Google Scholar]
- 31.Longman R. S., Braun D., Pellegrini S., Rice C., Darnell R., Albert M. L. Dendritic cell maturation alters intracellular signaling networks, enabling differential effects of IFNα/β on antigen cross-presentation. Blood. 2006;109:1113–1122. doi: 10.1182/blood-2006-05-023465. [DOI] [PubMed] [Google Scholar]
- 32.Li X., Leung S., Kerr I. M., Stark G. R. Functional subdomains of STAT2 required for preassociation with the α interferon receptor and for signaling. Mol. Cell. Biol. 1997;17:2048–2056. doi: 10.1128/mcb.17.4.2048. [DOI] [PMC free article] [PubMed] [Google Scholar]
- 33.Abramovich C., Shulman L. M., Ratovitski E., Harroch S., Tovey M., Eid P., Revel M. Differential tyrosine phosphorylation of the IFNAR chain of the type I interferon receptor and of an associated surface protein in response to IFN-α and IFN-β. EMBO J. 1994;13:5871–5877. doi: 10.1002/j.1460-2075.1994.tb06932.x. [DOI] [PMC free article] [PubMed] [Google Scholar]
- 34.Croze E., Russell-Harde D., Wagner T. C., Pu H., Pfeffer L. M., Perez H. D. The human type I interferon receptor: identification of the interferon β-specific receptor-associated phosphoprotein. J. Biol. Chem. 1996;271:33165–33168. doi: 10.1074/jbc.271.52.33165. [DOI] [PubMed] [Google Scholar]
- 35.Platanias L. C., Uddin S., Domanski P., Colamonici O. R. Differences in interferon α and β signaling: interferon β selectively induces the interaction of the α and βL subunits of the type I interferon receptor. J. Biol. Chem. 1996;271:23630–23633. doi: 10.1074/jbc.271.39.23630. [DOI] [PubMed] [Google Scholar]
- 36.Runkel L., Pfeffer L., Lewerenz M., Monneron D., Yang C. H., Murti A., Pellegrini S., Goelz S., Uzé G., Mogensen K. Differences in activity between α and β type I interferons explored by mutational analysis. J. Biol. Chem. 1998;273:8003–8008. doi: 10.1074/jbc.273.14.8003. [DOI] [PubMed] [Google Scholar]
- 37.Russell-Harde D., Wagner T. C., Perez H. D., Croze E. Formation of a uniquely stable type I interferon receptor complex by interferon β is dependent upon particular interactions between interferon β and its receptor and independent of tyrosine phosphorylation. Biochem. Biophys. Res. Commun. 1999;255:539–544. doi: 10.1006/bbrc.1998.0105. [DOI] [PubMed] [Google Scholar]
- 38.French A. R., Tadaki D. K., Niyogi S. K., Lauffenburger D. A. Intracellular trafficking of epidermal growth factor family ligands is directly influenced by the pH sensitivity of the receptor/ligand interaction. J. Biol. Chem. 1995;270:4334–4340. doi: 10.1074/jbc.270.9.4334. [DOI] [PubMed] [Google Scholar]
- 39.Waterman H., Sabanai I., Geiger B., Yarden Y. Alternative intracellular routing of ErbB receptors may determine signaling potency. J. Biol. Chem. 1998;273:13819–13827. doi: 10.1074/jbc.273.22.13819. [DOI] [PubMed] [Google Scholar]
- 40.Levkowitz G., Waterman H., Zamir E., Kam Z., Oved S., Langdon W. Y., Beguinot L., Geiger B., Yarden Y. c-Cbl/Sli-1 regulates endocytic sorting and ubiquitination of the epidermal growth factor receptor. Genes Dev. 1998;12:3663–3674. doi: 10.1101/gad.12.23.3663. [DOI] [PMC free article] [PubMed] [Google Scholar]
- 41.Teis D., Huber L. A. The odd couple: signal transduction and endocytosis. Cell. Mol. Life Sci. 2003;60:2020–2033. doi: 10.1007/s00018-003-3010-2. [DOI] [PMC free article] [PubMed] [Google Scholar]
- 42.Di Guglielmo G. M., Le Roy C., Goodfellow A. F., Wrana J. L. Distinct endocytic pathways regulate TGF-β receptor signalling and turnover. Nat. Cell. Biol. 2003;5:410–421. doi: 10.1038/ncb975. [DOI] [PubMed] [Google Scholar]
- 43.Takaoka A., Mitani Y., Suemori H., Sato M., Yokochi T., Noguchi S., Tanaka N., Taniguchi T. Cross talk between interferon-γ and -α/β signaling components in caveolar membrane domains. Science. 2000;288:2357–2360. doi: 10.1126/science.288.5475.2357. [DOI] [PubMed] [Google Scholar]
- 44.Marchetti M., Monier M. N., Fradagrada A., Mitchell K., Baychelier F., Eid P., Johannes L., Lamaze C. Stat-mediated signaling induced by type I and type II interferons (IFNs) is differentially controlled through lipid microdomain association and clathrin-dependent endocytosis of IFN receptors. Mol. Biol. Cell. 2006;17:2896–2909. doi: 10.1091/mbc.E06-01-0076. [DOI] [PMC free article] [PubMed] [Google Scholar]


