

Abstract
The diaspora of the modern cat was traced with microsatellite markers from the presumed site of domestication to distant regions of the world. Genetic data were derived from over 1100 individuals, representing seventeen random bred populations from five continents and twenty-two breeds. The Mediterranean was reconfirmed to be the probable site of domestication. Genetic diversity has remained broad throughout the world, with distinct genetic clustering in the Mediterranean basin, Europe/America, Asia and Africa. However, Asian cats appeared to have separated early and expanded in relative isolation. Most breeds were derived from indigenous cats of their purported regions of origin. However, the Persian and Japanese Bobtail were more aligned with European/American than Mediterranean basin or Asian clusters. Three recently derived breeds were not distinct from their parental breeds of origin. Pure breeding was associated with a loss of genetic diversity, however, this loss did not correlate with breed popularity or age.
Keywords: Breeds, Cat, Diversity, Domestication, Genetic, Felis, Origins, Phylogeography, Phylogenetics, Structure
Introduction
The domestic cat (Felis catus, Linneas 1758) is prolific and cosmopolitan, occupying most habitable corners of the world. Archeological evidence suggests the domestication of the cat occurred in the Near East approximately 9,000 - 10,000 years ago [1]. However, the initiation of domestication probably began thousands of years earlier as humans and ancestral cats became progressively more interdependent [2]. The domestication process likely began during the period when humans ceased following wild herds of animals and adopted more agricultural lifestyles, particularly in the Fertile Crescent [3]. This change occurred 10,000-11,000 years ago, and was made possible by the domestication of certain wild grains and grasses [4]. The human/cat relationship was beneficial for the control of crop-destroying rodents, which had also joined their evolutionary fate to human civilization. Although many cats eventually became pets, the modern cat is not fully domesticated in the classic sense. Modern cats remain self-sufficient if need be, maintaining keen hunting skills even when provided food, and exhibiting a spectrum of behaviors ranging from untamable to highly affectionate pets [5; 6].
Cats spread to virtually all parts of the Old World, probably along trade routes between ancient civilizations. In spite of their rapid spread, cats have remained amazingly similar to their wild felid ancestors (Felis silvestris subspp.) in form and function [2; 6]. The progenitor species of domestic cats remained compatible with human agriculture. Gene flow between feral and tame modern cats, and between modern cats and their wild subspecies [7-10], has not negatively impacted the role of cats as the principle small carnivore in human dominated ecosystems. In fact, having a feral pool of modern cats surrounding the periphery of villages and farms may have been advantageous for the control of pests and associated zoonotic diseases. Therefore, the impetus to change cats to suit certain human needs was much less than for the other domesticated species and breed development for cats lagged considerably. Although reasons to change the basic form and function of the cat were not as compelling as for other species, nonetheless, certain types of cats were artificially selected in various regions of the world. Interestingly, this “breed selection” was often based on aesthetics and involved simple traits of coat color, color patterns, etc., and less noticeably form or function. Cats did not lend themselves to become herders, workers of the hunt or guardians, but their grace and beauty have always been obvious.
The small subset of domestic cats that have undergone intensive artificial selection is the pedigreed (purebred) cats, which were bred to maintain or alter purely aesthetic traits. Of the 41 breeds recognized by the Cat Fanciers' Association (CFA) [11], sixteen “natural breeds” are thought to be regional variants that predate the cat fancy [12]. The remaining breeds were developed over the last 50 years and are usually defined as simple, single-gene variants derived from the natural breeds. This is in stark contrast to most other domesticated species that have undergone millennia of intense selection for complex behavioral, performance or production traits involving complex gene interactions [13].
A recent phylogenetic study concludes that the domestic cat is the product of a single domestication event in the Near East [14]; however, dispersal patterns of the cat since that initial domestication event have not yet been studied. The objectives of the present paper are three-fold. The first is to trace the journey of the modern cat through the ancient world and to the Americas, thereby supporting origins of domestication. The second objective is to measure any changes in genetic diversity that may have occurred during the movement of cats from the Fertile Crescent. The third objective is to measure any loss of genetic diversity that might be ascribed to the development of older (foundation) or more contemporary breeds. Genetic data, reported herein, are derived from over 1100 cats, representing seventeen populations of random bred cats dispersed over five continents (Europe, Mediterranean, Asia, Africa, Americas), as well as 22 recognized breeds, including both foundation and several modern breeds (Table 1). Highly polymorphic microsatellite markers [15] were used to determine genetic relationships of cat breeds, geographical origins, and the levels of genetic loss due to inbreeding.
Table 1.
Genetic variation of cat breeds, random bred populations and wildcats.
| Population | N | FIS | HO | HE | Aver. Allelic Richness |
Aver. No. Alleles/locus |
Alleles/locus Range |
|---|---|---|---|---|---|---|---|
| Abyssinian | 40 | c | 0.45 | 0.52 | 2.44 | 4.29 | 2 - 7 |
| American Shorthair | 13 | 0.09 | 0.57 | 0.63 | 2.90 | 4.59 | 2 - 7 |
| Birman | 28 | 0.10 | 0.43 | 0.48 | 2.31 | 3.82 | 1 - 6 |
| British Shorthair | 28 | 0.11 | 0.56 | 0.63 | 2.96 | 5.82 | 2 - 9 |
| Burmese | 25 | 0.22 | 0.40 | 0.51 | 2.51 | 4.44 | 1 - 9 |
| Chartreux | 30 | 0.08 | 0.57 | 0.61 | 2.81 | 4.62 | 1 - 8 |
| Egyptian Mau | 19 | 0.23 | 0.49 | 0.63 | 2.86 | 4.56 | 2 - 7 |
| Exotic Shorthair | 40 | 0.12 | 0.55 | 0.63 | 2.96 | 5.91 | 2 - 10 |
| Havana Brown | 11 | 0.13 | 0.41 | 0.46 | 2.28 | 3.03 | 1 - 6 |
| Japanese Bobtail | 32 | 0.12 | 0.60 | 0.67 | 3.14 | 5.97 | 3 - 12 |
| Korat | 39 | 0.02 | 0.56 | 0.57 | 2.62 | 4.44 | 1 - 8 |
| Maine Coon | 31 | 0.13 | 0.58 | 0.66 | 3.08 | 6.00 | 2 - 11 |
| Norwegian Forest | 10 | 0.13 | 0.61 | 0.70 | 3.29 | 4.82 | 2 - 11 |
| Persian | 33 | 0.19 | 0.51 | 0.62 | 2.90 | 5.68 | 3 - 9 |
| Russian Blue | 25 | 0.09 | 0.46 | 0.50 | 2.40 | 3.79 | 2 - 6 |
| Siamese | 32 | 0.10 | 0.47 | 0.52 | 2.47 | 4.06 | 1 - 8 |
| Siberian | 19 | 0.05 | 0.69 | 0.73 | 3.45 | 6.65 | 3 - 12 |
| Singapura | 24 | 0.12 | 0.34 | 0.38 | 1.98 | 2.82 | 1 - 5 |
| Sokoke | 14 | 0.07 | 0.41 | 0.44 | 2.14 | 2.82 | 1 - 6 |
| Sphynx | 27 | 0.10 | 0.58 | 0.64 | 3.00 | 5.59 | 1 - 9 |
| Turkish Angora | 14 | 0.15 | 0.56 | 0.66 | 3.08 | 5.21 | 2 - 10 |
| Turkish Van | 21 | 0.18 | 0.49 | 0.59 | 2.71 | 4.62 | 1 - 8 |
| Breed Average | 25 | 0.12 | 0.51 | 0.58 | 2.74 | 4.71 | -- |
| Total/Range | 555 | 0.02-0.23 | 0.34-0.69 | 0.38-0.73 | 1.98-3.45 | 2.82-6.65 | 1 - 12 |
| Brazil | 26 | 0.08 | 0.66 | 0.71 | 3.40 | 6.82 | 2 - 13 |
| Hawaii | 54 | 0.10 | 0.63 | 0.69 | 3.32 | 7.87 | 3 - 13 |
| New York | 35 | 0.12 | 0.62 | 0.69 | 3.36 | 7.60 | 3 - 14 |
| Texas | 30 | 0.10 | 0.66 | 0.72 | 3.50 | 7.18 | 3 - 12 |
| Germany | 45 | 0.14 | 0.62 | 0.70 | 3.41 | 8.39 | 2 - 15 |
| Finland | 32 | 0.08 | 0.61 | 0.65 | 3.22 | 7.00 | 2 - 13 |
| Italy | 47 | 0.1 | 0.67 | 0.72 | 3.56 | 7.8 | 3 -14 |
| Turkey | 70 | 0.11 | 0.68 | 0.76 | 3.70 | 10.39 | 6 - 18 |
| Israel | 47 | 0.10 | 0.70 | 0.76 | 3.71 | 8.97 | 5 - 16 |
| Egypt | 27 | 0.11 | 0.68 | 0.74 | 3.67 | 8.26 | 4 - 17 |
| Tunisia | 17 | 0.04 | 0.68 | 0.69 | 3.38 | 6.45 | 2 - 12 |
| Kenya | 33 | 0.13 | 0.59 | 0.65 | 3.17 | 5.46 | 2 - 11 |
| Sri Lanka | 24 | 0.07 | 0.70 | 0.74 | 3.56 | 7.26 | 3 - 14 |
| Singapore | 29 | 0.10 | 0.65 | 0.71 | 3.47 | 7.68 | 3 - 14 |
| Vietnam | 20 | 0.08 | 0.63 | 0.66 | 3.27 | 6.42 | 2 - 12 |
| Henan (China) | 20 | 0.05 | 0.63 | 0.64 | 3.16 | 6.32 | 3 - 12 |
| Korea | 40 | 0.06 | 0.62 | 0.65 | 3.16 | 7.37 | 3 - 16 |
| Random bred Aver. | 35 | 0.09 | 0.65 | 0.70 | 3.41 | 7.48 | |
| Total/Range | 596 | 0.04-0.14 | 0.59-0.70 | 0.64-0.76 | 3.16-3.71 | 5.46-10.39 | 2 - 18 |
| F. s. caffra | 10 | 0.30 | 0.57 | 0.76 | 3.98 | 6.55 | 2 - 10 |
| F. s. tristami | 5 | 0.11 | 0.60 | 0.49 | 2.41 | 2.60 | 1 - 4 |
| F. s. silvestris | 10 | 0.47 | 0.43 | 0.71 | 3.70 | 5.24 | 3 - 11 |
| Wildcat Aver. | 8 | 0.29 | 0.53 | 0.65 | 3.36 | 4.80 | |
| Total/Range | 25 | 0.11-0.49 | 0.43-0.60 | 0.49-0.76 | 2.41-3.98 | 2.60-6.55 | 1 - 11 |
N, sample size; FIS, average inbreeding coefficient of an individual relative to its subpopulation; HO, observed heterozygosity; HE, expected heterozygosity; Aver. Allelic Richness, expected number of alleles in a sample of three diploid individuals, averaged over all loci.
Results
Phylogeographical structure of domestic cats
A Bayesian analysis of random bred cat populations using the software Structure [16] elucidated the phylogeography of the domestic cat. The clustering patterns were examined with ancestral groups (K) set between two and four. The first split (K=2) separated Asian and East African cats from all other populations (Fig. 1A). The Mediterranean basin populations were separated from the European populations at K=3. East African cats formed a separate and distinct cluster at K=4. The result of the K=4 analysis clearly delineated four genetic clusters of cats, corresponding to Europe, the Mediterranean basin, East Africa and Asia.
Fig. 1. Bayesian analysis of cat breeds and populations.
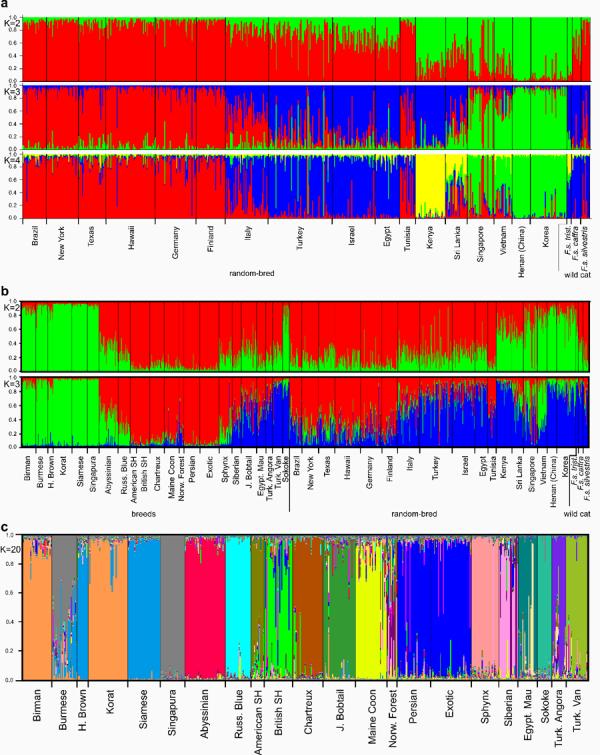
The colors correspond to predicted genetic clusters; Western Europe (red), Mediterranean basin (blue), Asia/Southeast Asia (green), and East Africa (yellow). Each column represents an individual cat. The Y-axis represents the proportion of interactions that an individual is assigned to the given cluster. a, The first three basal separations of random bred cats and wildcats. b, (Top) The first basal separation of all populations (K=2). Asian breeds, the Sokoke, and Asian random bred populations (green) are clearly distinguished from all other cats. (Bottom) Analysis of all populations (K=3). African/Mediterranean/Asian cats (red) separate from Southeast Asian (green) and European (blue) populations. c, Twenty-two cat breeds (K=20). Havana Browns and Siamese, and Persians and Exotics, Burmese and Singapura are not genetically differentiated. Burmese appear to share origins with Siamese and Korat. Korats and Birmans also appear to be strongly related. Persians and Siberians show within breed heterogeneity.
We next included cat breeds in the Bayesian analyses to determine the most basal relationships among all cat breeds and all random bred cat populations. At K=2, four of five Asian random bred cat populations grouped with six of seven Asian breeds with posterior probabilities of 75 – 85%; this grouping of ten populations was also distinct from all other cat populations (Fig. 1B). At K=3, the groupings were refined into a Southeast Asian cluster, a Western European cluster, and a cluster that included all other cats from the Mediterranean basin, East Africa and Northern Asia. Cats from Singapore were an admixture of cats of Asian and European origins. American random bred cats grouped with random bred cats from Western Europe. Italian cats appeared to be an admixture of European and Mediterranean stock. Southeast Asian breeds clustered with the feral populations from Vietnam. Of the Asian breeds, only the Japanese Bobtail grouped strongly with Western cats, albeit with some Asian influence. The two breeds that originated in the USA (Maine Coon and American Shorthair) clustered with the seven Western European breeds. The Persian breed unexpectedly clustered with cats from Western Europe. The Sokoke, an indigenous African breed, was closely related to random bred cats from Kenya.
We constructed neighbor-joining trees to provide additional confirmation of the genetic structure, as well as an alternative way to represent the phylogeographical patterns. Both Cavalli-Sforza's chord measure [17] and Nei's genetic distance [18] gave similar results. The tree produced by chord measure (Fig. 2) had stronger support, as indicated by bootstrap values greater than 50%, and differentiated the Asian cluster from all other cats. In addition, East African, Mediterranean, and European clusters each formed monophyletic clades. This phylogeographical structure was also supported by Factorial Correspondence Analysis (FCA) (Fig. 3 and fig. S1). Cats from the rim of the Arabian Sea, Abyssinian and Sri Lanka, bridged the European and Asian groups. While Asian populations were highly dispersed, the Western European cats formed a tight cluster.
Fig. 2. Neighbor-joining tree of cat breeds and populations.
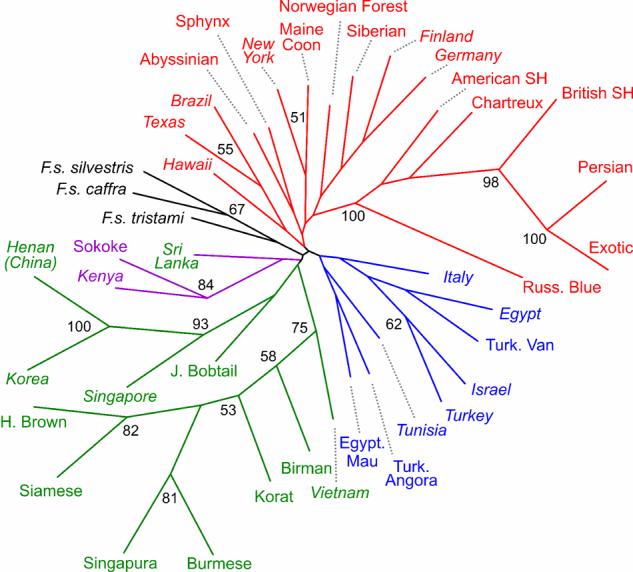
The phylogenetic tree was constructed using Cavalli-Sforza's chord distance. Bootstrap values above 50% are presented on relationship nodes. Asian (green), Western European (red), East African (purple), Mediterranean basin (blue) and wildcat (black) populations form strongly supported monophyletic branches. European and African wildcats are closely related whereas short branches of most all other populations indicate close relationships of these breeds and populations. Random bred populations are indicated in italics, breeds are in standard font.
Fig. 3. Factorial Correspondence Analysis of cat breeds and populations.
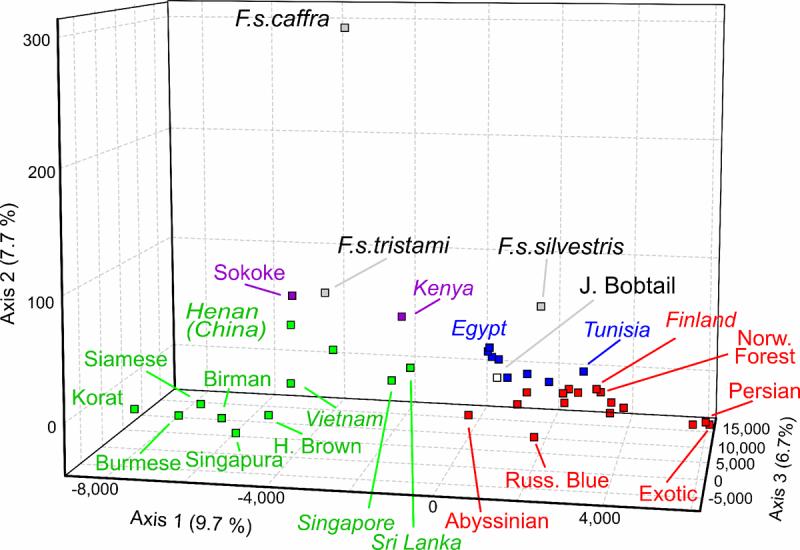
Squares represent population centers of the following geographic regions: Asian populations (green), Western European (red), Mediterranean basin (blue), East African (purple), and wildcat (black). The affinities of the Sokokes to the Asian populations, the Japanese Bobtails to the Mediterranean and European cats, and the Tunisian cats to the European populations, are apparent and are in agreement with the Structure results. Arabian wildcats (F. s. tristami) associate with East African populations, European (F. s. silvestris) with European populations, and African (F. s. caffra) appear most distinct from all other groups. See Supplementary Figure 1 for alternate views.
Genetic diversity within the domestic cat
Genetic differentiation was determined by AMOVA [19] for cat populations from Europe (including the Americas), East Africa, the Mediterranean and East Asia (table S1). The American samples were included with the European populations, as no domestic cats were indigenous to the Americas. The greatest genetic diversity was found in cats from the Mediterranean (500 alleles across all markers). Asian cats had substantially fewer alleles (418 across all markers). The Mediterranean cats also had 41 private alleles, as compared to 14 private alleles among Asian cats (table S2).
Genetic structure of cat breeds
Bayesian clustering was used to examine the genetic relationships among breeds. A range of cluster numbers was examined, with 20 chosen as the most appropriate. This method separated the cats into inferred clusters corresponding to their breed designation (Fig. 1C) and with a purported accuracy of 95% [20]. Cats from fourteen breeds were assigned to distinct clusters by this statistical analysis. The separation of eight breeds, four pairs, was not consistent. Singapura and Burmese, Havana Brown and Siamese, Korat and Birman, and Exotic Shorthair and Persian could not be distinguished as distinct breeds. However, these four breed pairs could be unequivocally differentiated when analyzed independently of other breeds (data not shown). Two geographically related breeds, the Turkish Angora and the Turkish Van, were distinct from each other. Five breeds (British Shorthair, Exotic Shorthair, Norwegian Forest Cat, Persian, and Siberian) showed subdivisions within each breed, indicating multiple lineages.
Changes in genetic diversity with pure breeding
Cat breeds had less overall genetic diversity than random bred cats, as evidenced by the relatively low within population variance component (Table 2). The average heterozygosity for random bred and purebred animals was 0.65 ± 0.03 and 0.51 ± 0.09, respectively (Fig. 4). Breeds such as the Burmese, Havana Brown, Singapura, and Sokoke had the lowest heterozygosity values while Siberians had the highest among the breeds, which was comparable to random bred cats. Average number of alleles per locus, average inbreeding coefficient (FIS) and allelic richness followed a similar trend (Table 1, Fig. 4).
Table 2.
AMOVA analysis of cat breeds and random bred populations.
| Sample | Variance components (%) |
||
|---|---|---|---|
| Within populations |
Among populations within regions |
Among regions |
|
| Breeds | 61 | 24 | 15 |
| Random bred | 86 | 6 | 8 |
| Combined | 73 | 18 | 9 |
Fig. 4. Genetic diversity indices of breeds, random bred populations and wildcats.

Light bars represent observed heterozygosity (HO) and dark bars represent the inbreeding coefficient (FIS). Populations listed in ascending order of heterozygosity, breeds are on the left, random bred populations in the middle, and wildcat populations to the right. Y-axis represents the proportion of heterozygosity or inbreeding coefficient.
Discussion
Genetics of the feline diaspora
Recently, strong evidence has suggested that cat domestication occurred in the Near Eastern part of the Fertile Crescent pursuant to agricultural development [14]. The Mediterranean basin has been previously suggested as the site for cat domestication based on archeological evidence [1; 21]. Driscoll and colleagues (2007) used mitochondrial sequence and microsatellites markers to elucidate the origin of cat domestication. Because microsatellite markers are a better indicator of more recent genetic diversity, this study focused on microsatellite markers to evaluate the more recent breed origins. Based on the present study, genetic diversity was not substantially decreased by the subsequent diaspora of modern cats from the Mediterranean to other areas of the ancient world. However, there were interesting regional differences in their genetic makeup. FCA, Bayesian clustering and neighbor-joining phylogenetic trees divided all of the world's cats into four distinct groups; Asia, Mediterranean basin, Western Europe and East Africa. American cats consistently grouped with cats from Western Europe, suggesting European settlers probably brought cats to the New World and the cats' time in America has been too brief for significant genetic differentiation.
Genetic diversity remained fairly uniform among various areas within the Mediterranean region. The constant movement of ships and caravans, as well as cats, in this key region of early civilization would have promoted a constant interchange of cats. Although Mediterranean cats tended to be genetically uniform, there were some interesting differences and relationships between certain areas within the Mediterranean region. Bayesian analysis indicated that Italian and Tunisian cats were an admixture of Western European and Mediterranean cats. This mixing supported the historical ties between Tunisia and Western European countries. Cats from Sri Lanka and Singapore were an admixture of cats from Southeast Asia, Europe and everywhere else when defined with K = 3 (Fig. 1B). However, some Singapore cats did not appear to be hybrids, but rather a mixed sampling of genetically different cats. This may have been a relic of British colonialism or recent importation. According to the FCA analysis (Fig. 3), Sri Lankan cats and the Abyssinian breed bridged cats of the East and West, perhaps resulting from maritime trade routes in the Arabian Sea or again from recent British colonialism. The most interesting difference involved the Asian cluster of cats, which was genetically distinct from cats of the Mediterranean basin, Western Europe, and Africa. This pattern of genetic diversity indicates that the first domestic cats reached the Far East relatively early, followed by a long period of relative isolation. This isolation may have been caused by the waxing and waning of trade between successions of great ancient empires. The Asian population was of further interest because it was internally segregated. Populations of cats from different parts of Asia (random bred and purebred) were more genetically divergent from each other than local populations within the Mediterranean basin or Western European clusters. This partitioning of genetic diversity within the Asian population was also corroborated by the longer branch lengths within the Asian clade on the phylogenetic tree (Fig. 2). This suggests that not only was the Asian population relatively isolated from the three other regional clusters, but that cats within various regions of Asia were also kept separate.
Genetic variation across random bred and purebred populations
The sub-structuring of populations is important for parentage analyses, forensic applications, individual matching, and disease studies. Random bred cats have the largest within population variance, consistent with their larger population sizes, freedom to migrate, and no artificial selection. However, the various breeds of cats exhibit the largest among population variance, reflecting their distinctness. The within population variance component of random bred cats was 86%, compared to 93-95% in humans [22], suggesting that individual cat populations are less genetically variable than human populations. Purebred cats, with a within population variance component of only 61%, were less genetically variable than the random bred populations, which was also reflected in the estimates of average heterozygosity. The average heterozygosity of the breeds was 10% lower than the random bred populations (Fig. 4), which in turn was 10% lower than the average for human populations. Worldwide human populations range from 0.50 to 0.78 in average heterozygosity, most being above 0.70. The among populations between regions variance of cat populations was approximately twice that seen in humans (6% in cats, 2.5% in humans) as was the among regions variance (8% in cats, 3.6-4.3% in humans). This increase suggests that cat populations are more genetically isolated due to geography than human populations. The large among populations (24%) and among regions (15%) variance of the breeds is likely a result of the intensive artificial selection and isolation imposed by breeding practices. The Burmese and Singapura breeds have the lowest heterozygosity and the highest FIS of any breed, reflecting the most intense inbreeding (Fig. 4). The newest CFA breed, the Siberian, had the highest variation, comparable to random bred populations. This indicated that it was derived from a broad foundation stock. The Sphynx, which is a derivative of the Devon Rex breed, also had high genetic diversity. Given these results, Burmese and Singapura breeders should be concerned about genetic diversity, while Siberian breeders should be encouraged to retain existing diversity as their breed becomes more established. Similar to the conservation efforts in captive exotic felid populations, genetic analyses, breed histories and population dynamics could be used to develop breed management or survival programs to maintain genetic variation within the breed gene pool for an extended period of time. In addition, these regional differences in the genetic variation of cats suggest that the genetic markers used in cat DNA profiling should be tested in the diverse populations to validate their efficiency.
Genetic structure and origins of cat breeds
We have demonstrated that genetic diversity following domestication was regionalized in areas of the ancient world, and even within localities within those regions. Some differences could be explained by isolation, while others were best explained by interchanges of animals between clusters and localities. All of these differences involved human activities, but were probably not strictly intentional. However, intentional changes in the genetics of cats ultimately occurred during the development of breeds.
Unlike breeds of domestic horses, dogs, cattle, sheep, etc., some of which are thousands of years old, most cat breeds were developed within the past 150 years, mainly in Europe and the United States [12]. Although documentation for nearly 80 cat breeds exists, the largest cat fancy association recognizes only 41 breeds [23; 24]. The Persian, Russian Blue, Siamese, and Angora were among the first cat breeds registered by cat associations. The Cat Fanciers' Association (CFA) designates sixteen cat breeds as “natural” or “foundation”. Fifteen of the foundation breeds are included in this study, lacking only the Manx, the tailless breed of cat that was developed on the Isle of Man.
Purebred cats had similar structuring to the random bred cats of their regions. The Southeast Asian breeds, including Birman, Burmese, Havana Brown, Korat, Siamese and Singapura, form a grouping that is distinct and at the opposite end of the genetic spectrum from the Western breeds, as depicted by the FCA. The Abyssinian and Japanese Bobtails were exceptions and possessed genetic markers common to both Southeast Asian and Western breeds. This indicates that cats from both Asia and Europe were used to create these breeds.
Each of the foundation breeds was genetically distinguishable with 95% accuracy from the others. One of the oldest recognized cat breeds, the Persian, has been used in the development of several other breeds. Cross breeding with Persian cats is often being used to produce a more brachycephalic head type. The Exotic Shorthair is essentially a shorthaired variant of a Persian, which is demonstrated by the complete clustering of these two breeds as one group. The most dolichocephalic breed, the Siamese, has also been used to create numerous other breeds, including Colorpoints, Orientals, Havana Browns, and longhaired breed variants. Although listed as different, most of these derived breeds vary only by a single gene variant, such as hair length, color patterns, and fur coloration; thus, these derived breeds will likely be inseparable as distinct breeds, as was shown with the Havana Brown and Siamese. The Burmese and Singapura grouping proved to be an additional example of recent breed derivations. The close associations of the Persian and Exotic, the Siamese and Havana Brown, and the Burmese and Singapura resulted in the highest branch supports in the neighbor-joining tree and the inability to separate members of each pair by the genetic markers used in this study. However, it is important to remember that most breeds have a written/oral history in addition to a genetic fingerprint. Cat breeding folklore contends that both Burmese and Singapura are indigenous to ancient Burma. Folklore also suggests that Burmese cats from the USA were taken to Singapore, purposely bred with native cats, and then, later returned to the USA as the new breed, the Singapura. Havana Browns are considered a separate breed in the USA; however, European cat breed associations consider them only a color variant of Siamese.
These data show that most, but not all, foundation or modern breeds appeared to have originated from random bred cats of the purported region of origin. The Southeast Asian breeds were strongly associated with the random bred cats from Vietnam, China, Korea, and Singapore. The Siberian is one of the newest cat breeds from Russia and is actively under development. Random bred cats from Russia were not available, but the Siberian had strong associations with cats from the nearby countries of Germany and Finland. Turkish Vans grouped with regional random bred cats from Turkey, Israel, and Egypt. Likewise, cats from the Kenyan islands of Lamu and Pate group with the Sokoke breed, which was developed in Kenya. The Kenyan islands and the mainland were accessed via shipping routes in the Arabian Sea, allowing exchange between India, the Near East, the Arabian Peninsula and Africa. All other breeds and random bred populations form a network of closely related and less distinctive cats of Western European grouping. Surprisingly, the Persian breed was not genetically associated with random bred cat populations from the Near East, but grouped with random bred cats of Western Europe. The Persian is perhaps the oldest recognized cat breed and has undergone selection for an extreme phenotype, which likely involved complex gene interaction. Even though the early Persian cat may have in fact originated from ancient Persia, the modern Persian cat has lost its phylogeographical signature. Similarly, the Japanese Bobtail does not appear to hail from its stated origins of Japan. Although cats were not indigenous to Japan, they migrated to the islands as part of Asian trade routes hundreds of years ago. Introduced as a breed in the USA in 1968, Japanese Bobtails from the USA appear to have been influenced more in their gene pool by European cats rather than by Asian cats. Egyptian Maus also appear to be on the verge of losing their historical origins via genetic influences from Europe. Overall, these results indicate that both the random bred and breed populations group in a manner largely concordant with geography. Breed histories, for the most part, appear to be accurate.
The present study reconfirmed that the Mediterranean was the likely site of domestication of the modern cat. Genetically distinguishable clusters of cats were found in the Mediterranean, Europe, Asia, and Africa. North American cats were closely linked to European cats. The Asian cluster was genetically unique, indicating that it became isolated following its introduction. Genetic diversity remained surprisingly broad among cats from various parts of the world. Genetic data demonstrated that most, but not all, foundation breeds originated from indigenous cats of the regions of purported origin and that this was associated with some loss of diversity. Researchers should recognize the relative recent development of the breeds, which influences linkage disequilibrium and the power of association studies. This study also provides a warning to modern cat fanciers that breed development must be done slowly and with the maintenance of a broad genetic base. Over 20 deleterious genetic disorders have been recognized in modern cats, and all have been identified in pure breeds. The elucidated genetic relationships of the cat breeds can be used by cat breeders to develop more efficient breed management plans.
Materials and Methods
Sample collection and DNA isolation
Our dataset consisted of 22 cat breeds, including fifteen of sixteen supposed foundation breeds, two breeds under development, Siberian and Sokoke, and five more recently developed breeds, including Exotic Shorthair, Havana Brown, Japanese Bobtail, Singapura, and Sphynx (Table 1). We obtained DNA samples of most breeds at cat shows and by request from cat owners in the USA. Korat, Turkish Angora, Turkish Van, and Siberian samples were acquired from the United States and Europe because these breeds have the same standards between continents. We reviewed pedigrees to ensure that no first-degree relatives were included in the study and that a majority of cats did not share common grandparents. The random bred cats included feral cats that have no feeding or housing assistance from humans, random bred cats that have some influence by humans, and cats owned and cared for by humans but are not of a specific breed. For random bred populations, we did not include littermates, or both parents and their kittens. We used sterile cytological brushes to non-invasively obtain buccal (cheek) cells and the QIAmp DNA mini kit (Qiagen Valencia, CA) to extract the DNA. Samples from Kenya and US random bred populations were provided as blood or tissue, and we extracted the DNA using standard phenol/chloroform [25]. African wildcat (Felis silvestris caffra) [10] and European wildcat (Felis silvestris silvestris) [26] DNA samples were provided from previous studies. The Arabian wildcats (Felis silvestris tristami) were collected in Israel. We used the Replig-G kit (Qiagen Valencia, CA) to augment in part the wildcat DNA samples by multi-strand-displacement whole genome amplification.
Genotyping
Thirty-eight microsatellites were genotyped in 1176 cats representing 22 breeds and 20 random bred populations (Table 1). On average, each random bred and purebred population was represented by 35 and 25 cats, respectively, ranging from 10 to 70 for the domestic cats. For wildcat populations five to ten samples were genotyped. The microsatellite markers were chosen based on the criteria of high heterozygosity, high polymorphism information content (PIC) and wide chromosomal distribution of at least 100 cM from the closest neighbor [27]. The primer sequence of marker FCA80 contained mismatches when compared to publicly available sequence and was substituted with an updated version, FCA80B, which interrogates the same microsatellite (forward: 5'- AGCAAAGAGGTGAAGCAAGA, reverse: 5'- TTCCCTCCTCCGTGTATGTA). Genotyping PCR was carried out on MJ gradient thermal cyclers (Bio Rad, Hercules, CA) with Taq polymerase and buffer supplied by ABgene (Rochester, NY). Ten to 25ng DNA were analyzed in a reaction mix consisting of 1X PCR buffer, 0.01% BSA, 0.25 M Betaine, 2.0 mM MgCl2, 0.25 units Taq, 200 μM dNTPs, and 0.02 μM of each primer. Forward primers were fluorescently labeled with 6-FAM, NED, PET or VIC dyes (Applied Biosystems, Foster City, CA). Microsatellites were multiplexed into groups of four to five markers during PCR. The thermal cycling program was carried out as follows: 5 min 95 °C initial denaturation, 35 cycles of 1 min at 95 °C, 1 min at 58 °C, 1 min at 72 °C, followed by a 30 min final extension at 72 °C. We employed an ABI 3730 DNA (Applied Biosystems) Analyzer to perform the fragment separation and we visualized the results using STRand [28].
Population structure analyses
The structure of all sampled populations was determined by factorial correspondence analysis (FCA) (Genetix 4.05) [29] and by Bayesian clustering (Structure) [16]. The multidimensional FCA was performed under default settings. In each Bayesian clustering analysis, 1,000,000 iterations were carried out after a 10,000 iteration burn-in under the admixture model. The entire dataset including the breeds, random bred and wildcats was analyzed to obtain basal relationships for K=2 and K=3. Analyses of only random bred populations (K=2 to K=4) were performed to clarify phylogeographical relationships. Ten runs each at K=16 to K=26 were performed on the breed dataset. The estimated log-probability of the data for a given value of K in the range of interest displayed a flat trend (data not shown). This suggests that Structure was unable to determine which number of inferred ancestral populations in the biologically significant range (those surrounding 22) was the most probable. We therefore chose K=20 as the best fit because, at that value, the genetic clusters formed by the analysis most closely corresponded to supposed breeds. Assignment testing was performed using the Bayesian methods of Rannala and Mountain [30], as implemented by GeneClass2 [20].
Tree building
Phylogenetic trees were constructed with the entire dataset (PHYLIP) [31]. A series of components was employed in the following order: Seqboot, Genedist, Neighbor and Consense. We used Genedist to produce both Nei's genetic distance and Cavalli-Sforza's chord measure outfiles so that two different trees were produced under these two distance measures. In each case, the trees were bootstrapped with 1000 iterations to assess confidence. We used TreeView [32] to visualize the resulting trees.
AMOVA
To quantify the degree of regional differentiation, we performed an Analysis of Molecular Variance (AMOVA) [19] in three parts: breeds only, random bred populations only and the combined dataset, which did not include wildcats (Arlequin) [33]. The populations were divided into four groups corresponding to their geographical origins as shown in Supplementary Table 3. The a priori geographical origins of Abyssinians and the Sri Lankan cats, as well as their placement in the FCA and Structure analyses were unclear, thus, they were not included in the AMOVA analyses.
Population parameters
We calculated population-based allele numbers, ranges and observed and expected heterozygosities (Ho and HE, respectively) using GenAlEx [34]. We used Arlequin to calculate FIS. Allelic richness, a measure of allele number standardized for sample size, was also calculated using Fstat [35]. Locus-specific parameters are presented in Supplementary Table 2.
Supplementary Material
Acknowledgments
Leslie Lyons (University of California, Davis) was supported by funding from NIH-NCRR RR016094, the Winn Feline Foundation and the George and Phyllis Miller Feline Health Fund, Center for Companion Animal Health, and the Koret Center for Veterinary Genetics, School of Veterinary Medicine, University of California, Davis. We appreciate the provision of samples by; Betsy Arnold (Caring for Cats Veterinary Practice), Eric Harley (University of Cape Town), Amanda Payne-Del Vega (University of California, Davis), Hugo Escobar (Hannover School of Veterinary Medicine), Erasmus Dzila Kalu (Lamu Cat Clinic), Hans Lutz (University of Zurich), Eranda Rajapaksha (University of California, Davis), Kyu-Woan Cho (Gyeongsang National University), Ki Jin Ko, Norma Labarthe (Universidade Federal Fluminense), Jack Couffer, Gloria Lauris (Egyptian Mau Rescue Organization) and the many cat breeders, including members of The Cat Fanciers' Association (CFA), the Rome Cat Sanctuary, the Singapore Cat Club, and The International Cat Association (TICA). We appreciate additional technical support by the Lyons laboratory from Leslie Bach, Carolyn Erdman, Jennifer Grahn, Robert Grahn, Jennifer Kurushima, Jennifer Lee, Mark Ruhe, and Anna Stambolia-Kovach, comments on the manuscript by Mark Grote (University of California, Davis) and the use of the instrumentation at the Veterinary Genetics Laboratory, University of California, Davis.
Footnotes
Publisher's Disclaimer: This is a PDF file of an unedited manuscript that has been accepted for publication. As a service to our customers we are providing this early version of the manuscript. The manuscript will undergo copyediting, typesetting, and review of the resulting proof before it is published in its final citable form. Please note that during the production process errors may be discovered which could affect the content, and all legal disclaimers that apply to the journal pertain.
References
- 1.Vigne JD, Guilaine J, Debue K, Haye L, Gerard P. Early taming of the cat in Cyprus. Science. 2004;304:259. doi: 10.1126/science.1095335. [DOI] [PubMed] [Google Scholar]
- 2.Dobney K, Larson G. Genetics and animal domestication: new windows on an elusive process. Journal of Zoology. 2006;269:261–271. [Google Scholar]
- 3.Gupta AK. Origin of agriculture and domestication of plants and animals linked to early Holocene climate amelioration. Current Science. 2004;87:54–59. [Google Scholar]
- 4.Zohary D, Hopf M. Domestication of Plants in the Old World. Oxford University Press; Oxford: 2000. [Google Scholar]
- 5.Bradshaw JWS, Horsfield GF, Allen JA, Robinson IH. Feral cats: their role in the population dynamics of Felis catus. Applied Animal Behaviour Science. 1999;65:273–283. [Google Scholar]
- 6.Clutton-Brock J. A natural history of domesticated mammals. Cambridge University Press; New York: 1999. [Google Scholar]
- 7.Beaumont M, et al. Genetic diversity and introgression in the Scottish wildcat. Mol Ecol. 2001;10:319–36. doi: 10.1046/j.1365-294x.2001.01196.x. [DOI] [PubMed] [Google Scholar]
- 8.Pierpaoli M, et al. Genetic distinction of wildcat (Felis silvestris) populations in Europe, and hybridization with domestic cats in Hungary. Mol Ecol. 2003;12:2585–98. doi: 10.1046/j.1365-294x.2003.01939.x. [DOI] [PubMed] [Google Scholar]
- 9.Randi E, Pierpaoli M, Beaumont M, Ragni B, Sforzi A. Genetic identification of wild and domestic cats (Felis silvestris) and their hybrids using Bayesian clustering methods. Mol Biol Evol. 2001;18:1679–93. doi: 10.1093/oxfordjournals.molbev.a003956. [DOI] [PubMed] [Google Scholar]
- 10.Wiseman R, O'Ryan C, Harley EH. Microsatellite analysis reveals that domestic cat (Felis catus) and southern African wild cat (F. lybica) are genetically distinct. Animal Conservation. 2000;3:221–228. [Google Scholar]
- 11.CFA . The Cat Fanciers' Association Cat Encyclopedia. Simon & Schuster; New York: 1993. [Google Scholar]
- 12.Wastlhuber J. In: History of domestic cats and cat breeds. Pedersen NC, editor. Feline Husbandry, American Veterinary Publications, Inc.; Goleta, CA, USA: 1991. pp. 1–59. [Google Scholar]
- 13.Parker HG, et al. Genetic structure of the purebred domestic dog. Science. 2004;304:1160–4. doi: 10.1126/science.1097406. [DOI] [PubMed] [Google Scholar]
- 14.Driscoll CA, et al. The Near Eastern origin of cat domestication. Science. 2007;317:519–23. doi: 10.1126/science.1139518. [DOI] [PMC free article] [PubMed] [Google Scholar]
- 15.Menotti-Raymond M, et al. A genetic linkage map of microsatellites in the domestic cat (Felis catus) Genomics. 1999;57:9–23. doi: 10.1006/geno.1999.5743. [DOI] [PubMed] [Google Scholar]
- 16.Pritchard JK, Stephens M, Donnelly P. Inference of population structure using multilocus genotype data. Genetics. 2000;155:945–59. doi: 10.1093/genetics/155.2.945. [DOI] [PMC free article] [PubMed] [Google Scholar]
- 17.Cavalli-Sforza LL, Edwards AW. Phylogenetic analysis. Models and estimation procedures. Am J Hum Genet. 1967;19(Suppl 19):233+. [PMC free article] [PubMed] [Google Scholar]
- 18.Nei M, Feldman MW. Identity of genes by descent within and between populations under mutation and migration pressures. Theor Popul Biol. 1972;3:460–5. doi: 10.1016/0040-5809(72)90017-2. [DOI] [PubMed] [Google Scholar]
- 19.Excoffier L, Smouse PE, Quattro JM. Analysis of molecular variance inferred from metric distances among DNA haplotypes: application to human mitochondrial DNA restriction data. Genetics. 1992;131:479–91. doi: 10.1093/genetics/131.2.479. [DOI] [PMC free article] [PubMed] [Google Scholar]
- 20.Piry S, et al. GENECLASS2: a software for genetic assignment and first-generation migrant detection. J Hered. 2004;95:536–9. doi: 10.1093/jhered/esh074. [DOI] [PubMed] [Google Scholar]
- 21.Malek J. The cat in Ancient Egypt. University of Pennsylvania; Philadelphia: 1993. [Google Scholar]
- 22.Rosenberg NA, et al. Genetic structure of human populations. Science. 2002;298:2381–5. doi: 10.1126/science.1078311. [DOI] [PubMed] [Google Scholar]
- 23.Morris D. Cat breeds of the world. Penguin Books; New York: 1999. [Google Scholar]
- 24.Morris D. Cat Breeds of the World: A Complete Illustrated Encyclopedia. Viking Penquin; New York: 1999. [Google Scholar]
- 25.Sambrook J, Russel DW. Preparation and analysis of eukaryotic genomic DNA, Molecular Cloning: A Laboratory Manual. Cold Spring Harbor Laboratory Press; New York: 2001. [Google Scholar]
- 26.Leutenegger CM, et al. Viral infections in free-living populations of the European wildcat. J Wildl Dis. 1999;35:678–86. doi: 10.7589/0090-3558-35.4.678. [DOI] [PubMed] [Google Scholar]
- 27.Menotti-Raymond M, et al. Second-generation integrated genetic linkage/radiation hybrid maps of the domestic cat (Felis catus) J Hered. 2003;94:95–106. doi: 10.1093/jhered/esg008. [DOI] [PubMed] [Google Scholar]
- 28.Toonen RJ, Hughes S. Increased throughput for fragment analysis on an ABI PRISM 377 automated sequencer using a membrane comb and STRand software. Biotechniques. 2001;31:1320–4. [PubMed] [Google Scholar]
- 29.Belkhir K, Borsa P, Chikhi L, Raufaste N, Bonhomme F. GENETIX 4.05, logiciel sous Windows TM pour la génétique des populations. Laboratoire Génome, Populations, Interactions, Université de Montpellier II; Montpellier (France): 2004. [Google Scholar]
- 30.Rannala B, Mountain JL. Detecting immigration by using multilocus genotypes. Proc Natl Acad Sci U S A. 1997;94:9197–201. doi: 10.1073/pnas.94.17.9197. [DOI] [PMC free article] [PubMed] [Google Scholar]
- 31.Felsenstein J. PHYLIP - Phylogeny Inference Package (Version 3.2) Cladistics. 1989;5:164–166. [Google Scholar]
- 32.Page RD. TreeView: an application to display phylogenetic trees on personal computers. Comput Appl Biosci. 1996;12:357–8. doi: 10.1093/bioinformatics/12.4.357. [DOI] [PubMed] [Google Scholar]
- 33.Schneider S, Roessli D, Excoffier L. Arlequin: A software for population genetics data analysis. Genetics and Biometry Lab, Dept. of Anthropology, University of Geneva; 2000. [Google Scholar]
- 34.Peakall R, Smouse PE. GENALEX 6: genetic analysis in Excel. Population genetic software for teaching and research. Molecular Ecology Notes. 2006;6:288–295. doi: 10.1093/bioinformatics/bts460. [DOI] [PMC free article] [PubMed] [Google Scholar]
- 35.Goudet J. Fstat version 1.2: a computer program to calculate Fstatistics. Journal of Heredity. 1995;86:485–486. [Google Scholar]
Associated Data
This section collects any data citations, data availability statements, or supplementary materials included in this article.