

1. Introduction
Although deep brain stimulation of the subthalamic nucleus (STN DBS) is well-established as an effective treatment of Parkinson disease (PD) (Limousin et al., 1995; Deuschl et al., 2006), motor, psychiatric and cognitive effects are quite variable (Houeto et al., 2002; Hershey et al., 2004; Burn & Troster, 2004). Part of this variability could be due to variability in the stimulus location with respect to functional areas of the STN and nearby structures (Parent & Hazrati, 1995; Perriol et al., 2006; Mandat et al., 2006). Therefore, it is critically important to accurately locate the active contact delivering STN DBS after surgical implantation (McClelland et al., 2005; Guehl et al., 2007; Pollo et al., 2007).
Localization of electrode contacts in and near the STN is hampered by difficulty identifying STN borders on MR images. The hypointensity signal induced in part by the iron content of the STN on T2-weighted MR images is known to be inhomogeneous throughout the anterior to posterior axis of the STN (Dormont et al., 2004; Richter et al., 2004). Some investigators have attempted to solve this problem by applying atlas-based scaling to improve the localization of the STN (Saint-Cyr et al., 2002; Starr et al., 2002; Voges et al., 2002; Yelnik et al., 2003). Yelnik et al. (2003) used a 3-dimensional deformation similar to that developed by Talairach et al. (1967, 1988) using the Schaltenbrand and Wahren atlas (2004). Because this atlas has irregularly spaced sections, this requires choosing one atlas section that appears to visually correspond to the MR section containing the active contact. Subjective bias and irregular atlas sampling could contribute to inaccuracies.
To improve upon such methods, we developed an atlas registration procedure using reliably identifiable structural fiducials. We chose the Mai atlas (2004) as the reference because it has coronal histological sections at regular 1.34 mm intervals that permit more precise 3-dimensional localization of structures whose boundaries are indistinct in MR images. The fiducials we used for stereotactic space transformation are both close to and bound the volume containing STN and, therefore, would be expected to improve localization within this area (François et al. 1996; Yelnik et al. 2003).
2. Methods
2.1 Participants
Twenty-nine patients with PD who had undergone bilateral implantation of STN DBS stimulators (Tabbal et al. 2007, in press) with pre-operative MR and post-operative CT images as part of their routine clinical care were included in this study.
2.2 Image Acquisition
Pre-operative MR images were acquired with a Siemens Vision 1.5T scanner and included two T2-weighted turbo spin-echo sequences: one acquired in transverse planes covering the entire brain (TR = 8904 ms, TE = 90 ms, flip angle=180, 53 planes, 1 × 1 × 2 mm voxels) and one acquired in coronal planes spanning at least the STN, red nucleus and posterior commissure (TR = 3700 ms, TE = 96 ms, flip angle = 180, 19 slices, 1 × 1 × 2 mm voxels). Post-operative CT images were acquired with a Siemens Somatom Plus 4 scanner (0.5 × 0.5 × 2 mm voxels, 120 kV, 360 mAs). Head movement was prohibited during MR imaging by a Leksell stereotactic frame attached to the skull. CT images were obtained after removal of the frame and were examined for movement, recognizable by discontinuities along the skull in coronal and sagittal views. CT images with interslice movement cannot be used. All scans analyzed here had no noticeable movement.
To determine how much of the electrode tip extends into the final 2-mm thick section, we acquired CT images of the DBS electrode alone with a Siemens Somatom Definition scanner to visualize the tip (0.4 × 0.4 × 0.6 mm voxels) and then reconstructed 2.0 mm thick sections at multiple offsets in 0.1 mm increments to correlate the measured radiodensity with the tip penetration of that section.
2.3 Image Registration
The transverse whole-brain and coronal MR images for each patient were co-registered using Automated Image Registration software (AIR, Roger Woods, University of California, Los Angeles, USA) using a 6-parameter rigid-body transformation with intensity rescaling while minimizing the squared voxel intensity difference (Woods et al., 1992). The CT image was co-registered to the whole-brain MR with AIR using a 6-parameter rigid-body transformation and minimizing the standard deviation of the ratio image (Woods et al., 1993). This co-registration of bone in CT with corresponding areas in MR was facilitated by inverting the pixel intensities of the T2-weighted image and masking outside the scalp so that bone had the greatest intensity in both MR and CT images. Both co-registrations used an initial manual estimate followed by an automatic search for optimal correspondence. The accuracy of image co-registration within and across image modalities using this method has been well-validated (Woods et al., 1998a,b).
2.4 Fiducial Identification
Objective rules were developed to locate structural fiducials close to and surrounding the STN. These included the centers of the anterior (AC) and posterior commissures (PC), the center of the anterior portion of the optic chiasm (OX), the centers of the optic tracts (OT) where they intersect the mid-commissural plane, the anterior tip of the putamen (Pu) in the bicommissural plane, the centers of the red nuclei (RN), the edge of the brain (BE) in the mid-commissural plane, and left-right tilt based on the dorsal edges of cerebrospinal fluid space overlying the hippocampi viewed on a mid-commissural coronal plane. Using locally-developed software, two raters independently identified the fiducials in all 29 patients on co-registered transverse and coronal MR sections (each with 1-mm resolution). Each rater could position a cursor with 0.5-mm precision (either on or between adjacent pixels) in 3-dimensions, and each rater was blind to the patient’s identity and to the other rater’s fiducial selections.
The fiducial locations are illustrated in Fig 1. These were defined using the two T2-weighted MR images after approximately orienting them to the atlas and interpolating to 1×1×1 mm voxels. Transverse images were sharpest with a 3D windowed sinc interpolation (executed by AIR) and this was used except for OX, which was too near the edge of the data set to be artifact free and therefore trilinear interpolation was used. Our coronal slab was too narrow for artifact-free sinc interpolation so nearest neighbor interpolation was used where the coronal view was not needed for anterior-posterior (AP) positioning and a sharper image was desirable (AC and BE), while trilinear interpolation was used everywhere else. For AC, the vertical position was first identified as the center of the horizontal line viewed on a coronal section; then lateral and AP locations are identified on the corresponding transverse section. PC was rarely adequately visualized on the coronal view, so the vertical position was identified as the transverse section where the PC was darkest and straight at the back of the third ventricle; the middle of the dark line was the AP location, and the lateral location was centered in the third ventricle. For OX, AP and vertical locations are identified first on the coronal section with the thickest, darkest horizontal band; then the lateral position was identified on a transverse section as the bisection of the angle between the optic nerves (best visualized 1-2 sections inferiorly). For OT, the AP location was set as the mid-commissural plane determined by the previously defined AC and PC; the vertical and lateral locations are identified as the center of the elongated dark OT appearing on the coronal section (checking adjacent sections to avoid confusion with the flow void of vessels often running alongside the OT). For Pu, the vertical location was set as the commissural plane using the previously defined AC and PC; the AP and lateral locations were identified as the most anterior point of each Pu. BE were selected on the coronal section across the mid-commissural plane determined by the previously defined AC and PC; a vertical line was positioned to touch the most lateral tip of the gyrus of the hippocampus or the inferior frontal gyrus. For RN, the most anterior and posterior planes where the RN was visible were identified and the AP location of the center of the RN was identified as midway between; on the corresponding coronal section, the RN was fitted within a circle that could be moved horizontally and vertically to include most of the nucleus following its rounded borders. Brain tilt was determined by adjusting the angle of a horizontal line to touch the most dorsal aspect of the cerebrospinal fluid spaces superior to each hippocampus. Reliability of the fiducial identification was tested by comparing the discrepancy between the fiducial coordinates selected by the two raters; accuracy of the atlas localization was tested using the mean coordinates for each fiducial.
Fig 1.
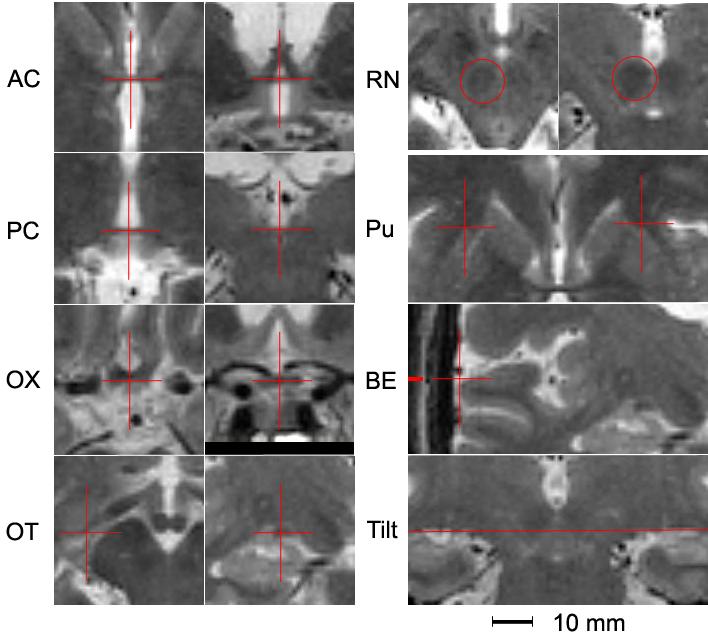
Crosshairs and horizontal line identify the locations of all fiducials. For AC, PC, OX, OT, and RN, the left figure is a transverse section and the right figure is a coronal section of an interpolated T2-weighted MR image. A transverse section is shown for Pu and coronal sections are shown for BE and Tilt.
2.5 Atlas registration
All transformations to atlas space used 9 standard parameters to define origin, orientation and stretch. AC, PC and tilt defined the origin, 3 orthogonal axes, and stretch along the y-axis (anterior-posterior). The remaining two elements, stretch along the x-axis (lateral) and z-axis (ventral-dorsal), were defined by multiple fiducial points to determine the most accurate fit. For x-axis stretch we tested OT, Pu, BE, averages of all combinations, and no stretch (i.e., maintaining the x-scale of each patient’s brain); for z-axis stretch we tested OX, OT, and no stretch. In all, 10 different maps of brain-to-atlas were tested (see Table I). These structural fiducials were matched to their corresponding points [x,y,z] in Mai (2004) stereotactic space: AC [0, 0, 0], PC [0, 28.5, 0], OX [0, -4, -15], OT [±18, 14, -7], Pu [±18, -18, 0], and BE [±64, 14, 0]. Note that only AC and PC were used for point-to-point correspondences. The remaining fiducials were used to define distances along orthogonal axes. The maximum x-dimension for BE was identified within ±10 mm of the bicommissural plane. Finally, the centers of the RN [±4.2, 22.6, -6.7] were used to test the correspondence of the transformed images to the atlas.
Table 1.
Discrepancy in localization of the center of the red nucleus using the fiducial-based atlas registration compared with raters’ judgment. All atlas transformations used AC, PC, and tilt plus those additional ones checked here. All error and SD values are in mm.
| Fiducials Used | Mean Error | SD | Maximum Error | |||||||||
|---|---|---|---|---|---|---|---|---|---|---|---|---|
| OX | OT | Pu | BE | X | Y | Z | X | Y | Z | X | Y | Z |
| -0.1 | 0.9 | 0.6 | 1.0 | 0.7 | 0.7 | 2.0 | 2.5 | 1.8 | ||||
| X | -0.1 | 0.9 | 0.0 | 0.9 | 0.7 | 1.1 | 1.8 | 2.6 | 2.6 | |||
| X | -0.0 | 0.9 | 0.9 | 0.6 | 0.7 | 0.7 | 1.6 | 2.6 | 2.2 | |||
| X | X | -0.1 | 0.9 | -0.0 | 0.6 | 0.7 | 1.1 | 1.6 | 2.6 | 2.7 | ||
| X | X | -0.1 | 0.9 | -0.0 | 0.7 | 0.7 | 1.1 | 1.8 | 2.6 | 2.7 | ||
| X | X | -0.1 | 0.9 | 0.0 | 1.0 | 0.7 | 1.1 | 2.1 | 2.5 | 2.6 | ||
| X | X | X | -0.1 | 0.9 | -0.0 | 0.6 | 0.7 | 1.1 | 1.5 | 2.6 | 2.7 | |
| X | X | X | -0.1 | 0.9 | 0.0 | 0.8 | 0.7 | 1.1 | 1.8 | 2.5 | 2.7 | |
| X | X | X | -0.1 | 0.9 | 0.0 | 0.8 | 0.7 | 1.1 | 1.8 | 2.5 | 2.7 | |
| X | X | X | X | -0.1 | 0.9 | 0.0 | 0.7 | 0.7 | 1.1 | 1.6 | 2.5 | 2.7 |
2.6 Active contact localization
The coordinates of each electrode tip were located on the original CT image. The 4 contacts of the electrode are spaced at 2.0 mm intervals with each contact spanning 1.5 mm (1.27 mm in diameter) separated from the next by a 0.5 mm gap (quadrapolar electrode model 3389, Medtronic Activa System, Soletra Model, Medtronic, Inc.). A plastic tip extends beyond the final contact for 1.5 mm. Viewing the CT images at intensities chosen to distinguish metal and bone eliminates the artifacts visible at lower contrasts used for visualizing brain tissue (Fig 2A and B). The center of each electrode is easily identified and a line was defined by the center of its tip and the center of the track three planes above it. The depth of penetration of the metal tip in the last plane in which it was visible was determined from its radiodensity in that final plane (Fig 2C) compared to a plot of its radiodensity vs. the extent of penetration of the electrode into a 2-mm thick section (Fig 3). The center of the deepest contact is 0.75 mm above the tip along the line of projection of the electrode. The other contacts are 2, 4 or 6 mm above this. Points representing each contact measured in this manner on the CT images could be transformed to the resliced MR images in atlas space along with a digital overlay of the stereotaxic atlas.
Fig 2.

A illustrates the electrode artifact seen when viewing CT images scaled to intensities where brain tissue is visible. B is the same CT image as A but scaled to the peak intensity of the electrodes. C is 2 sections below the section illustrated in A & B and is scaled to the peak intensity of the right-hand electrode, only part of which penetrates this plane. D is a coronal section of a CT scan of the DBS electrode with a 0.2 mm wire positioned immediately adjacent to its tip. A, B and C are 2-mm transverse sections; D acquired in 0.6 mm sections.
Fig 3.
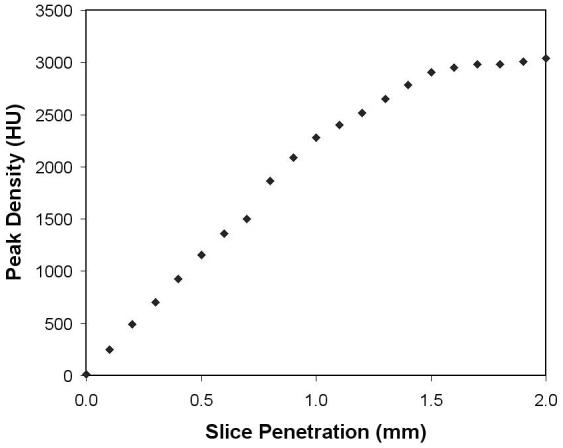
Peak density of the DBS electrode tip in Hounsfield units as a function of the distance it extends into a 2-mm thick section of a CT image.
3. Results
3.1 Fiducial Identification
The average intra-class correlation between raters for all fiducial locations was 0.93 (Table II). Mean discrepancies between the two raters for x, y, and z for all fiducial coordinates for the atlas mapping were less than 0.33 mm.
Table 2.
Inter-rater correlations and discrepancies in localizing the fiducials between two blinded raters
| Intraclass Correlation Coefficients | Mean Location (mm) | Maximum Difference (mm) | ||||||||
|---|---|---|---|---|---|---|---|---|---|---|
| Fiducial | X | Y | Z | Mean | X | Y | Z | X | Y | Z |
| AC | 0.92 | 0.95 | 0.88 | 0.92 | -0.03 | -0.09 | -0.24 | 0.50 | 0.50 | 1.00 |
| PC | 0.86 | 0.99 | 0.89 | 0.91 | 0.05 | -0.21 | 0.24 | 0.50 | 0.50 | 1.00 |
| OX | 0.86 | 0.94 | 0.96 | 0.92 | -0.05 | 1.00 | ||||
| OT-L | 0.96 | 0.98 | 0.97 | 0.97 | 0.24 | -0.07 | 2.50 | 1.00 | ||
| OT-R | 0.94 | 0.98 | 0.93 | 0.95 | -0.33 | -0.03 | 2.50 | 1.00 | ||
| BE-L | 0.99 | 0.98 | 0.79 | 0.92 | -0.10 | 1.50 | ||||
| BE-R | 0.98 | 0.98 | 0.82 | 0.93 | 0.28 | 3.00 | ||||
| Pu-L | 0.99 | 0.83 | 0.79 | 0.87 | -0.03 | 1.00 | ||||
| Pu-R | 0.98 | 0.93 | 0.77 | 0.89 | -0.02 | 1.00 | ||||
| RN-L | 0.77 | 0.95 | 0.86 | 0.86 | -0.29 | 0.07 | 0.19 | 1.00 | 1.00 | 1.00 |
| RN-R | 0.80 | 0.96 | 0.88 | 0.88 | 0.45 | -0.12 | -0.03 | 1.00 | 1.50 | 1.00 |
| Tilt | 0.97 | 0.97 | ||||||||
| Mean | 0.93 | |||||||||
3.2 Atlas Registration
There were only small differences in accuracy among the combinations of fiducials tested (Table I). For x (lateral), mean errors were 0.1 mm for all combinations tested with the maximum error for any patient occurring when BE was used. The smallest maximum error for x was obtained when OT and Pu were used to define the x-dimension. Both of these fiducial points were more difficult to judge precisely than all other fiducials considered in this study and they had the greatest maximum differences between raters (Table II). Registration quality was little affected by omitting stretch to fit the x-dimension. For z (ventral-dorsal), mean errors were 0.05 mm when OX was used compared with 0.9 mm for OT and 0.6 mm with no fiducial defining z-axis stretch.
When AC, PC, OX, and tilt alone were used to define the atlas transformation, the maximum difference in fiducial location between the two raters for all 29 patients for AC and PC was 0.5 mm for x and y and 1.0 mm for z with a maximum difference in tilt of 0.9 degree. Using only these fiducials, the mean error in locating RN was 0.1, 0.9, and 0.0 mm (x,y,z) with standard deviations of 0.9, 0.7, and 1.1 mm.
Fig 4 shows two planes of the mean of all 29 atlas-transformed coronally-acquired MR images. Note that the centers of the RN with its dark boundaries are well-circumscribed by the atlas boundaries (Fig 4A). The sharp delineation of the RN made it ideal for a validation landmark. In contrast, there is far less correspondence between image contrast and atlas boundaries for the center of the STN (Fig 4B). In this section there is no clearly demarcated dark area identifiable as STN; the dark contrast structure below the STN corresponds to substantia nigra.
Fig 4.
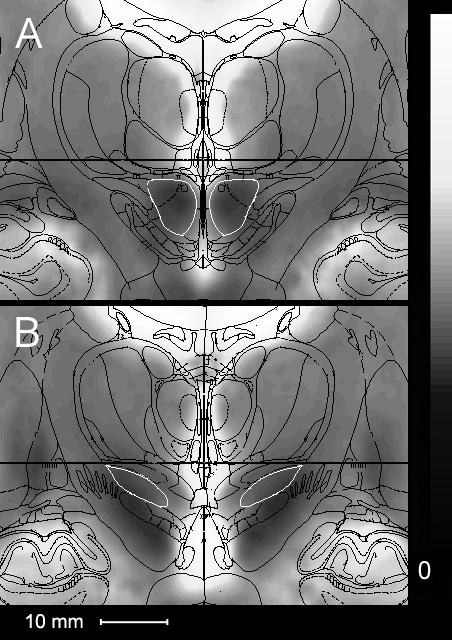
Composite mean MR images of 29 STN DBS patients. A corresponds to section 39 (22.6 mm posterior to AP) of Mai et al. (2004). B corresponds to section 34 (16.0 mm posterior to AP). Both sections show the structural boundaries of Mai overlaid with the RN outlined in white in A and the STN outlined in white in B.
4. Discussion
We have developed an objective procedure for identifying structural fiducials close to the STN, with high inter-rater reliability. Based on these objectively and reliably defined fiducials, we are able to accurately register the pre-operative MR images and post-operative CT image into Mai atlas space and locate the active contacts used in STN DBS for PD patients. This new technique will permit more accurate and reliable identification of the location of the STN DBS electrode contacts after implantation.
The majority of previous research studies on DBS have either simply presumed accurate placement of the electrodes based on intra-operative data or have attempted localization with post-operative MR (Saint-Cyr et al., 2002; Starr et al., 2002; McClelland et al., 2005; Pollo et al., 2007; Guehl et al., 2007). Because the metal contacts produce local inhomogeneities on MR scans, we use post-operative CT scans co-registered with pre-operative MRI to provide greater accuracy of electrode localization. The post-operative CT also has an artifact (beam hardening star-like distortion) but this only interferes with visualization of adjacent low-density structures and does not distort the relationship of the electrode tip with the skull. Therefore, the trajectory and tip of the electrode can be precisely located with respect to bone. Co-registration of the post-operative CT with the pre-operative MR then permits precise localization of the electrode and the contacts with respect to the undistorted STN from the pre-operative MR. Furthermore, because of safety risks in performing MR scans on patients with metal implants (O’Gorman et al., 2004; FDA warning, 2005; Medtronic advisory, 2005), we do not acquire MR scans on patients with implants for research purposes. O’Gorman et al. (2004) compared post-operative MR with post-operative CT in the same DBS patients (co-registering both to pre-operative MR) and concluded that the post-operative CT allows for accurate identification of the electrode locations without the safety risks associated with post-operative MR. However, some recent studies report shifts in deep brain structure during some DBS surgeries (Halpern et al., 2007; Khan et al., 2007). These results would argue for a post-surgical MR for confirmation or adjustment of the identified electrode position.
A potential source of localization error at the sub-millimeter level may be the current manufacturing tolerance of the DBS electrodes. Micro-examination of some electrodes (e.g., Moss et al., 2004) has revealed minor variations from the published schematics.
Using the RN as a validation structure was reliable and successful. When all 29 patients are averaged, the dark center of the RN remains clearly visible in the center of the atlas boundaries (Fig 4A). Although the mean accuracy of the localization of RN is small in all dimensions; it is clearly larger for y (0.9 mm) than for x (0.1 mm) and z (0.0 mm). This is probably due to the lower sampling of microscopic coronal sections in the Mai atlas (which has sections every 1.34 mm) compared with the much finer sampling within the x-z plane. In contrast to the RN, the STN boundaries remain indistinct after averaging high-resolution T2-weighted images from the 29 patients (Fig 4B), confirming the unreliability of using contrast boundaries for identifying STN reported by others (Dormont et. al, 2004). Indeed, if the STN were readily identifiable in individual MR images, it would not require localization using indirect means.
Non-linear elastic transformations to match individual brains to atlases have been valuable tools, particularly in matching cortical areas (Christensen et. al, 1997; Rohde et. al, 2003). The midbrain, however, lacks the abundant high-contrast boundaries circumscribing anatomical areas. While elastic transformations may be superior to the fiducial-based linear approach used here, they will require histological or physiological data for validation. By their very nature, they would generate perfect contrast maps of the validation point we used (RN) but it is unclear what improvement that approach would provide for localization of STN, which is poorly defined by contrast in our MR images.
Castro et. al (2006) compared a number of registration algorithms to localize STN. They found significantly better matches using methods relying on local structures compared with whole-brain registration. On the other hand, there was roughly the same 1.5 mm residual error in all of the linear and non-linear local methods, which is comparable to our results. They used two experts’ localization of the center of the STN as the validation point which led to discarding nearly 80% of their images in which STN was not clearly visible. Faced with the same lack of clarity of the STN, we chose to use all images while using the readily identifiable RN as the validation point.
The Mai atlas uses stained tissue sections that provide more objective identification of the STN than other atlases. However, the amount of tissue shrinkage in the atlas brain has been estimated but is not precisely known. This is a potential problem of any atlas based on post-mortem brains. The Mai atlas has an advantage compared to the Schaltenbrand and Wahren atlas (1977) which has irregularly-spaced sections that make precise 3-dimensional localization difficult. Researchers who have used the latter have attempted to visually match image slices with a corresponding atlas slice (Yelnik et al., 2003). The combined 3-D histological and MR atlas reported by Yelnik et al. (2007) would likely be a substantial improvement over existing atlases when it is made available in a digital format.
The smallest maximum error for x in localizing the RN was obtained when OT and Pu were used to define the x-dimension (Table I). However, both these fiducial points were more difficult to judge precisely than all other fiducials considered in this study. The anterior tip of the putamen is often ill-defined, and the optic tract is frequently obscured by the flow void artifact of blood vessels near the mid-commissural plane. Registration quality was little affected by omitting stretch to fit the x-dimension. This makes our method simpler to use since the rater would only need to locate the AC, PC, OX and adjust the tilt.
The atlas registration method described here was designed to be highly accurate within the limited region near the STN. Using pre-operative MR and post-operative CT images, we are able to localize electrode contacts in STN DBS without the reliance on more subjective methods or at the risk of potential patient harm in collecting post-operative MR. We have demonstrated high interrater reliability in identifying structural fiducials and high accuracy in localizing a more clearly defined nearby structure (RN). This method will be an important and useful tool in examining the relationship between STN DBS stimulus site and motor, cognitive, and psychiatric functioning.
Acknowledgments
Supported by: Greater St. Louis Chapter of the American Parkinson Disease Association (APDA), NIH (NS41248; NS41509; T32 DA07261), APDA Advanced Center for PD Research at Washington University, Sam & Barbara Murphy Fund and Barnes-Jewish Hospital Foundation (Elliot H Stein Family Fund and the Jack Buck Fund for PD Research).
Footnotes
Publisher's Disclaimer: This is a PDF file of an unedited manuscript that has been accepted for publication. As a service to our customers we are providing this early version of the manuscript. The manuscript will undergo copyediting, typesetting, and review of the resulting proof before it is published in its final citable form. Please note that during the production process errors may be discovered which could affect the content, and all legal disclaimers that apply to the journal pertain.
References
- 1.Bardinet E, Dormont D, Malandain G, Bhattacharjee M, Pidoux B, Saleh C, Cornu P, Ayache N, Agid Y, Yelnik J. Retrospective cross-evaluation of an histological and deformable 3D atlas of the basal ganglia on a series of Parkinsonian patients treated by deep brain stimulation. Medical Image Computing & Computer-Assisted Intervention: MICCAI. 2005;8:385–393. doi: 10.1007/11566489_48. [DOI] [PubMed] [Google Scholar]
- 2.Burn DJ, Troster AI. Neuropsychiatric complications of medical and surgical therapies for Parkinson’s disease. J Geriatr Psychiatry Neurol. 2004;17:172–180. doi: 10.1177/0891988704267466. [DOI] [PubMed] [Google Scholar]
- 3.Castro FJS, Pollo C, Meuli R, Madeer P, Cuisenair O, Cuadra MB, Villemure J-G, Thiran J-P. A cross validation study of deep brain stimulation targeting: From experts to atlas-based, segmentatin-based and automatic registration algorithms. IEEE Trans Med Imag. 2006:1440–1450. doi: 10.1109/TMI.2006.882129. [DOI] [PubMed] [Google Scholar]
- 4.Christensen GE, Joshi SC, Miller MI. Volumetric transformation of brain anatomy. IEEE Trans Med Imag. 1997:864–877. doi: 10.1109/42.650882. [DOI] [PubMed] [Google Scholar]
- 5.Deuschl G, Schade-Brittinger C, Krack P, Volkmann J, Schäfer H, Bötzel K, Daniels C, Deutschländer A, Dillmann U, Eisner W, Gruber D, Hamel W, Herzog J, Hilker R, Klebe S, Kloß M, Koy J, Krause M, Kupsch A, Lorenz D, Lorenzl S, Mehdorn HM, Moringlane JR, Oertel W, Pinsker MO, Reichmann H, Reuß A, Schneider G-H, Schnitzler A, Steude U, Sturm V, Timmermann L, Tronnier V, Trottenberg T, Wojtecki L, Wolf E, Poewe W, Voges J. A randomized trial of deep-brain stimulation for Parkinson’s disease. N Engl J Med. 2006;355:896–908. doi: 10.1056/NEJMoa060281. [DOI] [PubMed] [Google Scholar]
- 6.Dormont D, Ricciardi KG, Tande D, Parain K, Menuel C, Galanaud D, Navarro S, Cornu P, Agid Y, Yelnik Y. Is the subthalamic nucleus hypointense on T2-weighted images? A correlation study using MR imaging and stereotactic atlas data. Am J of Neuroradiol. 2004;25:1516–1523. [PMC free article] [PubMed] [Google Scholar]
- 7.FDA Public Health Notification MRI-caused injuries in patients with implanted neurological stimulators. 2005 May; http://www.fda.gov/cdrh/safety/neurostim.html.
- 8.François C, Yelnik J, Percheron G. A stereotaxic atlas of the basal ganglia in macaques. Brain Res Bull. 1996;41:151–158. doi: 10.1016/0361-9230(96)00161-x. [DOI] [PubMed] [Google Scholar]
- 9.Guehl D, Edwards R, Cuny E, Burbaud P, Rougier A, Modolo J, Beuter A. Statistical determination of the optimal subthalamic nucleus stimulation site in patients with Parkinson disease. J Neurosurg. 2007;106:101–110. doi: 10.3171/jns.2007.106.1.101. [DOI] [PubMed] [Google Scholar]
- 10.Halpern CH, Danish SH, Baltuch GH, Jaggi JL. Brain shift during deep brain stimulation surgery for Parkinson’s disease. Stereotact Funct Neurosurg. 2007;18:37–43. doi: 10.1159/000108587. [DOI] [PubMed] [Google Scholar]
- 11.Hershey T, Revilla F, Wernle A, Schneider-Gibson P, Dowling J, Perlmutter JS. Stimulation of STN impairs aspects of cognitive control in PD. Neurology. 2004;62:1110–1114. doi: 10.1212/01.wnl.0000118202.19098.10. [DOI] [PubMed] [Google Scholar]
- 12.Houeto JL, Mesnage V, Mallet L, Pillon B, Gargiulo M, du Moncel ST, Tezenas S, Bonnet AM, Pidoux B, Dormont D, Cornu P, Agid Y. Behavioural disorders, Parkinson’s disease and subthalamic stimulation. J Neurol Neurosurg Psychiatry. 2002;72:701–707. doi: 10.1136/jnnp.72.6.701. [DOI] [PMC free article] [PubMed] [Google Scholar]
- 13.Khan MF, Mewes K, Gross RE, Skrinjar O. Assessment of brain shift related to deep brain stimulation surgery. Stereotact Funct Neurosurg. 2007;18:44–53. doi: 10.1159/000108588. [DOI] [PubMed] [Google Scholar]
- 14.Limousin P, Pollak P, Benazzouz A, Hoffmann D, Broussolle E, Perret JE, Benabid A-L. Bilateral subthalamic nucleus stimulation for severe Parkinson’s disease. Move Disord. 1995;10:672–674. doi: 10.1002/mds.870100523. [DOI] [PubMed] [Google Scholar]
- 15.Mai JK, Assheuer J, Paxinos G. Atlas of the Human Brain. second ed. Elsevier Academic; San Diego: 2004. [Google Scholar]
- 16.Mandat TS, Hurwitz T, Honey CR. Hypomania as an adverse effect of subthalamic nucleus stimulation: report of two cases. Acta Neurochir (Wien) 2006;148:895–897. doi: 10.1007/s00701-006-0795-4. [DOI] [PubMed] [Google Scholar]
- 17.McClelland S, Ford B, Senatus PB, Winfield LM, Du YE, Pullman SL, Yu Q, Frucht SJ, McKhann GM, Goodman RR. Subthalamic stimulation for Parkinson disease: determination of electrode location necessary for clinical efficacy. Neurosurg Focus. 2005;19:E12. [PubMed] [Google Scholar]
- 18.Medtronic Urgent device correction - change of safe limits for MRI Procedures used with the Medtronic Activa Deep Brain Stimulation Systems. Medtronic advisory letter. 2005 Nov; [Google Scholar]
- 19.Moss J, Ryder T, Aziz TZ, Graeber MB, Bain PG. Electron microscopy of tissue adherent to explanted electrodes in dystonia and Parkinson’s disease. Brain. 2004;127:2755–2763. doi: 10.1093/brain/awh292. [DOI] [PubMed] [Google Scholar]
- 20.O’Gorman RL, Selway RP, Reid CJ, Hotton GR, Hall E, Jarosz JM, Polkey CE, Hill DLG. Registered computed tomography images as an alternative to postimplantation magnetic resonance imaging in the assessment of subthalamic electrode placement. J Comput Assist Tomogr. 2004;28:548–550. doi: 10.1097/00004728-200407000-00018. [DOI] [PubMed] [Google Scholar]
- 21.Parent A, Hazrati LN. Functional anatomy of the basal ganglia. II. The place of subthalamic nucleus and external pallidum in basal ganglia circuitry. Brain Res Brain Res Rev. 1995;20:128–154. doi: 10.1016/0165-0173(94)00008-d. [DOI] [PubMed] [Google Scholar]
- 22.Perriol MP, Krystkowiak P, Defebvre L, Blond S, Destee A, Dujardin K. Stimulation of the subthalamic nucleus in Parkinson’s disease: cognitive and affective changes are not linked to the motor outcome. Parkinsonism Relat Disord. 2006;12:205–210. doi: 10.1016/j.parkreldis.2005.11.009. [DOI] [PubMed] [Google Scholar]
- 23.Pollo C, Vingerhoets F, Pralong E, Ghika J, Maeder P, Meuli R, Thiran J-P, Villemure J-G. Localization of electrodes in the subthalamic nucleus on magnetic resonance imaging. J Neurosurg. 2007;106:36–44. doi: 10.3171/jns.2007.106.1.36. [DOI] [PubMed] [Google Scholar]
- 24.Richter EO, Hoque T, Halliday W, Lozano AM, Saint-Cyr JA. Determining the position and size of the subthalamic nucleus based on magnetic resonance imaging results in patients with advanced Parkinson disease. J Neurosurg. 2002;100:541–546. doi: 10.3171/jns.2004.100.3.0541. [DOI] [PubMed] [Google Scholar]
- 25.Rohde GK, Aldroubi A, Dawant BM. The adaptive bases algorithm for intensity-base nonrigid image registration. IEEE Trans Med Imag. 2003:1470–1479. doi: 10.1109/TMI.2003.819299. [DOI] [PubMed] [Google Scholar]
- 26.Saint-Cyr JA, Hoque T, Pereira LC, Dostrovsky JO, Hutchison WD, Mikulis DJ, Abosch A, Sime E, Lang AE, Lozano AM. Localization of clinically effective stimulating electrodes in the human subthalamic nucleus on magnetic resonance imaging. J Neurosurg. 2002;97:1152–1166. doi: 10.3171/jns.2002.97.5.1152. [DOI] [PubMed] [Google Scholar]
- 27.Schaltenbrand G, Wahren W. Atlas for Stereotaxy of the Human Brain. Georg Thieme Verlag; Stuttgart: 1977. [Google Scholar]
- 28.Starr PA, Christine CW, Theodosopoulos PV, Lindsey N, Byrd D, Mosley A, Marks WJ. Implantation of deep brain stimulators into the subthalamic nucleus: technical approach and magnetic resonance imaging-verified lead locations. J Neurosurg. 2002;97:370–387. doi: 10.3171/jns.2002.97.2.0370. [DOI] [PubMed] [Google Scholar]
- 29.Tabbal SD, Revilla F, Mink JW, Schneider-Gibson P, Wernle A, de Erausquin GA, Perlmutter JS, Rich KM, Dowling JL. Safety and efficacy of subthalamic nucleus deep brain stimulation performed with limited intra-operative mapping for treatment of Parkinson disease. Neurosurgery. 2007 doi: 10.1227/01.neu.0000289725.97211.51. in press. [DOI] [PubMed] [Google Scholar]
- 30.Talairach J, Szikla G, Tournoux P, Prossalentis A, Bordas-Ferrer M, Covello L, Iacob M, Mempel E. Atlas d’anatomie stéréotaxique du télencéphale. Masson; Paris: 1967. [Google Scholar]
- 31.Talairach J, Tournoux P. Co-planar stereotaxic atlas of the human brain. Thieme; New York: 1988. [Google Scholar]
- 32.Voges J, Volkmann J, Allert N, Lehrke R, Koulousakis A, Freund H-J, Sturm V. Bilateral high-frequency stimulation in the subthalamic nucleus for the treatment of Parkinson disease: correlation of therapeutic effect with anatomical electrode position. J Neurosurg. 2002;96:269–279. doi: 10.3171/jns.2002.96.2.0269. [DOI] [PubMed] [Google Scholar]
- 33.Woods RP, Cherry SR, Mazziotta JC. Rapid automated algorithm for aligning and reslicing PET images. J Comput Assist Tomogr. 1992;16:620–633. doi: 10.1097/00004728-199207000-00024. [DOI] [PubMed] [Google Scholar]
- 34.Woods RP, Mazziotta JC, Cherry SR. MRI-PET registration with automated algorithm. J Comput Assist Tomogr. 1993;14:536–546. doi: 10.1097/00004728-199307000-00004. [DOI] [PubMed] [Google Scholar]
- 35.Woods RP, Grafton ST, Holmes CJ, Cherry SR, Mazziotta JC. Automated image registration: I. General methods and intrasubject, intramodality validation. J Comput Assist Tomogr. 1998;22:139–152. doi: 10.1097/00004728-199801000-00027. [DOI] [PubMed] [Google Scholar]
- 36.Woods RP, Grafton ST, Watson JDG, Sicotte NL, Mazziotta JC. Automated image registration: II. Intersubject validation of linear and nonlinear models. J Comput Assist Tomogr. 1998;22:153–165. doi: 10.1097/00004728-199801000-00028. [DOI] [PubMed] [Google Scholar]
- 37.Yelnik J, Bardinet E, Dormont D, Malandain G, Ourselin S, Tandé D, Karachi C, Ayache N, Cornu P, Agid Y. A three-dimensional, histological and deformable atlas of the human basal ganglia. I. Atlas construction based on immunohistochemical and MRI data. Neuroimage. 2007;34:618–638. doi: 10.1016/j.neuroimage.2006.09.026. [DOI] [PubMed] [Google Scholar]
- 38.Yelnik J, Damier P, Demeret S, Gervais D, Bardinet E, Bejjani B-P, François C, Houeto J-L, Arnulf I, Dormont D, Galanaud D, Pidoux B, Cornu P, Agid Y. Localization of stimulating electrodes in patients with Parkinson disease by using a three-dimensional atlas-magnetic resonance imaging coregistration method. J Neurosurg. 2003;99:89–99. doi: 10.3171/jns.2003.99.1.0089. [DOI] [PubMed] [Google Scholar]