

Abstract
The neurotransmitter glutamate is the mediator of excitatory neurotransmission in the brain. Release of this signaling molecule is carefully controlled by multiple mechanisms, yet the methods available to measure released glutamate have been limited in spatial and/or temporal domains. We have developed a novel technique to visualize glutamate release in brain slices using two purified FRET-based glutamate sensor proteins. Using a simple loading protocol, the FRET sensor proteins diffuse deeply into the extracellular space and remain functional for many tens of minutes. This allows imaging of glutamate release in brain slices with simultaneous electrophysiological recordings and provides temporal and spatial resolution not previously possible. Using this glutamate FRET sensor loading and imaging protocol, we show that changes in network excitability and glutamate reuptake alter evoked glutamate transients and produce correlated changes in evoked cortical field potentials. Given the sophisticated advantages of brain slices for electrophysiological and imaging protocols, the ability to perform real time imaging of glutamate in slices should lead to key insights in brain function relevant to plasticity, development and pathology. This technique also provides a unique assay of network activity that compliments alternative techniques such as voltage-sensitive dyes and multi-electrode arrays.
1. Introduction
Glutamate is an amino acid neurotransmitter which mediates 90% of the excitatory neurotransmission in the central nervous system (Cotman and Monaghan, 1986). Glutamate is released into the synaptic cleft when action potentials depolarize synaptic terminals and glutamate-filled synaptic vesicles fuse with the plasma membrane (De Belleroche and Bradford, 1977). Once in the cleft, glutamate activates post-synaptic glutamate receptors (Moore, 1993) to trigger ionic current flow thus completing this form of chemical communication. Glial reuptake then removes glutamate from the synaptic cleft to terminate the glutamate signal (Auger and Attwell, 2000;Diamond, 2005). As with other biological signaling pathways, the temporal and spatial extent of glutamate release shapes the resulting response, which in the case of neurons is postsynaptic excitation. It has been difficult, however, to quantify the rapid changes in extracellular glutamate concentration (glutamate transients) that occur with synaptic stimulation.
In the past, techniques such as microdialysis of cerebrospinal fluid (Zhang, Takeda et al., 2005), enzyme-linked fluorescence assays (Nicholls and Sihra, 1986;Innocenti, Parpura et al., 2000), electrical recording from cells expressing glutamate receptors (Diamond, Bergles et al., 1998), and enzymatic glutamate-selective electrodes (Hu, Mitchell et al., 1994;Oldenziel, Dijkstra et al., 2006) have been used to study extracellular glutamate transients. These techniques have been extremely useful but have low spatial and/or temporal resolution. To fully understand the characteristics of glutamate transients, tools that are capable of assessing real time changes in glutamate are needed.
Recent molecular innovations have made it possible to measure glutamate transients in entirely new ways (Okumoto, Looger et al., 2005;Deuschle, Okumoto et al., 2005;Namiki, Sakamoto et al., 2007). Optical detection of glutamate using fluorescence (Förster) energy resonance transfer (FRET) based sensor proteins offers the potential to greatly enhance the temporal and spatial resolution at which glutamate transients can be measured. The FLIPE-600n glutamate sensor, one of the first FRET-based glutamate sensor proteins (Okumoto, Looger, Micheva, Reimer, Smith, and Frommer, 2005), consists of the E. coli glutamate binding protein ybeJ fused to cyan fluorescent protein (CFP) on the n-terminus and Venus, a variant of yellow fluorescent protein (YFP) (Miyawaki, 2002) on the c-terminus. CFP and Venus are positioned such that a portion of CFP’s emission energy is transferred non-radiatively to Venus, a phenomenon known as FRET. Because the FRET phenomenon is extremely distance- and dipole-dipole orientation dependent small conformational changes can lead to large changes in FRET efficiency. When the FRET sensor protein binds glutamate, conformational change of the ybeJ domain leads to lower FRET efficiency thus making measurement of glutamate possible. Strategic molecular design and modification of the FLIPE-600n sensor protein has resulted in a series of enhanced sensors (Deuschle, Fehr et al., 2005). First, mutagenesis of the residues located at the perimeter of the ligand binding pocket has resulted in sensor proteins that have different affinities for glutamate ranging from 600 nM to 1 mM. Second, a different protein design, known as FLII81E, carries CFP as an insertion in ybeJ, while Venus is fused to the C-terminus. This design reduces rotational averaging and results in fluorescence ratio changes up to three-fold larger than those seen using FLIPE sensors.
The ability to image glutamate transients in brain slices not only represents an evolutionary step in glutamate FRET sensor technology, but also is the next step in deconstructing complex neuronal network behavior into its component pieces. Just as photolysis of caged glutamate has allowed analysis of the post-synaptic aspect of neural connectivity (Dalva and Katz, 1994;Shepherd, Pologruto et al., 2003), glutamate FRET sensor imaging will make it possible to elucidate synaptic output and decipher its relevant properties. Glutamate FRET sensor imaging in the physiological setting of brain slices may be used to address questions regarding the kinetics of extracellular glutamate transients (Brasnjo and Otis, 2004;Diamond, 2005), the diffusion of glutamate into synaptic vs. extra-synaptic zones (Diamond, 2001), and glutamate depletion and replenishment during times of increased neuronal activity (Staley, Longacher et al., 1998). Understanding pre-synaptic network activation, as measured by changes in glutamate release, is also critical for the study of neurodegeneration (Rothman, 1983), cognitive impairments (Kirvell, Esiri et al., 2006) and epilepsy (Sepkuty, Cohen et al., 2002;Fellin, Pascual et al., 2004;Yang, Woodhall et al., 2006), all disorders in which alterations in glutamatergic output have been implicated. In cortical brain slices, imaging glutamate transients with high temporal and spatial resolution would enable detection of layer-specific or cortical column-specific glutamate release which may be implicated in pathological changes in network excitability associated with disease states such as epilepsy (Jin, Prince et al., 2006).
Here we describe a method for loading brain slices with purified FRET sensor proteins, demonstrate that the FRET sensor protein uniformly penetrates into the brain slice and remains functional over extended periods of time. Using this technique we measured glutamate release using three FRET sensor proteins (FLIPE-600n = 1st generation high affinity FRET sensor, FLII81E-1μM = 2nd generation high affinity FRET sensor, and FLII81E-10μM = second generation low affinity FRET sensor) while simultaneously recording field potentials in cortical brain slices. Spatially localized glutamate transients were detectable using FLII81E-1μM with temporal resolution so far only limited by imaging speed. Blocking inhibition in cortical slices increased the peak, duration and spatial spread of glutamate transients. Inhibition of glutamate reuptake further increased the peak and duration of glutamate transients as well as delayed the time to the peak. These results demonstrate that FRET-based glutamate imaging shows great promise for high-resolution spatiotemporal imaging of glutamate transients and network activation.
2. Methods
Production of glutamate FRET sensor
BL21(DE3) bacteria were transformed with pRSET-FLIPE-600n, pRSET-FLII81E-1μor pRSET-FLII81E-10μ plasmids (Okumoto, Looger, Micheva, Reimer, Smith, and Frommer, 2005;Deuschle, Okumoto, Fehr, Looger, Kozhukh, and Frommer, 2005) and streaked on an LB plate with ampicillin (100 μg/ml). After overnight incubation at 37°C, a single colony was picked and grown in 1L LB with ampicillin (100μg/ml) for 2 days at 21°C in the dark with rapid shaking (300 rpm). Cells were harvested by centrifugation, resuspended in extraction buffer (50 mM Sodium Phosphate, 300 mM NaCl, pH7.2), and disrupted by ultrasonication and further lysed with CelLytic B reagent (Sigma). The FRET sensors were purified by Talon His-affinity chromatography (Clontech). Binding to the resin was performed in batch at 4°C, washed in a column with extraction buffer, and then eluted with extraction buffer containing 150 mM imidazole. Emission spectra and ligand titration curves were obtained by using a spectrofluorometer (excitation 433/12 nm; emission 485/12 and 528/12 nm). All analyses were done in artificial cerebrospinal fluid (aCSF) bubbled with 95% O2:5% CO2 gas mixture.
Preparation of brain slices
Cortical brain slices containing sensorimotor cortex (400 μM) were prepared from male Sprague-Dawley rats (P14-P28). Briefly, rats were anesthetized (50 mg/kg pentobarbital), decapitated, and the brains were rapidly removed and placed in chilled (4°C) low-Ca, low-Na slicing solution consisting of (in mM): 234 sucrose, 11 glucose, 24 NaHC03, 2.5 KCl, 1.25 NaH2PO4, 10 MgSO4 and 0.5 CaCl2, equilibrated with a mixture of 95% O2:5% CO2. The brain was glued to the slicing stage of a Vibratome 3000 sectioning system and slices were cut in a coronal orientation. The slices were then incubated in 32°C oxygenated aCSF for 1 hour, and then allowed to cool to room temperature and subsequently used for sensor loading and recording. All guidelines of Stanford University’s Institutional Animal Care and Use Committee were followed.
Field recordings
Cortical slices were placed in a recording chamber and held in place with a harp. Slices were completely submerged in aCSF and superfused continuously (≈2.0 ml/min) with room temperature aCSF containing (in mM): 126 NaCl, 26 NaHCO3, 2.5 KCl, 1.25 NaH2PO4, 1 MgCl2, 2 CaCl2, and 10 glucose, equilibrated with 95 % O2:5 % CO2. Extracellular field potentials from cortical layer 5 were recorded using glass micropipettes (≈ 1 MΩ) filled with aCSF. An Axon Multiclamp 700A amplifier, Digidata 1322A digitizer and pClamp software were used to collect electrophysiological data. A bipolar stimulating electrode was placed to stimulate white matter underlying the cortex every 10 seconds. Each pulse consisted of a 100 - 500 μs constant voltage stimulation delivered by a WPI stimulus isolator. Stimulation intensity was adjusted such that the control field potential amplitude was between 0.05 and 0.5 mV. Drugs were applied using a local perfusion pipette for focal application.
Loading of FRET-based glutamate sensor protein
A 35 mm tissue culture dish was filled with ≈ 2 mL aCSF and a 0.4 μm Millicell (Millipore) culture plate was inserted. Care was taken to ensure that no bubbles were present under the plate insert and that no aCSF spilled onto its top surface. A single brain slice was transferred from the incubation chamber onto the plate insert and excess aCSF was removed. The dish containing the slice was then placed in a humidified and warmed (32 °C) chamber equilibrated with 95% O2:5% CO2. 50 μL of concentrated glutamate FRET sensor protein (≈ 50 ng/μL) was then carefully applied to the top surface of the slice. After 10-20 minutes of incubation, slices were removed from the loading chamber and placed into the recording chamber.
Imaging of glutamate levels
Slices were placed in the recording chamber of a Zeiss Axioskop microscope with continual superfusion of aCSF for simultaneous imaging and electrophysiological recording. Imaging was accomplished using single excitation (440 nm/20x band pass excitation filter, Chroma, 71007a). pClamp software was used to trigger the opening of a shutter allowing computer-controlled epifluorescence illumination of the slice. Imaging was controlled by in-house software. Each full-frame imaging experiment consisted of 5 exposures per pharmacological condition. Each exposure consisted of 200 frames (1024 × 1376 pixels) and had a 10 ms exposure time and a 50 ms processing time per frame (≈17 Hz sampling, Cooke Sensicam QE, Cooke Corporation). Images were 4 × 4 pixel-binned (256 × 344 final image size) to increase sensitivity and thus temporal resolution. For line-scan imaging, 5 exposures each containing 300 images were collected with 10 ms exposure time and 10 ms processing time (≈50 Hz sampling). 32 pixels were line scanned and 16 × 1 pixel-binned (2 × 1376 final image size). To maximize the speed of the line-scan image collection, the area of the slice stimulated was placed at the top of the field of view. Image frames were synchronized to electrophysiological recordings by monitoring frame acquisition times via the camera busy signal. Illumination was kept to a minimum (3-6 seconds/exposure) to minimize photobleaching. A 2.5X Fluar objective (Zeiss, Thornwood, NY) was used to visualize slices. Emission signals first passed through a 455 DCLP dichroic mirror to eliminate excitation fluorescence and the separated into two channels using an Dual-View (Optical Insight), filtered independently using an OI-5-EM filter set (480 nm/30x and 535nm/40x band pass emission filters) to isolate CFP and Venus signals.
FRET sensor bleaching and washout characterization
To address concerns of FRET sensor bleaching and washout we used two imaging paradigms. To isolate the washout of FRET sensor, slices were loaded and superfused as described above and exposures were captured every 10 seconds using a 200 ms exposure time to minimize bleaching. Images were collected for ≈ 20 minutes and fit using an exponential decay. To isolate the effect of bleaching slices were exposed to 4 seconds of fluorescence excitation every 10 seconds. Images were collected for 25 minutes and fit using an exponential decay. To isolate the effects of bleaching the FRET sensor washout was subtracted and the resultant curve was fit using an exponential decay.
Using quantitative western blot analysis FRET sensor concentrations were determined in slices either immediately after incubation with the biosensor or after completion of a full imaging/electrophysiology experiment with a minimum of 20 min in the perfusion chamber. After rapid freezing on dry-ice and short term storage, each slice was warmed to 4° C and placed in 250 μL of calcium-magnesium free phosphate buffered saline with 1 mM EDTA and protease inhibitor and then homogenized with a Teflon glass homogenizer. Samples (15 μg of protein) were subjected to SDS-PAGE, transferred to PVDF membrane for Western blotting alongside serial dilutions of ET1 biosensor at known concentrations. Biosensor quantities were analyzed using a rabbit anti-GFP antibody (Santa Cruz Biotechnology) and an HRP coupled anti-rabbit secondary antibody. The band intensities were determined using ImageJ software (Abranoff, 2004). The amounts of biosensors in the samples were calculated using a standard curve derived from the intensities of the bands in the lanes with the known concentrations of the purified sensor. Extracellular concentration of the biosensor was estimated assuming a slice volume of 32 μl (average slices dimensions: 8 mm × 10 mm × 0.4 mm), with extracellular space assumed to be 20% of the total volume. All protein measurements were done with a Bradford assay (BioRad).
Analysis of glutamate FRET sensor data
After collection of the 2-channel imaging data the first step of processing was detection of shutter opening and closing. Next the camera dark noise was subtracted from all fluorescence values pixel by pixel. The ratio of the two fluorescence channels was computed pixel by pixel for all time-points in all images and exposures. The signal was then adjusted for photobleaching using a linear regression based on the fluorescence ratio at the beginning and end of each exposure. Average images were created from the first 3 frames after shutter opening and from the last 3 frames before shutter closing. A time-weighted average of these images was then used for background subtraction prior to ratioing. The drift in fluorescence ratio was generally less than 5% so this adjustment was minimal. All raw fluorescence values were also collected and images were saved for later reanalysis. Images were not adjusted for auto-fluorescence as none was detected in unloaded slices.
Slice sectioning and imaging
After recording and imaging, slices were fixed in a 4% para-formaldehyde solution and then rinsed with phosphate-buffered saline (PBS). Slices were then cryo-protected in 30% sucrose solution in 0.1M PBS. The tissue was then cross-sectioned (50 μm sections) on a sliding microtome. Other slices were sectioned (50 μm sections) in the plane of the slice to look for regional differences in FRET sensor loading. All sections were mounted on a glass cover-slip using VectorShield mounting media. Individual sections were visualized using a Nikon Eclipse E 800 microscope using excitation (480 nm/30x) and emission (535 nm/40m) filters appropriate for detection of Venus.
Drugs and Reagents
All salts for use in buffers were obtained from Sigma - Aldrich. DL-TBOA (Tocris, Ellisville, MI) was dissolved in DMSO in 1000X aliquots. GABAzine (Ascent, Somerset, UK) was dissolved in DMSO in 1000X aliquots.
Statistics
Statistical significance for all experiments was determined using Student’s unpaired and paired t-test, as appropriate.
3. Results
Characterization of FLII81E - 1μ sensor loading in brain slices
Cortical slices were loaded with FLII81E - 1μ using an interface-incubation loading technique as described above. Imaging of Venus and CFP fluorescence demonstrated the presence of FRET sensor in the loaded slice. The fluorescence ratio was stable over time (Fig. 1a, < 5% decrease in fluorescence ratio over 25 minutes, 200 ms of fluorescence illumination every 10 seconds) although CFP and Venus fluorescence decreased with time, presumably due to a combination of protein degradation, and wash-out from the slice (Fig. 1b, values reflect dark-noise adjusted raw fluorescence values). To isolate the effects of sensor wash-out from sensor photobleaching, we imaged slices loaded with the FRET sensor for 20-25 minutes using either a short or long fluorescence exposure time (see methods). During long exposures FRET sensor signal should decay as a function of sensor washout and sensor bleaching/degradation. During short exposure times, FRET sensor signal decay should be much more dependent on sensor washout, as minimal bleaching should occur. During long exposures FRET sensor fluorescence ratio and individual fluorescence channels decreased more rapidly. By subtracting the short exposure decay curve from the long exposure decay curve we were able to compute the decay constants for both the bleaching and washout of FRET sensor from cortical brain slices, both of which were over 30 minutes (data not shown).
Figure 1. FLII81E - 1μ glutamate sensor loading in cortical slices.

(a) Time course of FLII81E - 1μ raw fluorescence decay in cortical slices for both Venus/CFP ratio and (b) Venus (yellow) and CFP (blue) individually. (c) Venus fluorescent image of a cross-section of a cortical slice loaded with FLII81E - 1μ sensor protein. Scale bar = 50 μM. (d) Venus fluorescent image of a cross-section of a control slice, not loaded with FLII81E - 1μ sensor protein. (e) DAPI staining of the same slice shown in (a). Venus fluorescent images of a horizontal section near the (f) top (g) middle and (h) bottom of a cortical slice loaded with FLII81E - 1μ sensor protein. Scale bar = 50 μM.
We also estimated sensor loading and washout (unloading) using quantitative western blotting. Brain slices initially contained an estimated 70μM FRET sensor immediately after loading, but before any superfusion (data not shown), and following 20 minutes of superfusion the FRET sensor concentration decreased to approximately 20μM, suggesting that washout occurs over several tens of minutes. Slices used for imaging experiments presumably have a lower initial FRET sensor concentration, due to the washout that occurs during the period (∼5 min) in which the slice and electrodes were positioned prior to each recording.
Tissue cross sections obtained from slices that were fixed and sectioned following recording demonstrated that the glutamate FRET sensor fluorescence was present throughout the depth of the slice indicating that the loading procedure resulted in relatively uniform FRET sensor protein penetration (Fig. 1c). Slices not loaded with FLII81E - 1μ protein showed no Venus fluorescence (Fig. 1d). Slice health was confirmed using DAPI staining to show intact nuclei (Fig. 1e). A different set of slices was sectioned horizontally to address the uniformity of FLII81E - 1μ loading in the plane of the slice. Glutamate FRET sensor signal was spatially uniform within each individual section and sections from the top 50 μm of tissue (Fig. 1f), as well as from 150 - 200 μm (Fig. 1g), and 300-350 μm (Fig. 1h) deep into the tissue all had similar Venus fluorescence. This result indicates that there were no significant regional differences in loading of the slice. The penetration of FLII81E - 10μ showed a similar pattern (data not shown).
FLII81E - 1μ detects evoked glutamate release in cortical brain slices
The FLIPE - 600n glutamate sensor was the first FRET sensor characterized. FLIPE - 600n successfully loaded into slices and was able to resolve glutamate transients under disinhibited but not under control conditions (data not shown). To confirm that the sensor response was due to neurotransmitter release 1 μM TTX was used to block action potentials. Addition of 1 μM TTX blocked the glutamate transient seen in disinhibited slices (data not shown), indicating that the glutamate signals seen are due to evoked glutamate release.
FLII81E - 1μ, a sensor with a 1μM affinity for glutamate, was loaded into slices and evoked cortical field potentials were recorded simultaneously with image capture. FLII81E sensors have a lower affinity than FLIPE sensors, but utilize a different protein design optimized for the greatest glutamate-induced FRET ratio change (up to 3X larger than FLIPE). ROI analysis was performed on the area of the highest glutamate signal; the same ROI was used for all manipulations within each slice. Under control conditions, electrical stimulation of the white matter caused a transient decrease in FLII81E - 1μ fluorescence ratio (Fig. 2a, -2.65 ± 0.3% peak Δ FY/FC, n=23). The response peaked 63.3 ± 5.8 ms following stimulation and had a half width of 237.7 ± 9.2 ms. The signal was localized near the stimulation electrode, approximately in cortical layers 4 and 5 (Fig. 2a). Under control conditions cortical field potentials were small (<0.2 mV) and brief (<50 ms) (Fig. 2a). Excitability was then increased by local perfusion of 10 μM GABAzine, a GABAA receptor antagonist.
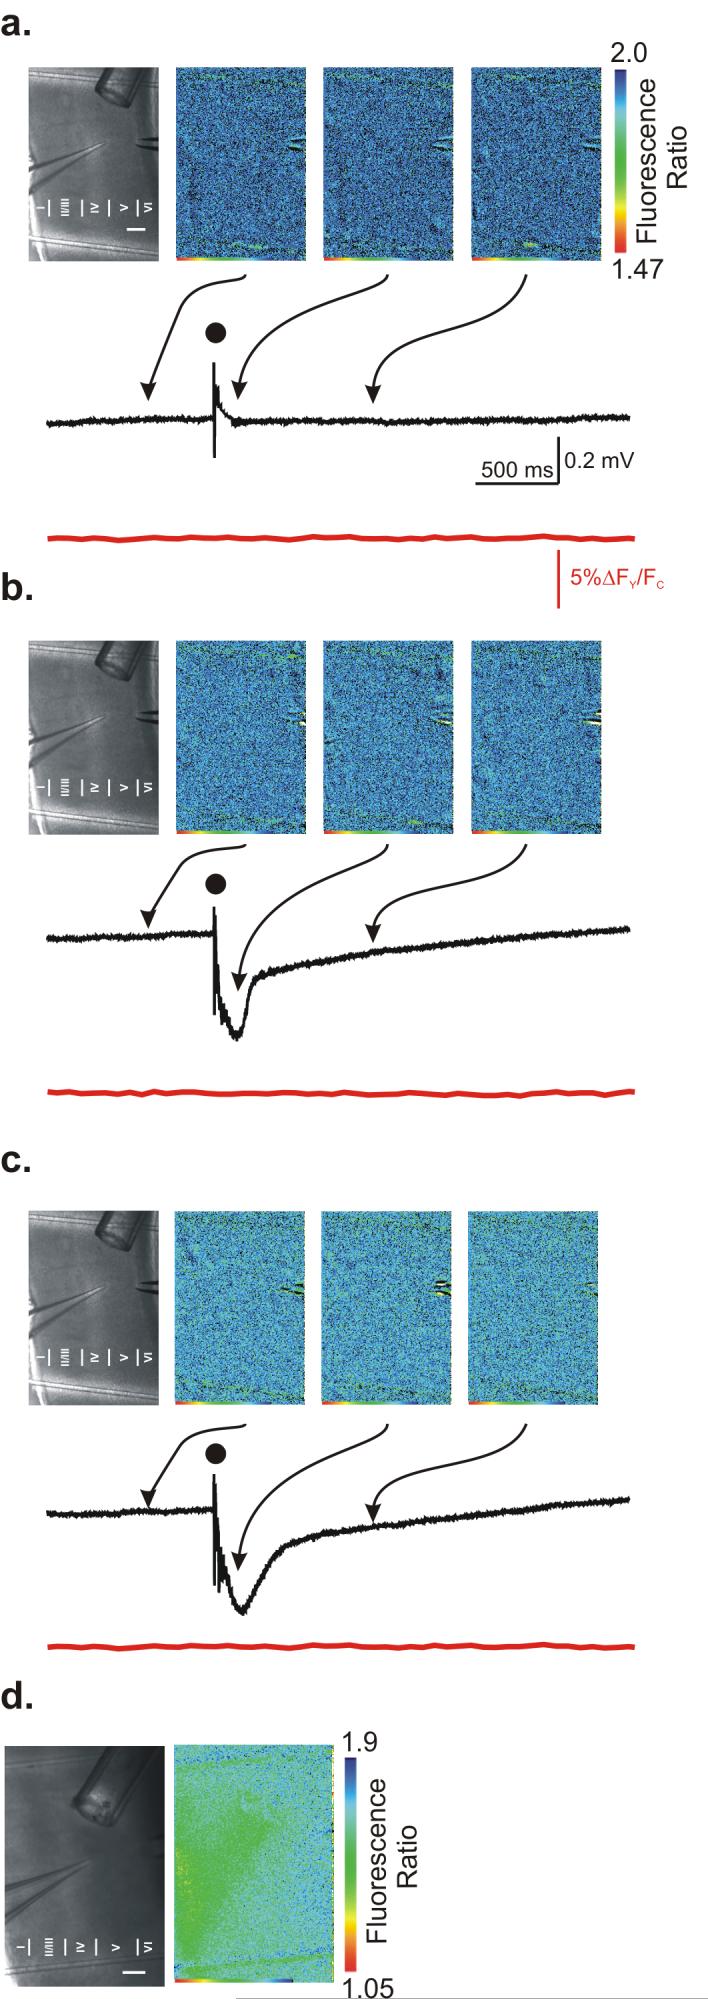
Figure 2. High-affinity FLII81E - 1μ glutamate sensor imaging.

Glutamate imaging with simultaneous cortical field recording under (a) control conditions, (b) in the presence of 10 μM GABAzine, and (c) of 10μM GABAzine + 25 μM TBOA. (a, b, & c) (top, left) Bright field image of the cortical slice. Visible in this image are the field recording electrode (left), stimulating electrode (right), local perfusion pipette (top), and a harp string holding the slice in place (bottom). Scale Bar = 250 μM for all images. Approximate positions of cortical layers are indicated in this and all subsequent figures in the lower portion of each bright field image. (top, right) Three individual glutamate FRET sensor images in each case from ≈ 200 ms before stimulation (left), ≈ 80 ms after stimulation (center), and ≈ 1 s after stimulation (right). Arrows indicate exact time of image capture with respect to cortical field recordings. Color scale bar on right indicates fluorescence ratio value in glutamate FRET sensor images. (center) Evoked cortical field recordings performed simultaneously with glutamate images. Dot indicates time of stimulation. (b and c, inset) Early cortical field potentials on an expanded time scale. Note the slower onset and later peak time in the presence of TBOA. (bottom) Normalized ROI analysis of glutamate FRET sensor images. Time scales are identical for field recordings and ROI analysis. (d) Dual channel results for the imaging results shown in parts (a-c). Blue lines represent CFP fluorescence and yellow lines represent Vensu fluorescence.
A larger and more prolonged decrease in FLII81E - 1μfluorescence ratio was seen when GABAA-mediated inhibition was blocked (-19.1 ± 0.5% peak ΔFY/FC, 416.1 ± 10.3 ms half width, n=25, p<0.01 compared to control). This glutamate transient reached its maximum later than control (Fig. 2b, 78.5 ± 2.9 ms after stimulation, p<0.05, n=25). The evoked glutamate transient seen in the presence of GABAzine generally manifested in a column-like band of cortex near the site of stimulation and then spread to adjacent cortical areas, indicating the importance of inhibitory interneurons in shaping the functional activation of the cortical network. Blockade of GABAA receptors induced a second, later phase of the field potential (indicative of extended cortical network activation), which increased in both amplitude (≈ 0.5 mV) and in duration (≈ 1.5 sec) (Fig. 2b).
Inhibition of the EAAT family of glutamate transporters by TBOA (25 μM) caused a decrease in baseline FLII81E - 1μ ratio (7.7 ± 0.4 % decrease in FRET sensor ratio after 10 minutes of exposure, n=6), indicating approximately 100 nM accumulation of extracellular glutamate (TBOA did not alter the properties of the FRET sensor in cuvette studies, data not shown). In the presence of TBOA and GABAzine, electrical stimulation produced a prolonged decrease in FLII81E - 1μ fluorescence ratio (877.5 ± 59.7 ms half width, n=25, p<0.01 compared to GABAzine alone) which peaked later (126.5 ± 9.9 ms after stimulation, n=25, p<0.01 compared to GABAzine alone) although the peak amplitude of the transient was relatively unchanged (-19.3 ± 0.8 % decrease in FLII81E - 1μ fluorescence ratio, n=25, n.s.). Under these conditions the FLII81E - 1μ signal spread over a larger area of cortex, although the amplitude of glutamate transients was relatively small in layers 4 and 5 compared to layers 2/3 and 6. Blockade of glutamate transporters also prolonged the field potential duration (> 2 sec) and increased the time to the peak of both the early (Fig. 2c, inset) and the late phases of the field potential (Fig. 2c) although the effects on amplitude varied between slices. The individual CFP and Venus signals for all manipulations are shown (Fig. 2d) and indicate that changes in FY/FC ratio are caused by changes in FRET efficiency (i.e. increased CFP and decreased Venus signal). Using this protocol all slices had a detectable change in FRET sensor signal and each stimulation caused a similar FRET sensor response (5/5 trials per slice per manipulation), although there was variability in the amplitude and activation pattern between slices.
Evoked glutamate release is not detectable using FLII81E - 10μ
In order to estimate the amount of glutamate released in the slice, we repeated the experiments performed with FLII81E - 1μ, using FLII81E - 10μ a glutamate sensor with a 10-fold lower affinity. The cortical field potentials recorded using FLII81E - 10μ were similar to previous experiments, as were the effects of GABAzine and TBOA (Fig. 3a, b, c). No change in FLII81E - 10μ fluorescence ratio was seen for any of the manipulations tested (Fig. 3a, b, c). In order to confirm that this FRET sensor was functional, we locally perfused 10 mM glutamate onto slices loaded with FLII81E - 10μ (Fig. 3d), which caused a decrease in the Venus/CFP fluorescence ratio. Thus, although FLII81E - 10μM did not detect evoked glutamate release under the conditions tested it was fully functional in its ability to detect glutamate at higher concentrations.
Figure 3. Low-affinity FLII81E - 1μ glutamate sensor imaging.
Glutamate imaging with simultaneous cortical field recording under (a) control conditions, (b) in the presence of 10 μM GABAzine, and (c) in the presence of 10 μM GABAzine + 25 μM TBOA. (a, b, & c) (top, left) Bright field image of the cortical slice. Experimental layout is the same as in Figure 2. (top, right) Three individual glutamate FRET sensor images from ≈200 ms before stimulation (left), ≈80 ms after stimulation (center), and ≈1 s after stimulation (right). (center) Evoked cortical field recordings performed simultaneously with glutamate images. Dot indicates time of stimulation. (bottom) Normalized ROI analysis of glutamate FRET sensor images. (d). Local application of 10 mM glutamate induces large fluorescence ratio response.
Glutamate transients and cortical field potentials show parallel increase in amplitude and duration during disinhibition
We next examined the changes in excitability and glutamate release that occurred during the wash-in of GABAzine. Soon after the local perfusion was begun (within 30 seconds) the first FLII81E - 1μ images captured showed a detectable, but relatively small and localized glutamate transient (Fig. 4c, d). The simultaneously recorded evoked cortical field was also relatively small and brief (Fig. 4b). As excitability progressively increased with prolonged exposure to GABAzine, glutamate transients grew larger in amplitude and duration. Interestingly, as the glutamate transients grew the spatial spread of glutamate FRET sensor signal grew in concert, moving to areas distant from the stimulation electrode. In many trials, cortical layer 4 appeared to have a smaller change in FRET sensor fluorescence ratio compared to layers 2/3, 5 and 6 (Fig. 4c). Similar to glutamate transients, cortical field potentials grew progressively larger in amplitude and longer in duration during the wash-in of GABAzine (Fig. 4b). Based on these results, changes in field potentials and glutamate transients were correlated. It appears that as inhibition was progressively blocked more glutamate was released with each stimulation and a larger network of neurons became activated (Fig. 4c).
Figure 4. FLII81E - 1μ glutamate sensor imaging of a cortical slice during the wash-in of a GABAA receptor antagonist.

(a) Bright field image of the cortical slice. Scale Bar = 250 μM. (b) Evoked cortical field recordings made 30 sec (black), 40 sec (red), 50 sec (green), 60 sec (dark blue), and 70 sec (light blue) after wash-in of 10 μM GABAzine. Time of stimulation is denoted by the black dot. (c) Individual FLII81E - 1μ glutamate sensor images of the slice shown in (a) taken during the wash-in of GABAzine. 5 exposures (top to bottom), were collected every 10 seconds beginning 30 seconds after the wash-in of GABAzine. Each row of images consists of two frames captured before stimulation and 8 frames captured following stimulation. There is approximately 50 ms between each image. Time of stimulation is denoted by the black dot between 2nd and 3rd frames in each row. Time labels are color coded as in (b). (d) Fluorescence ratio analysis of a region of interest centered near the site of stimulation. Traces are color coded with respect to time after GABAzine wash-in as in (b) and (c). Time of stimulation indicated by black dot.
Spatiotemporal properties FLII81E - 1μ glutamate FRET sensor during full field imaging
A major goal of FLII81E - 1μ glutamate imaging was to increase the spatial and temporal resolution of glutamate detection in slices. As a proof of principle of increased resolution individual images were analyzed to confirm that regional and temporal differences were resolvable. We focused on images captured in the presence of GABAzine or GABAzine + TBOA in order to see large changes in FLII81E - 1μ fluorescence ratio. In many instances, images captured less than 30 ms following stimulation had sub-maximal changes in FLII81E - 1μ fluorescence ratio. These images reflected the earliest phase of glutamate transients, before activation of the entire cortical network has reached its maximum. During these early time-points, regional activation of the cortex was often seen (Fig. 5a). In the presence of GABAzine, if an early phase response was captured (early phase activation captured in 12/23 trials) it occurred on average 17.7 ± 5.4 ms after stimulation. In the presence of TBOA, however, early phase responses (early phase activation captured in 12/25 trials) occurred later - 51.1 ± 8.8 ms after stimulation (p<0.01 compared to GABAzine). These results suggests a slower onset or later peak of the FLII81E - 1μ signal in the absence of functional glutamate reuptake, though our ability to resolve temporal changes on this time scale is limited by the relatively slow (≈17 Hz) image capture rate. In one particularly interesting series of three exposures, the inherent jitter in the image acquisition time allowed us to sample a series of time-points close the stimulation time (Fig. 5b). When the image capture occurred very close to the time of stimulation (<15 ms, Fig. 5b top) the glutamate transient was small. Images captured slightly later (20 ms after stimulation, Fig. 5b middle, and 36 ms after stimulation, Fig. 5b bottom) had progressively larger amplitude changes in FLII81E - 1μ fluorescence ratio. Although this was a fortuitous example, this result demonstrates the ability of FLII81E - 1μ glutamate sensor imaging to discriminate small changes in glutamate transients on a tens-of-millisecond time scale during full-field image acquisition.
Figure 5. Spatioltemporal properties FLII81E - 1μ glutamate sensor during full field imaging.

(a, left) Bright field image of the cortical slice. Scale Bar = 250 μM for all images. (right) FLII81E - 1μ glutamate sensor images taken 58 ms before stimulation, 25 ms after stimulation, and 98 ms stimulation in the presence of 10 μM GABAzine. A single column of cortex is initially activated followed by recruitment of a larger network. (b, left) Bright field image of the cortical slice as in (a). (right) FLII81E - 1μ glutamate sensor images taken immediately before (left) and after (center and right) three successive electrical stimuli (10 μM GABAzine and 25 μM TBOA). Times of exact frame capture relative to electrical stimulation are noted above each image. Due to slight jitter in the image capture time, different time points during the onset of glutamate release can be seen.
High-speed (50 Hz) line scan imaging of FLII81E - 1μ glutamate sensor imaging
In order in improve the time-resolution of glutamate FRET sensor imaging, a series of experiments were performed using line-scan image acquisition and simultaneous field recordings. 32 pixel line-scans were collected and binned vertically to decrease image processing time (Fig. 6a, dotted area). This allowed image acquisition up to 50 Hz and enabled us to consistently resolve the temporal properties of glutamate transients on a tens-of-millisecond time-scale. Line-scan imaging and ROI analysis of deep (4-6) cortical layers revealed that electrical stimulation caused a transient decrease in FLII81E - 1μ fluorescence ratio under control conditions (Fig. 6c, -0.7 ± 0.1 % peak Δ FY/FC, 44.4 ± 6.8 ms peak time, 146.0 ± 10.6 ms half-width, n=20). Cortical field potentials were small and brief, corresponding to the measured glutamate transients. Excitability was then increased by blockade of GABAA receptors. In a disinhibited cortical slice, glutamate transients had a fast onset, but later peak, and were larger in amplitude (Fig. 6c, -8.3 ± 0.4% peak Δ FY/FC, 173.1 ± 16.7 ms peak time, 417.3 ± 12.0 ms half-width, p<0.01 compared to control for all measures, n=20). The increase in time resolution gained using line-scans revealed small, fast fluctuations in the fluorescence ratio at the peak and during the recovery of the glutamate transient (Fig. 6c) suggesting multiple glutamate release events. Next, glutamate transporters were blocked (fast fluctuations occurred in 15/20 stimulus-induced glutamate transients). Blockade of glutamate transporters again decreased the baseline FLII81E - 1μ ratio, indicating gradual extracellular accumulation of glutamate in the absence of functional glutamate reuptake. Under these conditions stimulation caused a larger amplitude (Fig. 6c, -11.0 ± 0.4% peak Δ FY/FC, p<0.01, n=20), longer duration (685.3 ± 22.9 ms half-width, p<0.01) decrease in the FLII81E - 1μ fluorescence ratio which peaked later (206.2 ± 11.3 ms, n=20, p<0.05) compared to GABAzine alone. The later peak of glutamate transient was consistent with the result obtained by whole-field scan experiments (Fig. 5). ROI analysis of each cortical layer was then performed on these images to detect layer specific glutamate transients (Fig. 6d and e). Under control conditions, the greatest change in FLII81E - 1μ fluorescence ratio was seen in layers, 4, and 6 (Fig. 6e, left, designation of cortical layers is approximate). When GABAA receptors were blocked the amplitude and duration of the glutamate transient was larger and longer in duration in all cortical layers. Blockade of glutamate transporters further prolonged the glutamate transient and increased the maximum glutamate transient amplitude. Cortical field potentials were similar to previously reported results for all pharmacological manipulations tested (Fig. 6b). These results show that line scan imaging of FLII81E - 1μ fluorescence allows for higher sampling rates and greatly increases the temporal resolution of this technique.
Figure 6. High-speed (50 Hz) line scan imaging of FLII81E - 1μ glutamate sensor imaging.

(a) Bright field image of the cortical slice. Dashed lines indicate the area of tissue imaged in (c) and (e). Scale bar = 250 μM. (b) Cortical field recording under control conditions (black), in the presence of 10 μM GABAzine (grey), and in the presence of 10 μM GABAzine + 25 μM TBOA (red). Time of stimulation is denoted by the black dot. (c) 50 Hz line-scan imaging of cortical layers under the same conditions. Values are normalized fluorescence ratio taken from an ROI containing cortical layers 4, 5, and 6. (d) Expanded view of dashed area in (a) with color-coded ROIs containing the 6 cortical layers. (e) Contour plots of each color-coded ROI shown in (d) during control conditions (left), and in the presence of GABAzine (center) and GABAzine + TBOA (right). Stimulation occurred at time = 0.
Calibration of glutamate FRET sensors
Ideally the changes in glutamate FRET sensor fluorescence ratio could be directly converted into changes in glutamate concentration. With this goal in mind a series of glutamate concentrations ranging from 10 μM to 30 mM were applied to slices loaded with FLII81E - 1μ. Surprisingly, the apparent affinity of the FLII81E - 1μ for glutamate was approximately 5 mM under these conditions. Very little change in the fluorescence ratio was seen with concentrations less than 1 mM (Fig. 7a), while Increasing the applied glutamate concentration from 1 mM to 10 mM caused a drastic decrease in FLII81E - 1μ fluorescence ratio indicating a threshold effect. These results were at odds with the previously reported affinity of FLII81E - 1μ for glutamate in free solution (1 μM) (Deuschle, Okumoto, Fehr, Looger, Kozhukh, and Frommer, 2005). We obtained a standard curve for FLII81E - 1μ in aCSF in vitro and confirmed that the EC50 was similar to previous reports (Fig. 7b, 250 nM). We conclude, therefore, that either the glutamate FRET sensor properties are altered in the extracellular milieu of the brain slice or the glutamate levels within the slice do not reach equilibrium with the applied solution.
Figure 7. Calibration of FLII81E - 1μ glutamate sensor.

(a) A series of glutamate concentrations were applied exogenously to a slice loaded with FLII81E -1μ using local perfusion. This series of glutamate concentrations was applied to different slices both in the presence of (circles, dotted line) and in absence of (squares, solid line) of the glutamate transporter inhibitor TBOA (25 μM). Fluorescence ratios were normalized to their value before exogenous glutamate was applied. (b) FLII81E - 1μ protein was also calibrated in aCSF using a spectrophotometer to measure fluorescence. FRET values were normalized to a baseline with no exogenous glutamate present.
Two factors might limit our ability to deliver a known concentration of glutamate to the slice: re-uptake of applied glutamate and incomplete penetration of applied glutamate throughout the thickness of the slice. To address the first concern we inhibited glutamate transporters and repeated the glutamate calibration. When glutamate reuptake was pharmacologically inhibited, the apparent affinity of the FRET sensor protein increased to 250 μM and as little as 10 μM was able to induce detectable FRET changes (Fig. 7a). Under these conditions, the concentration response curve was fit well by a sigmoidal line and no threshold effect was seen. These results suggest that the capacity for glutamate reuptake is substantial and is capable of buffering applied glutamate concentrations up to 1 mM. The residual difference in apparent affinity of the sensor might result from either incomplete block of EAATS or of other pathways that actively sequester extracellular glutamate.
4. Discussion
Synaptic release of glutamate, the primary central excitatory neurotransmitter, is a major determinant of neuronal activity in the vertebrate nervous system (Cotman and Monaghan, 1986). The ability to simultaneously measure glutamate release with higher temporal and spatial resolution is critical to answering many basic questions about glutamate: What is the precise timing of glutamate release and reuptake? Do regional differences in the glutamate signal exist in different brain regions? How do changes in the basic kinetics of glutamate release correlate with changes in synaptic transmission and network excitability? We have previously demonstrated that stimulation-induced glutamate release can be detected using the FLIPE glutamate sensors targeted to the cell surface of cultured neurons (Okumoto, Looger, Micheva, Reimer, Smith, and Frommer, 2005). While this offers a proof of concept for the method, the biological significance of imaging glutamate in cell culture is limited. To further develop this technology, we sought to establish the use of the high-affinity FRET sensor FLII81E - 1μ in an intact mammalian brain slice preparation.
Here we demonstrate a surprisingly simple loading protocol that results in uniform FRET sensor distribution within the slice which is stable for at least tens of minutes. Simply incubating the slice in a medium containing a high concentration of the FRET sensor led to permeation of the large protein (88 kD) throughout the tissue (Fig. 1). The FRET sensor did not alter the basic physiology of the network, and did not wash out of the slice even after prolonged periods of perfusion with aCSF. Photobleaching also had minimal effect on the FRET sensor ratio within the first 30 minutes of imaging. The ease with which the glutamate FRET sensor can be loaded into slices (i.e. no requirement for tranfection, infection, or specific localization tag) and the stability of the sensor in the tissue is a major advance in the use of FRET-based glutamate sensors. This technique allows real-time semi-quantitative FRET-based glutamate imaging in an intact cortical brain slice with spatio-temporal resolution capable of imaging synaptic glutamate transients. The ability to use FRET-based glutamate sensor imaging in live brain slices is the next logical step in utilizing glutamate sensors and is a critical step forward in understanding the synaptic output of neuronal networks.
Using glutamate FRET sensor imaging in cortical slices we found that under control conditions glutamate signals were brief, small in amplitude, and localized near the site of stimulation (Fig. 2a). Blocking inhibition led to a larger change in the FRET sensor fluorescence response and propagation over greater areas (Fig. 2b). Blocking reuptake of glutamate prolonged the duration of fluorescence ratio change and significantly increased the time to the peak glutamate level (Fig. 2c). Both these pharmacological manipulations caused changes in evoked-cortical field potentials that corresponded to changes seen in glutamate transients. Fast excitatory postsynaptic potentials reach a maximum within 10-20 ms but our full-frame imaging only allows image collection every 50 ms. In order to achieve better temporal resolution, high-speed line scan imaging was performed using the high-affinity glutamate FRET sensor. Although the increase in temporal resolution was offset by a decrease in spatial sampling, this form of glutamate FRET sensor imaging was especially useful for kinetic analysis of glutamate transients. Using line scan imaging we were able to collect multiple images during the rising phase of the glutamate transient and resolve small fluctuations in glutamate transients (Fig. 6). We also found that glutamate transients peaked later following blockade of active glutamate transport, suggesting that glutamate transporters removed extracellular glutamate before the glutamate transient reached its potential maximum peak. In the absence of reuptake, glutamate transients continued to grow in size for a longer duration and therefore reached a higher peak later in time.
The lower affinity glutamate FRET sensor, FLII81E - 10μ was unable to detect glutamate transients (Fig. 3). The lack of change in the low-affinity FRET sensor fluorescence ratio was most likely due to glutamate transients which were of insufficient concentration or were too brief to be captured by our imaging system. These negative results suggest, however, that changes in the FY/FC ratio observed are specific to changes in glutamate levels and not to non-specific changes that occur during evoked neurotransmission in the cortex (changes in pH, optical properties of the slice, or the state of endogenously fluorescent molecules).
In addition to confirming the feasibility of measuring glutamate in intact tissue, our preliminary studies demonstrated a number of interesting phenomena. The first is unique spatial patterns of glutamate release (Figs 2, 4, 5, & 6). While multi-array electrodes have demonstrated spatial patterns of neuronal electrical activity in slices, the approach is limited by the spacing of the electrodes. With the FRET sensor, the resolution is only limited by the objective used, pixel size, and the extent of pixel-binning necessary to provide adequate signal to noise ratios. The experiments presented here were performed using a 2.5X objective which results in each pixel representing 10 μm by 10 μm square. With this level of resolution we were clearly able to detect spatially restricted patterns of glutamate release. Furthermore, layer specific changes in glutamate were seen during disinhibition, for both full frame and line-scan imaging. This is in agreement with known layer specific axonal projections found in the cortex (Vogt, Rosene et al., 1981). Understanding layer-specific glutamate transients may help in elucidating the mechanism of cortical network activation and how that mechanism may be altered in pathological states such as epilepsy (Jin, Prince, and Huguenard, 2006).
Another interesting finding came from our attempts to determine whether the sensitivity of the sensor in the slice correlated with that in solution. To our surprise, the FRET sensor seemed markedly less sensitive in the slice - addition of millimolar concentrations of glutamate was necessary to detect a change in FRET sensor fluorescence ratio. A number of factors could explain this - the local environment of the slice (e.g. pH and ionic composition) may alter the sensitivity (Miesenbock, De Angelis et al., 1998), the glutamate may only reach FRET sensor in the most superficial portion of the slice, optical properties of the slice could interfere with the excitation of the FRET sensor or the detection of the fluorescent light, or extracellular glutamate levels may be regulated by endogenous mechanisms such membrane transporters (Gueler, Kukley et al., 2007). Indeed, blocking glutamate uptake with TBOA markedly altered the fluorescence ratio response to exogenously applied glutamate, indicating that high capacity glutamate transporters efficiently remove applied glutamate at concentrations up to ≈1 mM. Notably, with glutamate transport compromised, the FRET sensor’s apparent affinity for glutamate was still 250 fold lower than in free solution. In these experiments, it was necessary to use a sub-maximal concentration of TBOA to avoid spreading depression and depolarization block. Presumably residual transport occurs by TBOA-sensitive and/or insensitive transporters, limiting our ability to directly convert fluorescence ratio changes into precise glutamate concentrations with exogenously applied glutamate. Thus at this point glutamate FRET sensor usage in slices remains semi-quantitative. Finally, TBOA application caused a decrease in the baseline FRET sensor fluorescence ratio, suggesting that glutamate transporters are responsible for continual uptake of glutamate and keeping baseline glutamate concentrations low.
Although our understanding of glutamatergic neurotransmission has increased dramatically in the last several years, studies of the spatial and kinetic properties of glutamate release have been restricted, primarily due to inherent limitations in the methods for detection of the amino acid. Glutamate-selective electrodes sample only the area in the immediate vicinity of the electrode, greatly limiting their spatial resolution and their temporal resolution is quite low (on the scale of seconds) (Hu, Mitchell, Albahadily, Michaelis, and Wilson, 1994;Oldenziel, Dijkstra, Cremers, and Westerink, 2006). Furthermore enzymatic biosensors are subject to non-specific changes caused by oxygen saturation (Hu, Mitchell, Albahadily, Michaelis, and Wilson, 1994) and pH changes (Dulla, Dobelis et al., 2005). Microdialysis/HPLC analysis has extremely limited spatial resolution; dialyzed samples come only from the area in the immediate proximity of the dialysis tubing. Their temporal resolution is also quite low (minutes time scale) because of the technical limitations in collecting dialysis samples for each time point (Zhang, Takeda, Hagioka, Takata, Aoe, Nakatsuka, Yokoyama, and Morita, 2005). Enzyme-linked fluorescence assays have increased spatial resolution compared to glutamate-selective electrodes but their temporal resolution is still less than ideal due to the use of enzymatic reactions to detect glutamate (Nicholls and Sihra, 1986;Innocenti, Parpura, and Haydon, 2000). Lastly, electrical recording from cells expressing glutamate receptors offer very high temporal resolution (millisecond scale) but because this is a cell-based technique it has very limited spatial resolution. Furthermore, delivering cells to the site of interest or accessing endogenous cells is a difficult and time consuming strategy for routine detection of glutamate. This type of glutamate assay is also limited by the properties of the glutamate receptor used, which can limit the duration and concentration of glutamate which can be detected (Diamond, Bergles, and Jahr, 1998). An alternative technology for imaging glutamate was recently developed based on a portion of the GluR2 subunit linked with a small molecule fluorescent dye (Namiki, Sakamoto, Iinuma, Iino, and Hirose, 2007). This technique also shows promise for increased spatiotemporal detection of glutamate, but has some limitations compared to the FRET sensors discussed here. First, the GluR2 sensor protein must be linked to biotin coated neurons which may make the delivery of sensor protein into brain slices challenging. Second, the temporal resolution demonstrated is significantly less (10 Hz) than we have been able to attain. Our technology is also imperfect. While the FRET sensor was present throughout the slice, our images were collected with the surface plane of the slice in focus. Given the depth of field of the objective, we suspect that we are only obtaining fluorescent light from 40 to 50 μm closest to the surface of the slice. Confocal and 2-photon microscopy may allow more precise spatial discrimination of neuronal structure (i.e. synaptic vs. extrasynaptic areas). Calibration of the glutamate FRET sensor has also proved difficult, although calibration of any biological sensor in situ can be compromised to due the complex environment of brain tissue and complicating factors such as endogenous reuptake of the molecule of interest. Lastly, as with any imaging technique which uses a binding-based detection method, the presence of FRET sensor protein may alter endogenous glutamate transients. We believe this is unlikely, however, as cortical field potentials are not altered by the presence of the FRET sensor protein. Based on our current findings, and the ease with which they can be loaded into brain slices, we consider FRET-based glutamate sensors the most promising technology for understanding extracellular glutamate transients and synaptic network activation.
Our novel approach for sensing neuronal activity in an intact cortical slice demonstrates the utility of FRET sensors even in tissue as complex as the mammalian brain. In this initial study we have demonstrated the feasibility and applicability of the glutamate FRET sensor imaging in intact tissue. This technique could provide complimentary data to other techniques for monitoring network activation such as voltage-sensitive dyes(Grinvald and Hildesheim, 2004) and multi-electrode arrays (Buzsaki, 2004). High-power magnification and increased imaging speed will help resolve the kinetics and spatio-temporal patterns of glutamate release in smaller synaptic structures as well as on a network level. Furthermore, the molecular nature of these sensors will facilitate development of targeted sensors and transgenic animals permitting a further understanding of neuronal network activity in vertebrate brain.
Acknowledgments
We would like to thank Isabel Parada for assistance in sectioning and immunohistochemistry; Carl Pisaturo for electronics design assistance. This work was supported by NIH (R33DK070272, NS045634, NS12151 & NS0728), The Thomas Dower Foundation, and a Dana Foundation Brain Immuno-imaging grant.
Footnotes
Publisher's Disclaimer: This is a PDF file of an unedited manuscript that has been accepted for publication. As a service to our customers we are providing this early version of the manuscript. The manuscript will undergo copyediting, typesetting, and review of the resulting proof before it is published in its final citable form. Please note that during the production process errors may be discovered which could affect the content, and all legal disclaimers that apply to the journal pertain.
5. References
- Auger C, Attwell D. Fast removal of synaptic glutamate by postsynaptic transporters. Neuron. 2000;28:547–58. doi: 10.1016/s0896-6273(00)00132-x. [DOI] [PubMed] [Google Scholar]
- Brasnjo G, Otis TS. Isolation of glutamate transport-coupled charge flux and estimation of glutamate uptake at the climbing fiber-Purkinje cell synapse. Proc.Natl.Acad.Sci.U.S.A. 2004;101:6273–8. doi: 10.1073/pnas.0308149101. [DOI] [PMC free article] [PubMed] [Google Scholar]
- Buzsaki G. Large-scale recording of neuronal ensembles. Nat Neurosci. 2004;7:446–51. doi: 10.1038/nn1233. [DOI] [PubMed] [Google Scholar]
- Cotman CW, Monaghan DT. Anatomical organization of excitatory amino acid receptors and their properties. Adv Exp.Med.Biol. 1986;203:237–52. doi: 10.1007/978-1-4684-7971-3_18. [DOI] [PubMed] [Google Scholar]
- Dalva MB, Katz LC. Rearrangements of synaptic connections in visual cortex revealed by laser photostimulation. Science. 1994;265:255–8. doi: 10.1126/science.7912852. [DOI] [PubMed] [Google Scholar]
- De Belleroche JS, Bradford HF. On the site of origin of transmitter amino acids released by depolarization of nerve terminals in vitro. J Neurochem. 1977;29:335–43. doi: 10.1111/j.1471-4159.1977.tb09627.x. [DOI] [PubMed] [Google Scholar]
- Deuschle K, Fehr M, Hilpert M, Lager I, Lalonde S, Looger LL, Okumoto S, Persson J, Schmidt A, Frommer WB. Genetically encoded sensors for metabolites. Cytometry A. 2005;64:3–9. doi: 10.1002/cyto.a.20119. [DOI] [PMC free article] [PubMed] [Google Scholar]
- Deuschle K, Okumoto S, Fehr M, Looger LL, Kozhukh L, Frommer WB. Construction and optimization of a family of genetically encoded metabolite sensors by semirational protein engineering. Protein Sci. 2005;14:2304–14. doi: 10.1110/ps.051508105. [DOI] [PMC free article] [PubMed] [Google Scholar]
- Diamond JS. Neuronal glutamate transporters limit activation of NMDA receptors by neurotransmitter spillover on CA1 pyramidal cells. J Neurosci. 2001;21:8328–38. doi: 10.1523/JNEUROSCI.21-21-08328.2001. [DOI] [PMC free article] [PubMed] [Google Scholar]
- Diamond JS. Deriving the glutamate clearance time course from transporter currents in CA1 hippocampal astrocytes: transmitter uptake gets faster during development. J Neurosci. 2005;25:2906–16. doi: 10.1523/JNEUROSCI.5125-04.2005. [DOI] [PMC free article] [PubMed] [Google Scholar]
- Diamond JS, Bergles DE, Jahr CE. Glutamate release monitored with astrocyte transporter currents during LTP. Neuron. 1998;21:425–33. doi: 10.1016/s0896-6273(00)80551-6. [DOI] [PubMed] [Google Scholar]
- Dulla CG, Dobelis P, Pearson T, Frenguelli BG, Staley KJ, Masino SA. Adenosine and ATP link PCO2 to cortical excitability via pH. Neuron. 2005;48:1011–23. doi: 10.1016/j.neuron.2005.11.009. [DOI] [PMC free article] [PubMed] [Google Scholar]
- Fellin T, Pascual O, Gobbo S, Pozzan T, Haydon PG, Carmignoto G. Neuronal synchrony mediated by astrocytic glutamate through activation of extrasynaptic NMDA receptors. Neuron. 2004;43:729–43. doi: 10.1016/j.neuron.2004.08.011. [DOI] [PubMed] [Google Scholar]
- Grinvald A, Hildesheim R. VSDI: a new era in functional imaging of cortical dynamics. Nat Rev Neurosci. 2004;5:874–85. doi: 10.1038/nrn1536. [DOI] [PubMed] [Google Scholar]
- Gueler N, Kukley M, Dietrich D. TBOA-sensitive uptake limits glutamate penetration into brain slices to a few micrometers. Neurosci Lett. 2007;419:269–72. doi: 10.1016/j.neulet.2007.04.035. [DOI] [PubMed] [Google Scholar]
- Hu Y, Mitchell KM, Albahadily FN, Michaelis EK, Wilson GS. Direct measurement of glutamate release in the brain using a dual enzyme-based electrochemical sensor. Brain Res. 1994;659:117–25. doi: 10.1016/0006-8993(94)90870-2. [DOI] [PubMed] [Google Scholar]
- Innocenti B, Parpura V, Haydon PG. Imaging extracellular waves of glutamate during calcium signaling in cultured astrocytes. J Neurosci. 2000;20:1800–8. doi: 10.1523/JNEUROSCI.20-05-01800.2000. [DOI] [PMC free article] [PubMed] [Google Scholar]
- Jin X, Prince DA, Huguenard JR. Enhanced excitatory synaptic connectivity in layer v pyramidal neurons of chronically injured epileptogenic neocortex in rats. J Neurosci. 2006;26:4891–900. doi: 10.1523/JNEUROSCI.4361-05.2006. [DOI] [PMC free article] [PubMed] [Google Scholar]
- Kirvell SL, Esiri M, Francis PT. Down-regulation of vesicular glutamate transporters precedes cell loss and pathology in Alzheimer’s disease. J Neurochem. 2006;98:939–50. doi: 10.1111/j.1471-4159.2006.03935.x. [DOI] [PubMed] [Google Scholar]
- Miesenbock G, De Angelis DA, Rothman JE. Visualizing secretion and synaptic transmission with pH-sensitive green fluorescent proteins. Nature. 1998;394:192–5. doi: 10.1038/28190. [DOI] [PubMed] [Google Scholar]
- Miyawaki A. Green fluorescent protein-like proteins in reef Anthozoa animals. Cell Struct.Funct. 2002;27:343–7. doi: 10.1247/csf.27.343. [DOI] [PubMed] [Google Scholar]
- Moore RY. Principles of synaptic transmission. Ann.N.Y.Acad.Sci. 1993;695:1–9. doi: 10.1111/j.1749-6632.1993.tb23018.x. [DOI] [PubMed] [Google Scholar]
- Namiki S, Sakamoto H, Iinuma S, Iino M, Hirose K. Optical glutamate sensor for spatiotemporal analysis of synaptic transmission. Eur.J Neurosci. 2007;25:2249–59. doi: 10.1111/j.1460-9568.2007.05511.x. [DOI] [PubMed] [Google Scholar]
- Nicholls DG, Sihra TS. Synaptosomes possess an exocytotic pool of glutamate. Nature. 1986;321:772–3. doi: 10.1038/321772a0. [DOI] [PubMed] [Google Scholar]
- Okumoto S, Looger LL, Micheva KD, Reimer RJ, Smith SJ, Frommer WB. Detection of glutamate release from neurons by genetically encoded surface-displayed FRET nanosensors. Proc.Natl.Acad.Sci.U.S.A. 2005;102:8740–5. doi: 10.1073/pnas.0503274102. [DOI] [PMC free article] [PubMed] [Google Scholar]
- Oldenziel WH, Dijkstra G, Cremers TI, Westerink BH. In vivo monitoring of extracellular glutamate in the brain with a microsensor. Brain Res. 2006;1118:34–42. doi: 10.1016/j.brainres.2006.08.015. [DOI] [PubMed] [Google Scholar]
- Rothman SM. Synaptic activity mediates death of hypoxic neurons. Science. 1983;220:536–7. doi: 10.1126/science.6836300. [DOI] [PubMed] [Google Scholar]
- Sepkuty JP, Cohen AS, Eccles C, Rafiq A, Behar K, Ganel R, Coulter DA, Rothstein JD. A neuronal glutamate transporter contributes to neurotransmitter GABA synthesis and epilepsy. J Neurosci. 2002;22:6372–9. doi: 10.1523/JNEUROSCI.22-15-06372.2002. [DOI] [PMC free article] [PubMed] [Google Scholar]
- Shepherd GM, Pologruto TA, Svoboda K. Circuit analysis of experience-dependent plasticity in the developing rat barrel cortex. Neuron. 2003;38:277–89. doi: 10.1016/s0896-6273(03)00152-1. [DOI] [PubMed] [Google Scholar]
- Staley KJ, Longacher M, Bains JS, Yee A. Presynaptic modulation of CA3 network activity. Nat Neurosci. 1998;1:201–9. doi: 10.1038/651. [DOI] [PubMed] [Google Scholar]
- Vogt BA, Rosene DL, Peters A. Synaptic termination of thalamic and callosal afferents in cingulate cortex of the rat. J Comp Neurol. 1981;201:265–83. doi: 10.1002/cne.902010210. [DOI] [PubMed] [Google Scholar]
- Yang J, Woodhall GL, Jones RS. Tonic facilitation of glutamate release by presynaptic NR2B-containing NMDA receptors is increased in the entorhinal cortex of chronically epileptic rats. J Neurosci. 2006;26:406–10. doi: 10.1523/JNEUROSCI.4413-05.2006. [DOI] [PMC free article] [PubMed] [Google Scholar]
- Zhang S, Takeda Y, Hagioka S, Takata K, Aoe H, Nakatsuka H, Yokoyama M, Morita K. Measurement of GABA and glutamate in vivo levels with high sensitivity and frequency. Brain Res Brain Res Protoc. 2005;14:61–6. doi: 10.1016/j.brainresprot.2004.03.005. [DOI] [PubMed] [Google Scholar]