Abstract
The relation between autophagy and apoptosis has not been clearly elucidated. Here, we reported that apoptosis followed autophagy in insect Spodoptera litura cells (Sl) undergoing glucose starvation. Sl cells have been adapted to Leibovitz-15 medium supplemented with glucose (1.0 g/l) and 5% fetal bovine serum (FBS), used for mammalian cell cultures. If glucose (1 g/l) or glutamine (1.6 g/l) had not been supplemented in L-15 medium with 5% FBS, Sl cells began to form many vacuoles and these vacuoles gradually enlarged in the cytoplasm, which were autophagic vacuoles. However, these large vacuoles began to disappear gradually after 48 h of glucose starvation, accompanied with remarkable apoptosis without apoptotic bodies, which was demonstrated by DNA fragmentation and activation of caspase-3-like. During glucose starvation, Sl cell ATP concentrations gradually decreased. Interestingly, if the conditioned L-15 medium without glucose was replaced with fresh L-15 medium supplemented with glucose or glutamine after the cultures had been starved seriously for 48 h or longer, the formation of apoptotic bodies was initiated. These data suggested that the partial depletion of cell ATP triggered apoptosis following autophagy in glucose-starved Sl cells and the formation of apoptotic bodies required higher level of ATP than DNA fragmentation and activation of caspase-3-like activity. Additionally, the disappearance of autophagic vacuoles, negative staining of neutral red, green staining of acridine orange and diffusion of acid phosphatase activity in Sl cells at the late stage of starvation (over 48 h) suggested that the dysfunction of lysosome was more likely to involve in apoptosis. The facts that Actinomycin D-induced apoptosis was partially inhibited and cyclosporin A, blocking the opening of mitochondrial permeability transition (MPT) pores, inhibited partially apoptosis in glucose-starved Sl cells, suggested the pathway of glucose starvation-induced apoptosis seemed to be different from that induced by actinomycin D and the opening of MPT pores on mitochondria probably involved in apoptosis triggered by glucose starvation, respectively.
Keywords: Spodopteralitura cell, Glucose starvation, Apoptosis, Autophagy, Lysosome, Mitochondrion
Introduction
Programmed cell death, important in normal animal physiology and disease, can be divided into at least two morphological subtypes, including type I, or apoptosis, and type II, or autophagic cell death. A number of agents are inducers of programmed cell death and some studies have recently shown that glucose (sucrose for plant cells) starvation resulted in autophagenic cell death or apoptotic cell death (Aubert et al. 1996; Aki et al. 2003; Lee et al. 1997). Glucose is a very important substrate of mitochondrion for ATP synthesis, and glucose starvation results in the decline of ATP. Aubert et al. (1996) reported that depletion of sucrose in medium induced in vitro plant cell autophagy. They observed that many autophagic vacuoles were formed in cytoplasm and phosphorylcholines steadily accumulated on cell membrane. Autophagic cell deaths induced by glucose starvation were also observed in vertebrate cells of H9c2 and MCF-7/ADR (Aki et al. 2003; Lee et al.1997). However, the morphologic changes and the apoptosis pathway in the starved cells showed by Lee et al. in MCF-7/ADR cells differed from that reported by other groups. In this apoptotic process, the cells after glucose deprivation blebbed and apoptotic bodies were formed. The DNA ladder was observed on agarose gel by electrophoresis, but vacuolization did not occur in cytoplasm. These results suggested that cell death caused by glucose starvation in different cell lines might go through different pathway(s), apoptotic or autophagic cell death.
To date, although the death pathways of vertebrate cells have been extensively studied, the research on the death pathway of insect cells was very limited. Our previous studies have shown that apoptosis was induced by a lot of factors and mitochondria were involved in apoptotic process in Spodoptera litura (Sl) insect cells (Xiu et al. 2005). The aim of the present study was to investigate the effects of glucose starvation on insect cell Sl and primarily elucidate the mechanism of the Sl cell death induced by glucose starvation. Our data showed that apoptosis without apoptotic bodies followed autophagy after glucose starvation. ATP was required during the formation of apoptotic bodies even if DNA has fragmented and caspase-3-like activity was activated, and the dysfunction of lysosome seemed to be involved in apoptosis. Finally, the apoptosis pathway induced by glucose starvation may be different from that induced by actinomycin D, and the opening of MPT pores on mitochondria is more likely to be involved in apoptosis induced by glucose starvation.
Materials and methods
Insect cell and reagents
S. litura insect cell line (Sl) was obtained from Institute of Entomology, Zhongshan University in China. Phenylmethyl sulfonyl fluoride (PMSF), RNase A, and proteinase K were purchased from Promega. Fluorogenic substrate AC-DEVD-AFC, Leibovitz-15 medium, and Cyclosporin A (CsA) were purchased from BD Biosciences (San Jose, CA), GIBCO and Sandoz, (Switzerland), respectively. All other chemicals were the products of Sigma Chemical Co. (St. Louis, MO).
Treatment of cells
Sl cells have been adapted to L-15-G (Leibovitz-15 medium + 5% FBS + 1 g/l glucose at pH 6.5) for more than 8 months and cell growth state was comparable to Sl cells cultured originally in Grace’s medium. All cell culture media contained 5% FBS in the present study. 5 mL of cell suspension (4 × 10⁵ cells/mL) was seeded in each flask (25 cm2) and incubated at 28 °C. To evaluate the effects of glucose starvation on the Sl cells, cells were treated in different ways as follows: (1), the cells were cultured in L-15 medium (without supplemented glucose) for 0, 36, 48, 54 and 60 h.; (2), after the glucose starvation for different times (0, 24, 48 h), Act D (1 μg/mL of final concentration) was added into the cultures and cultures were incubated for 12 h., followed by analysis of the caspase-3-like activity (see below); (3), the cells were cultured in L-15 medium in the presence of CsA (30 μM), caspase-3-like relative activity was assayed at different times, and the control cells were cultured in L-15 medium without supplemented glucose or glutamine; (4), Sl cells were cultured in L-15 media without supplemented glucose, with glutamine (1.6 g/l) or glucose (1 g/l) for 54 h, respectively, followed by the replacement of the media with L-15 medium with glucose (1 g/l). Further analytical tests were performed after the cells had been cultured in it for 4 h (see below).
DAPI staining
Nuclear morphology of the treated and control cells was examined by fluorescent microscopy after DAPI staining. Briefly, both starved and control cells were fixed with 3.7% (w/v) formalin at 4 °C, and followed by dehydrating with a series of ethanol gradients, then stained with DAPI for 30 min. The morphological changes of the nuclei of apoptotic cells were visualized by fluorescent microscopy.
Neutral red and acridine orange staining
To investigate autophagic vacuoles, neutral red staining and acridine orange staining were used. Briefly, the starved and control cells were stained with 1/3000 (w/v) neutral red at 28 °C for 2–15 min or stained with 4 μg/mL acridine orange at 28 °C for 30 min, and washed twice with PBS, then observed with optical and fluorescent microscopy, respectively.
Observation of electron microscopy
The starved (48 h) and control cells were harvested by centrifugation, the thin section samples for observation of transmission electron microscope (TEM) were prepared by using a standard method.
Identification of acid phosphatase (AcPase) activity in lysosome
Acid phosphatase is a marker enzyme of lysosome, and its activity in the starved and control cells was identified by the method of Gomori (1950) to investigate the characteristic of the vacuoles formed in the starved cells.
Measurement of caspase-3-like activity
Caspase-3-like activity was measured enzymatically using the fluorogenic peptide substrate DEVD.AFC. All samples were harvested by centrifugation at 12,000g for 10 min at 4 °C. The pellet was suspended in cell lysis buffer (50 mM Hepes-KOH, pH 7.5, 75 mM NaCl, 1 mM EDTA-Na2, 1 mM DTT, 1 mM PMSF, 0.1% Triton X-100) and incubated on ice for 30 min, and then centrifuged at 12,000g for 20 min at 4 °C. The supernatant was collected and the proteins were quantified using the BCA method. Caspase-3-like activities were determined by measuring the proteolytic cleavage of the fluorogenic substrates AC-DEVD-AFC. The reaction mixtures consisting of 25 μg of extracts and 3 μg DEVD.AFC in 250 μL assay buffer (50 mM Hepes-KOH, pH 7.5, 75 mM NaCl, 1 mM EDTA-Na2, 2 mM DTT, 0.5% chaps, 10% sucrose) were incubated at 37 °C for 60 min, and the reaction was terminated by dilution with 1 mL ice-cold assay buffer (pH7.5) and fluorescence at excitation 400 nm/emission 505 nm was measured by a spectrofluorimeter (Fluorescence 700 spectro-photometer F-4500, Hitachi, Japan). Caspase-3-like activity was expressed in relative fluorescent units per reaction.
DNA fragmentation assay
Cultured cells were collected by centrifugation at 12,000g for 10 min at 4 °C. The pellet was washed twice with PBS, and suspended in 750 μL TES (10 mM Tris-Cl, 1 mM EDTA, pH 8.0, 1%SDS) with 50 μg/mL proteinase K and incubated at 37 °C for 3 h. The DNA was extracted twice with an equal volume of phenol (saturated with 100 mMTris/HCl, pH 8)/chloroform/isoamyl alcohol (25:24:1), then once with chloroform alone. The extracted DNA was ethanol-precipitated and dissolved in TE buffer with RNAase, then incubated at 37 °C for 2 h. The DNA samples were analyzed electrophoretically on 1.5% agarose gel.
Assay of cell ATP content
Cell ATP content was determined by using a Hitachi F-4500 fluorescence spectrophotometer operated in bioluminescence mode and bioluminescence ATP assay kit (Biyuntian, China) by the luciferin–luciferase method according to the manufacturer’s instructions. Briefly, the cell cultures were treated with cell lysis solution of the kit for 5 min at 4 °C. After centrifugation at 12,000g for 10 min at 4 °C. 594 μL cell lysis solution, 600 μL substrate buffer solution and 6 ul luciferase/luciferin solution (lyophilized) were immediately mixed and transferred to a 1 × 1 cm quartz cuvette. Emission spectra were collected on a Hitachi F-4500 fluorescence spectrophotometer operated in the luminescence mode. Data shown corresponded to the average of five consecutive spectra collected within 2 min of substrate addition. PMT voltage, emission slit, delay time and integration time were set to 700 V, 20 nm, 2 s and 10 s, respectively. Units were calculated as bioluminescence intensity per milligram protein at 20 °C. A Standard curve for ATP assay was created using known concentrations of ATP standard solution.
Statistics and cell viability
All experiments were performed in triplicate and repeated at least three times. The data shown in the figures are representative experiments or mean values ±SD. Statistical differences were determined by Student’s t-test. A p value of <0.05 was considered significant. Cell viability was determined using trypan blue exclusion. Protein contents were determined using BCA protein assay kit (Biyuntian, China) according to the instruction.
Results
Glucose starvation resulted in autophagy
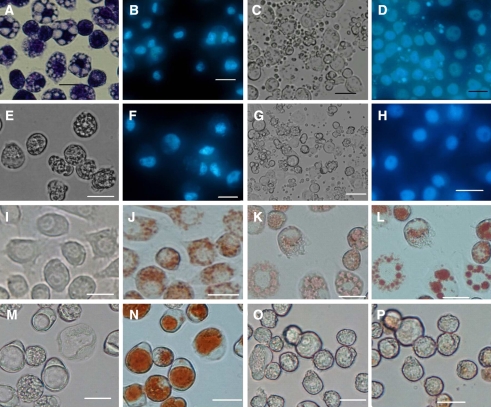
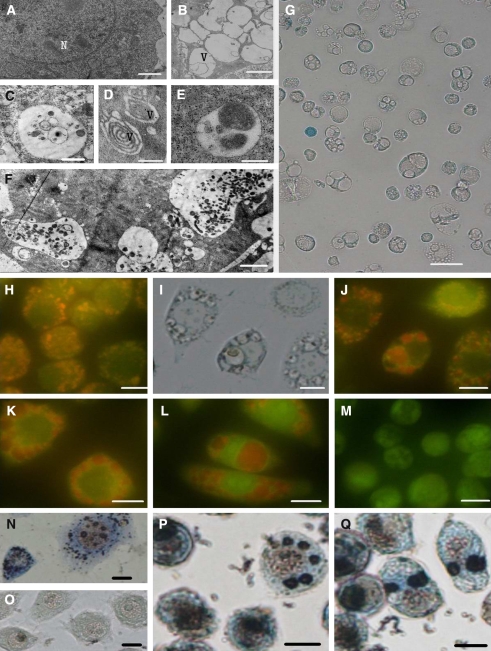
To investigate whether glucose starvation induces autophagy in insect cells, Sl cells were cultured in L-15 medium (without supplemented glucose) for 0, 36, 48 and 60 h, the starved cells were treated and observed as described in the materials and methods. After 24 h of glucose starvation, many small globular vacuoles were formed in cytoplasm and their sizes increased with the time of starvation. After 60 h of starvation, the cells became rounded and shrank, finally detached from the bottle of flasks and the large vacuoles disappeared (Fig.1A, E). The results of electron microscopy indicated that some of those vacuoles contained cell cytoplasm or damaged organells (Fig.2 A–F). Since these vacuoles became red and orange fluorescence when they were stained with neutral red and acridine orange, respectively, they possessed their nature of acidic compartments (Fig.1 J–N and Fig.2 H–L ). The staining of vacuoles by the method of Gomori used for the identification of acid phosphatase (a marker enzyme of lysosomes) showed the dark precipitates in the vacuoles, and the data suggested that these vacuoles were lysosomal-like structures (Fig.2 N–Q). All these data demonstrated that these vacuoles formed in glucose-starved Sl cells were autophagic vesicles.
Fig. 1.
Morphological changes of SL-1 cells after glucose deprivation. (A) and (B). SL-1 cells starved for 48 h and stained with Giemsa (A) or DAPI (B). (C) and (D). 12 h of recovery with glucose after 48 h of glucose starvation. Many apoptotic bodies were present. (E) and (F).60 h of glucose starvation. No apoptotic bodies were present. (G). 12 h of recovery after 60 h of glucose starvation. Many apoptotic bodies were present. (H). Control cells stained with DAPI, cultured in L-15 medium in the presence of glucose. (I). Control cells without staining. (J). Acid vacuoles (lysosome-like) in the control cells stained with neutral red for 15 min; (K). Acid vacuoles in the cells starved for 48 h and stained with neutral red for 2 min. (L). Acid vacuoles in the cells starved for 48 h and stained with neutral red for 15 min. (M). Vacuoles in the cells starved for 54 h. (N). Acid vacuoles in the cells starved for 54 h and stained with neutral red for 15 min. (O) and (P). The disappearance of large acid vacuoles in the cells starved for 60 h (O) and stained with neutral red for 15 min (P). Bar. 20 μm
Fig. 2.
Characterization of the vacuoles formed after glucose deprivation. (A). Control cells. Bar = 0.78 μm. (B)–(F). Vacuoles in the cytoplasm of Sl cells starved for 48 h. Many vacuoles contained cytoplasm or/and damaged organells. Bars in B, C, D, E and F were 0.78 μm ,0.47 μm, 0.63 μm, 0.34 μm and 0.34 μm, respectively. (G). The cells starved for 48 h. The cell membrane was intact according to the result of trypan blue staining. Bar = 35 μm. (H). Control cells. Lysosomes were stained with acridine orange. (I) Vacuoles (autophagic lysosome) in the cells starved for 48 h. (J)—(L). Autophagic lysosomes were stained with acridine orange. (M). The disappearance of autophagic lysosomes in the cells starved for 60 h. The cells were stained with acridine orange. (N) Positive acid phosphatase activity in the control cells. Lysosomes containing acid phosphatase were shown. (O). Negative acid phosphatase activity in the control cells treated for 30 min at 50°C. (P) and (Q) Autophagic lysosomes in the cells starved for 48 h. Acid phosphatases activity in vacuoles were positive. (H)–(Q). Bar = 10 μm
Apoptosis followed autophagy
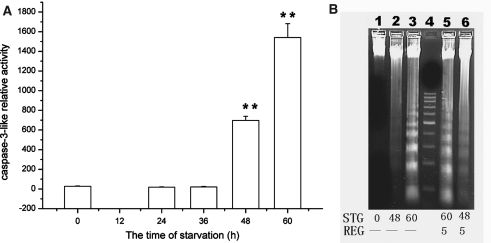
In the process of autophagic death, in general, no caspase-3 activation occurred. However, our results showed that caspase-3-like activity was detected in Sl cells after 48 h of glucose starvation. The caspase-3-like activity increased dramatically after 48 h starvation, and reached the same level at 60 h of starvation as those in the cells (cultured in L-15-G) induced by Act D (Fig. 3A and Fig. 5A). DNA fragmentation was observed (Fig.3B), but no apoptotic bodies were formed at 48 or 60 h of starvation (Fig. 1B and F). If L-15 medium in the presence of glucose was readded after the starvation, the autophagic vacuoles in the starved cells disappeared, no apoptotic bodies were formed at 36 h of starvation. But if starvation time was 48 h or longer, many apoptotic bodies occurred (Fig. 1C, D and G). Thus, apoptosis without apoptotic bodies followed autophagy in the severely glucose-starved Sl cells.
Fig. 3.
Activation of caspase-3-like activity and DNA degradation. (A) Activation of caspase-3-like activity after glucose deprivation. (B) Agarose gel runs of DNA. Lane 1, Control cells; lane 2, 48 h of glucose deprivation; lane 3, 60 h of glucose deprivation; lane 4, 200 bp DNA marker; lane 5, 5 h of recovery with glucose (1 g/l) after 60 h of glucose deprivation; lane 6, 5 h of recovery after 48 h of glucose deprivation. ** p < 0.01
Fig. 5.
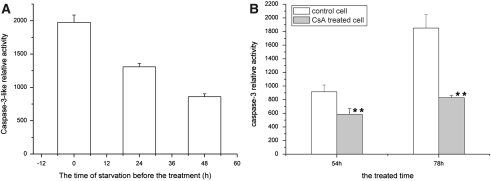
Assay of caspase-3-like activity. (A). Influences of glucose deprivation on caspase-3-like activity mainly induced by actinomycin D; the caspase-3-like activity in Sl cells induced by actinomycin D were shown in this figure and that without the induction of actinomycin D were shown in Fig. 3. (B). Influences of CsA on caspase-3-like activity induced by glucose deprivation. Control cells and CSA-treated cells were cultured in L-15 medium without glucose (1 g/l) in the absence and presence of CSA (30 μM), respectively. ** p < 0.01
Alteration of ATP concentration
Partial depletion of ATP induces cell apoptosis. To investigate whether the apoptosis in Sl cells undergoing glucose starvation was triggered by partial depletion of ATP, its concentrations in Sl cells starved for different time were measured by using a Hitachi F-4500 fluorescence spectrophotometer operated in bioluminescence mode and bioluminescence ATP assay kit (Biyuntian, China) by the luciferin–luciferase method according to the manufacturer’s instructions (see materials and methods). ATP concentration in control cells cultured in L-15 medium in the presence of glucose was 23.53 ± 1.95 nmol/mg protein (n = 3), and they decreased to 10.81 ± 4.32 (n = 3) and 1.77 ± 0.49 nmol/mg protein (n = 3) at 24 and 48 h of glucose starvation, respectively. Three mean values were significantly different at p < 0.05. However, the ATP level increased to 6.53 ± 2.6 nmol/mg protein when Sl cells starved for 48 h returned to L-15 medium with glucose (1 g/mL) for 2 h (n = 3), which was significantly different from that in the cells starved for 48 h (p < 0.05). Thus, it seemed that partial depletion of ATP triggered apoptosis in the severely glucose-starved Sl cells.
Supplemented glutamine inhibited the vacuolization and apoptosis
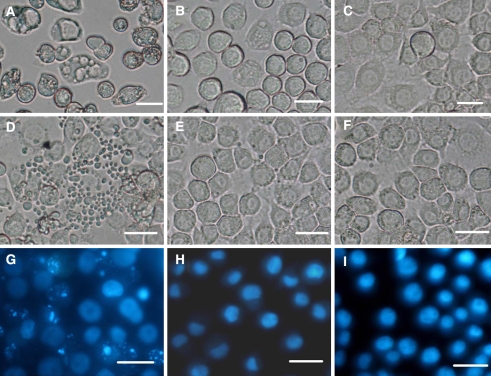
Glutamine is a substrate for an oxidative fuel and provides ATP for the cellular metabolism by glutamiolysis pathway. To investigate the relation between ATP level and apoptosis, glutamine was tested. The vacuolization and apoptosis did not occur in Sl cells cultured in L-15 medium supplemented glutamine (1.6 g/l) (Fig. 4). Our preliminary data demonstrated that the vacuole formation and apoptosis (activation of caspase-3-like activity and fragmentation of DNA) were more likely to be triggered by the lack of ATP in Sl cells depleted energy fuels (glucose, glutamine etc.).
Fig. 4.
The influences of the supplemented glutamine on Sl cells undergoing glucose starvation. (A)–(C). Sl Cells cultured in L-15 medium in the absence of glucose, in the presence of glutamine (1.6 g/l), and in the presence of glucose (1 g/l) for 54 h, respectively. (D)–(F). Sl Cells cultured in L-15 medium with glucose (1 g/l) for 4 h after 54 h of treatment of the cells in figure A, B and C. (G)–(I). Sl Cells in figure D, E and F stained by DAPI. Bar: 20 μm
Glucose starvation inhibited the induced-apoptosis of Sl cell by Act D
Act D (1 μg/mL) can induce apoptosis of Sl cells in L-15-G medium, and the apoptotic cells shrank and formed many apoptotic bodies with high level of caspase-3-like activity (data not shown). To verify whether Act D enhances apoptosis in the starved Sl cells. The cells were treated with Act D after 24 or 48 h of glucose starvation. When the cells were cultured in L-15 medium without supplemented glucose and in the presence of Act D for different times, few apoptotic bodies were formed compared to cells treated with Act D but without starvation treatment (data were not shown), and the caspase-3-like activity was lower than that in the control cells cultured in L-15-G medium (Fig. 5A). These results indicated that the pathway of apoptosis induced by glucose starvation is probably different from that induced by Act D.
Cyclosporin A partially inhibited apoptosis induced by glucose starvation
To study the effects of cytochrome c from mitochondria on apoptosis induced by glucose starvation, the cells exposed to cyclosporin A (30 μM) were starved. Cyclosporin A had no effect on the control cells during 72 h of cultures, but it inhibited the activation of caspase-3-like activity induced by glucose starvation (Fig. 5B).
Discussion
Tettamanti et al. (2006) reported that ATP levels were lowered to about 30% of control values within the first 20 min of treatment with oligomycin A, whereas no further decreases in ATP content were subsequently observed during 120 min. The decrease of ATP levels was as much as that in MCF-7/ADR cells cultured in medium without glucose (Lee et al. 1997). These experiments demonstrated that only glycolysis or fat acid oxidance cannot sustain the ATP levels. Our results also demonstrated that glucose starvation resulted in the decrease of ATP level in Sl cells.
ATP levels decreased drastically in the severely glucose-starved cells undergoing apoptosis. To demonstrate that apoptosis was triggered by the lack of ATP, glutamine was tested. Glutamine provides ATP for the cellular metabolism by glutamiolysis pathway. In our experiments, the autophagy and apoptosis did not occur in Sl cells cultured in L-15 medium with glutamine (1.6 g/l). It also suggested that it was the lack of ATP that resulted in apoptosis (activation of caspase 3 and fragmentation of DNA) in the glucose-starved Sl cells.
Tettamanti et al. (2006) also reported that autophagy occurred in 81% cells when cells treated with oligomycin A returned to the medium without oligomycin A, and many autophagic vacuoles were identified under optical microscope and electron microscope. However, apoptosis of MCF-7/ADR cells occurred after glucose starvation. These cells with the typical characterizations of apoptosis (cell blebbing, formation of apoptotic bodies and DNA ladder) did not form vacuoles/autophagic vacuoles (Lee et al. 1997). Our results are different from theirs. In our experiments, caspase-3-like activity was activated and DNA fragmented after or at least during the disappearance of large autophagic vacuoles when glucose was deprived for 48 h or longer, but cell blebbing was blocked. If the severely starved Sl cells returned to L-15 medium supplemented with glucose, ATP level increased and the inhibition of the formation of apoptotic bodies was released. The main causes for the difference between others and our results were most likely to be the different cell lines or/and different cell ATP level in starved cells. Our data suggested that cell blebbing required higher ATP level than DNA fragmentation and caspase-3-like activation.
Our results argued that apoptosis occurred after autophagy/vacuolization in mammalian cells (Feng et al. 2005; Gonzalez-Polo et al. 2005). Peng et al. (2006) reported vincristine induced autophagic apoptosis of liver cancer cells. Pyo et al. (2005) reported that the interaction between FADD and Atg5 promoted the autophagic cell death. Martin et al. (2004) reported that caspase had been activated during the process of autophagy. Based on our results and these references, it seemed that it was relatively common for cells to undergo apoptosis after vacuolization/autophagy, and sometimes the distinction between apoptosis and auphagic death was not very clear and elegant.
It was reported that the release of enzymes from damaged lysosomes triggered cell apoptosis (Yuan et al. 2002). The staining of neutral red and acridine orange and the identification of acidic phosphatase activity demonstrated that autophagy-lysosomes seemed to be damaged at the late stage of starvation in our present experiments. The destablization of autophagy-lysosomes probably involved in apoptosis in our experiments.
The mechanism for the inhibition of glucose starvation on apoptosis induced by actinomycin D was unclear. Actinomycin D induced cell necrosis when ATP levels were very low, but it induced apoptosis when ATP level was normal (Chou et al. 1995). It was possible that actinomycin D induced Sl cell necrosis at lower ATP levels resulting from glucose starvation. The inhibition of cyclosporin A on apoptosis induced by glucose starvation probably was that the release of cytochrome C in mitochondrion was blocked because cyclosporin A bound to ANT (Bradham et al. 1998). We have demonstrated that cyclosporin A inhibited the release of cytochrome C from mitochondria into cytoplasm by binding to ANT during the induction of apoptosis by baculovirus in the Sl cells in another article (Liu et al. 2007). Thus, The partial inhibition of cyclosporin A on apoptosis demonstrated that cytochrome C also probably involved in apoptosis induced by glucose starvation in Sl cells.
In summary, these data demonstrated apoptosis followed vacuolization/autophagy in glucose-starved Sl cells, cell blebbing required higher ATP level than DNA fragmentation and caspase 3 activation, and lysosome and cytochrome c probably involved in apoptosis of the starved cells. In the future, we need a better understanding of the roles of lysosome, cytochrome C and ATP level in apoptosis of glucose-starved Sl cells.
Acknowledgment
This work was supported by the National Natural Science Foundation of China (Grant No: 30370056 and No: 30470073).
References
- Aki T, Yamaguchi K, Fujimiya T et al (2003) Phosphoinositide 3-kinase accelerates autophagic cell death during glucose deprivation in the cardiomyocyte-derived cell line H9c2. Oncogene 22(52):8529–8535 [DOI] [PubMed]
- Aubert S, Gout E, Bligny R et al (1996) Ultrastructural and biochemical characterization of autophagy in higher plant cells subjected to carbon deprivation: control by the supply of mitochondria with respiratory substrates. J Cell Biol 133:1251–1263 [DOI] [PMC free article] [PubMed]
- Bradham CA, Qian T, Streetz K (1998) The mitochondrial permeability transition is required for tumor necrosis factor alpha-mediated apoptosis and cytochrome c release. Mol Cell Biol 18(11):6353–6364 [DOI] [PMC free article] [PubMed]
- Chou CC, Lam CY, Yung YM (1995) Intracellular ATP is required for actinomycin D-induced apoptotic cell death in HeLa cells. Cancer Lett 96(2):181–187 [DOI] [PubMed]
- Feng Z, Zhang H, Levine AJ et al (2005) The coordinate regulation of the p53 and mTOR pathways in cells. PNAS 102:8204–8209 [DOI] [PMC free article] [PubMed]
- Gomori G (1950) An improved histochemical technique for acid phosphatase. Stain Technol 25:81–85
- González-Polo R, Boya P, Pauleau A et al (2005) The apoptosis/autophagy paradox: autophagic vacuolization before apoptotic death. J Cell Sci 118:3091–3102 [DOI] [PubMed]
- Lee YJ, Galoforo SS, Berns CM et al (1997) Glucose deprivation-induced cytotoxicity in drug resistant human breast carcinoma MCF-7/ADR cells: role of c-myc and bcl-2 in apoptotic cell death. J Cell Sci 110(Pt5):681–686 [DOI] [PubMed]
- Liu LY, Peng JX, Liu KY et al (2007) Influence of cytochrome c on apoptosis induced by Anagrapha (Syngrapha) falcifera multiple nuclear polyhedrosis virus (AfMNPV) in insect Spodoptera litura cells. Cell Biol Int, online, DOI:1016/j.cellbi [DOI] [PubMed]
- Martin DN, Baehrecke EH (2004) Caspases function in autophagic programmed cell death in Drosophila. Development 131:275–284 [DOI] [PubMed]
- Peng X, Chen Y, Piao Y (2006) Cloning and identification of caspase3 gene from HepG2 cells that underwent autophagic apoptosis. Cancer Res Prev Treat 33(5):349–351 (In Chinese)
- Pyo JO, Jiang MH, Kwon YK et al (2005) Essential roles of Atg5 and FADD in autophagic cell death: dissection of autophagic cell death into vacuole formation and cell death. J Biol Chem 280:20722–20729 [DOI] [PubMed]
- Tettamanti G, Malagoli D, Marchesini E et al (2006) Oligomycin A induces autophagy in the IPLB-LdFB insect cell line. Cell Tissue Res 326:179–186 [DOI] [PubMed]
- Xiu M, Peng J, Hong H (2005) Mitochondrial response and Calcium ion change in apoptotic insect cells induced by SfaMNPV, Chinese Sci Bull 50(12):1191–1197 [DOI]
- Yuan X, Li W, Dalen H et al (2002) Lysosomal destablization in p53-induced apoptosis. PNAS 99(9):6286–6291 [DOI] [PMC free article] [PubMed]


