Abstract
Batch cultures were carried out to study the kinetic, stoichiometry, and regulation of glucose and glutamine metabolism of a murine hybridoma line. Asymmetric logistic equations (ALEs) were used to fit total and viable cell density, and nutrient and metabolite/product concentrations. Since these equations were analytically differentiable, specific rates and yield coefficients were readily calculated. Asymmetric logistic equations described satisfactorily uncontrolled batch cultures, including death phase. Specific growth rate showed a Monod-type dependence on initial glucose and glutamine concentrations. Yield coefficients of cell and lactate from glucose, and cell and ammonium from glutamine were all found to change dramatically at low residual glucose and glutamine concentrations. Under stoichiometric glucose limitation, the glucose-to-cell yield increased and glucose-to-lactate yield decreased, indicating a metabolic shift. Under stoichiometric glutamine limitation the glutamine-to-cell and glutamine-to-ammonium yields increased, but also glucose-to-cell yield increased and the glucose-to-lactate yield decreased. Monoclonal antibody production was mainly non-growth associated, independently of glucose and glutamine levels.
Keywords: Hybridoma, Kinetics, Logistic equations, Metabolism, Monoclonal antibodies, Stoichiometry
Introduction
Monoclonal antibodies (MAbs) are one of the most important biological products, gaining an important role in immunodiagnosis, tumour imaging, drug delivery system, cancer treatment and further areas of biological research (Carter 2006). The growing use of MAbs increases the importance of rapid and reliable large-scale production. Many efforts have been made to produce high MAb titer in consideration of economical effectivity (Voigt and Zintl 1999; Jang and Barford 2000).
Culture conditions and medium compounds have a significant impact on cell growth and MAb production by hybridoma cell lines (Lambert and Merten 1997; Barnabé and Butler 2000). Glucose is the major carbon and energy source for cell, whereas glutamine is the mayor nitrogen source (McKeehan 1982; Thilly 1986). Glucose and glutamine are usually assumed to be the cell-growth-limiting nutrients (Dalili et al. 1990). Under different chemical environments, cells can utilize glucose and glutamine differently (Zielke et al. 1978; Reitzer et al. 1979; Zielke et al. 1984; Gambhir et al. 1999; Tsao et al. 2005; Maranga and Goochee 2006). The proportion of each nutrient consumed by different pathways depends on the metabolic state of cells, which is also dependent on the nutrient environment (Cruz et al. 1999a).
Several waste products of cell metabolism have been reported to be inhibitory or toxic to cells. Lactate and ammonia are the most important (Cruz et al. 2000; Patel et al. 2000; Kala and Hertz 2005; Chen and Harcum 2006). Lactate excretion is mainly due to incomplete oxidation of glucose by glycolytic pathway (Miller et al. 1988; Ozturk et al. 1992; Wentz and Shügerl 1992; Schneider et al. 1996). Ammonia released by cells is due to amino acids metabolism, mainly that of glutamine (Schneider et al. 1996). A part of the ammonia that accumulates in the medium is not due to cellular metabolism but to chemical decomposition of glutamine (Ozturk and Palsson 1990).
Attempts have been made to control cell metabolism and to reduce the production of those metabolites by manipulating the concentration of glucose (Hu et al. 1987), glutamine (Glacken et al. 1986) or both (Ljungreen and Häggström 1994). For hybridoma cells, it has been shown that significant alterations of the metabolism can occur as a result of reduced nutrient concentrations (Linz et al. 1997; Maranga and Goochee 2006).
All of these variables are quantified using cell specific rates that enable comparison of cell lines and cultivation conditions. Accurate estimation of specific rates is thus vital to meaningfully interpret results from bioprocess optimisation experiments (Goudar et al. 2005). A conventional approach to model mammalian cells growth in batch cultures has been through the use of unstructured kinetic models (Kontoravdi et al. 2005). Although these models have adequately described experimental data, they are computationally not practical to implement as they involve non-linear estimation of a large number of kinetic parameters from a system of differential equations. Analytical solutions of the differential equations describing the state variables have also been used to estimate specific rates (Altamirano et al. 2000). These solutions are derived under the assumption that the specific rates are constant, as can be expected during the exponential growth phase. These have limited applicability to the other phases of batch cultures where specific rates are not constant (Goudar et al. 2005). Logistic and sigmoid equations (LEs) have been successfully used to describe population dynamic in a variety of applications (Edwards and Wilke 1968; Sangsuurasak and Mitchel 1995; Contreras et al. 1998; Tsoularis and Wallace 2002) and recently have been reported to model experimental data from mammalian cell batch and fed-batch cultures (Goudar et al. 2005).
The objective of this work is to characterize the metabolism of glucose and glutamine of a hybridoma cell line, especially at low levels of nutrients, to examine kinetic, stoichiometry and potential regulation of glycolysis and glutaminolysis in this cell line. Batch cultures at different glucose and glutamine concentrations were conducted. Two asymmetric logistic equations (ALEs) were used to model cell culture data and specific rates were readily obtained from these analytically differentiable equations. Our work demonstrates that these equations can be used to model uncontrolled batch cultures, including lag and death phases.
Materials and methods
The cell line, a mouse-mouse B cell hybridoma, designated 55-6 (ATCC: CRL-2156), produces IgG2a MAbs to human immunodeficiency virus (HIV) glycoprotein 120 (gp120). The cells were grown in RPMI 1640 medium (Sigma, R-8758) supplemented with 10% fetal bovine serum (FBS) (Sigma, F-7524), 2.1 mM l-glutamine (Sigma, G-7513), 100 U/mL penicillin-streptomycin (Sigma, P-4333), 0.125 μg/mL amphotericin B (Sigma, A-2942), hypoxanthine-thymidine (HT) Media Supplement (50X) Hybri-Max*Gamm (Sigma, H-0137), and incubated at 37 °C in 5% CO2 atmosphere.
Cultures were carried out in duplicate in 75 cm2 T-flasks at different concentrations of glucose and l-glutamine based on RPMI-1640 medium without l-glutamine (11 mM glucose) (Sigma, R-5886) or without glucose (2.1 mM l-glutamine) (Gibco, 11879-020). Appropriate volumes of concentrated solutions of glucose (Sigma, G-8270) or l-glutamine (Sigma, G-7513) were added to prepare media with desired initial glucose, [Glc]0, and glutamine, [Gln]0, concentrations. In the ‘glucose experiments’ the [Glc]0 assayed were: 0.3, 0.6, 1.5, 2.5, 5.5, 11.5 and 21.0 mM. In the ‘glutamine experiments’ the [Gln]0 assayed were: 0.05, 0.1, 0.2, 0.5, 1.7 and 4.0 mM. All media were supplemented with 10% FBS (Sigma, F-7524).
Glucose, l-glutamine and lactate were measured in a YSI-2700 bioanalyzer (Yellow Springs Instrument Co.). Ammonia was measured with an ammonia selective electrode (Thermo-Orion 710 A+). Cells were counted in a haemocytometer. Viable cells were determined by the trypan blue dye-exclusion method. MAb was detected by a sandwich enzyme-linked immunosorbent assay. Two replicate measurements were performed for each experiment under each condition.
Data analysis
The data analysis was performed by fitting the experimental data to appropriate functions by least-squares method. To fit total and viable cell density, X(t), versus culture time, t, the following ALE was used:
 |
1 |
where a–e are equation parameters.
Experimental data of glucose, l-glutamine, lactate, ammonia and MAb, C(t), versus culture time, t, were fitted using the following ALE:
 |
2 |
where f–j are equation parameters.
Mammalian cells in batch cultures exhibit a sharp decline in cell density following the stationary phase (asymmetric growth curve). Nutrients decay and products increase curves are asymmetric as well; a behaviour that cannot be described by the standard (symmetric) logistic equations. A previous discrimination analysis of equations using the F-test proved that Eqs. (1) and (2) fits were statistically superior to others equations at the 95% confidence level. Nonetheless, it should be emphasized that not all the parameters in Eqs. (1) and (2) have any direct biological meaning (Edwards and Wilke 1968; Mendieta et al. 1996). Hence, in this work Eqs. (1) and (2) are used just as mathematical tools which reproduce the experimental results, making it possible to calculate explicitly their values and their derivatives, logically constraining the fit.
From Eqs. (1) and (2), growth rates, metabolic uptake and waste production rates were calculated as function of time (transient kinetics) as defined below:
 |
3 |
 |
4 |
 |
5 |
 |
6 |
 |
7 |
 |
8 |
In Eqs. (5) and (7), k is a rate constant accounting for the spontaneous decomposition of glutamine as a first-order reaction with a value of 0.0034 h−1 (Ozturk and Palsson 1990). The apparent yields were calculated from Eqs. (3)–(8) using the corresponding specific metabolic rates:  .
.
Results
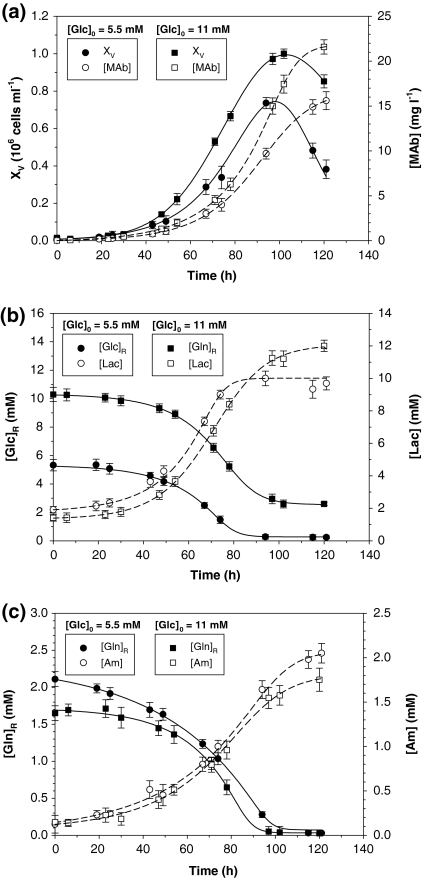
As an example of the experimental data, Fig. 1 shows the time profiles of viable cell density, nutrient, and metabolite concentrations for two representative experiments ([Glc]0 = 5.5 mM, [Gln]0 = 2.1 mM and [Glc]0 = 11 mM, [Gln]0 = 1.7 mM).
Fig. 1.
Two representative batch cultures ([Glc]0 = 5.5 mM, [Gln]0 = 2.1 mM and [Glc]0 = 11 mM, [Gln]0 = 1.7 mM) of 55-6 hybridoma cells: (a) viable cell density and monoclonal antibody concentration; (b) glucose and lactate concentrations; (c) glutamine and ammonium concentrations. In (a), solid lines show Eq. (1) predictions and dashed lines Eq. (2) predictions. In b, c, all lines show Eq. (2) predictions. Experimental data are given as the average of duplicate cultures ± SD
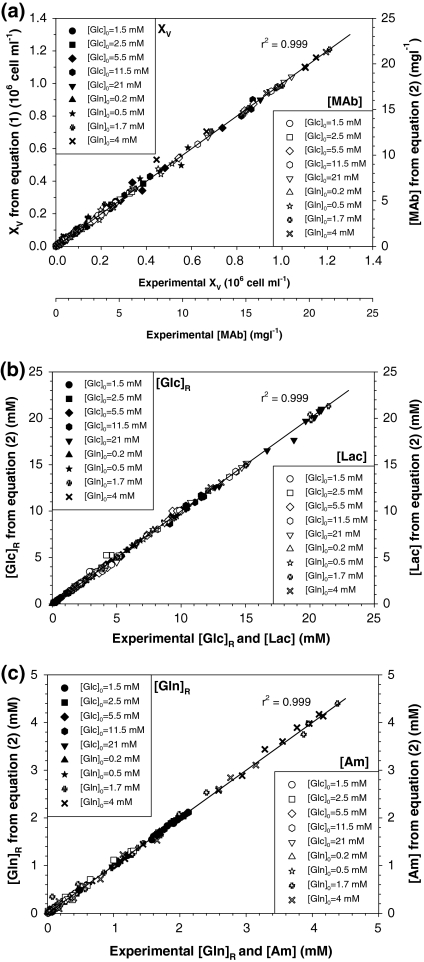
It may be observed in Fig. 1 that the selected ALEs were able to fit different asymmetric behaviours. Figure 2 shows data for viable cell density, XV, and antibody concentration, [MAb] (Fig. 1a), residual glucose, [Glc]R, and lactate, [Lac] (Fig. 2b), and residual glutamine, [Gln]R, and ammonium, [Am] (Fig. 1c), for all experiments. There is excellent agreement between primary experimental data and values derived from ALEs for all datasets. Clearly, Eqs. (1) and (2) fit data found under different conditions quite well, supporting their use for estimating typical physiological response in all phases of animal cell batch cultures.
Fig. 2.
Illustration of the ability of asymmetric logistic equations to fit experimental data. Experimental data for all experiments are compared with Eqs. (1) and (2) predictions: (a) viable cell and MAb; (b) glucose and lactate; (c) glutamine and ammonium
Figure 3 illustrates the dependence of the specific growth rate during the exponential growth phase, μm, on [Glc]0 and [Gln]0 available in each culture. This pattern suggests a Monod-type kinetic limitation by glucose and glutamine. The μm and Monod constant, KS, found by non-linear regression were: μm = 0.055 h−1 and KS = 0.13 mM for glucose and μm = 0.055 h−1 and KS = 0.08 mM for glutamine, which are comparable to those reported for other hybridoma lines (Pörtner and Schäfer 1996; Jeong and Wang 1995; deTremblay et al. 1992; Dalili et al. 1990; Glacken et al. 1989; Miller et al. 1988).
Fig. 3.
Growth rate analysis: Effect of initial glucose and glutamine concentrations on specific growth rate during exponential growth phase. Solid line represents the Monod model for the glucose experiments and dashed line the Monod model for the glutamine experiments
The growth curves in Fig. 3 do not show any kinetic limitation pattern above [Glc]0 = 1 mM and [Gln]0 = 0.2 mM. The pattern is rather one of purely stoichiometric limitation, since the maximum cell density increased with increasing [Glc]0 and [Gln]0 (see Fig. 1). Therefore, to avoid superimposing the kinetic and stoichiometric limitation effects, in the following analysis, only the experiments with glucose concentration over 1 mM and glutamine concentrations over 0.2 mM are discussed.
Cell production
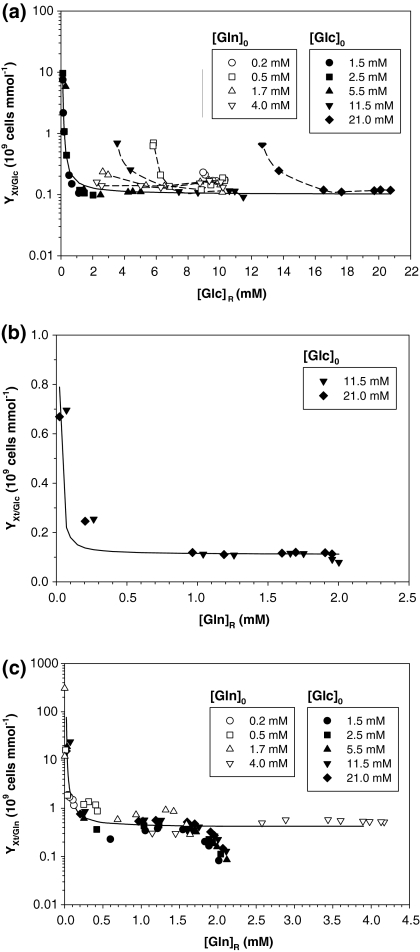
Figure 4a shows YXt/Glc for all experiments. In the glucose experiments, YXt/Glc increased significantly when the residual glucose concentration, [Glc]R, was <1 mM. Figure 4a suggests the following relationship between YXt/Glc and [Glc]R:
Fig. 4.
Cell production analysis: (a) total cell yield coefficient from glucose versus residual glucose concentration for all experiments; (b) total cell yield coefficient from glucose vs. residual glutamine concentration for experiments with 11.5 and 21.0 mM initial glucose concentrations; (c) total cell yield coefficient from glutamine versus residual glutamine concentration for all experiments. Solid lines show the fit with Eq. (9)
 |
9 |
where (YXt/Glc)min is the minimum YXt/Glc, estimated to be 0.10 × 10⁹ cells mmol−1 and A is a constant with a value of 0.5 mM glucose.
Nonetheless, for high [Glc]0 (11.5 and 21 mM), glucose never limited the culture, because glutamine was already exhausted before that, and an increase in YXt/Glc was observed as well. As may be seen in Fig. 4b, YXt/Glc started to increase when [Gln]R became limiting (around 0.2 mM). This seems to indicate that [Gln]R affects glucose consumption in this cell line, since when glutamine limitation begins, glucose consumption is reduced, because the lack of glutamine cannot be compensated by glucose. Figure 4b suggests a relationship similar to the one in Eq. (9) between YXt/Glc and [Gln]R for experiments with high [Glc]0, where (YXt/Glc)min = 0.11 × 10⁹ cells mmol−1 and A = 0.035 mM glutamine.
In the glutamine experiments, YXt/Glctended to a constant value, similar to the glucose experiments. When glutamine became limiting (around 0.2 mM), YXt/Glc increased (Fig. 5a). This corroborates the comments above on the glucose experiments.
Fig. 5.
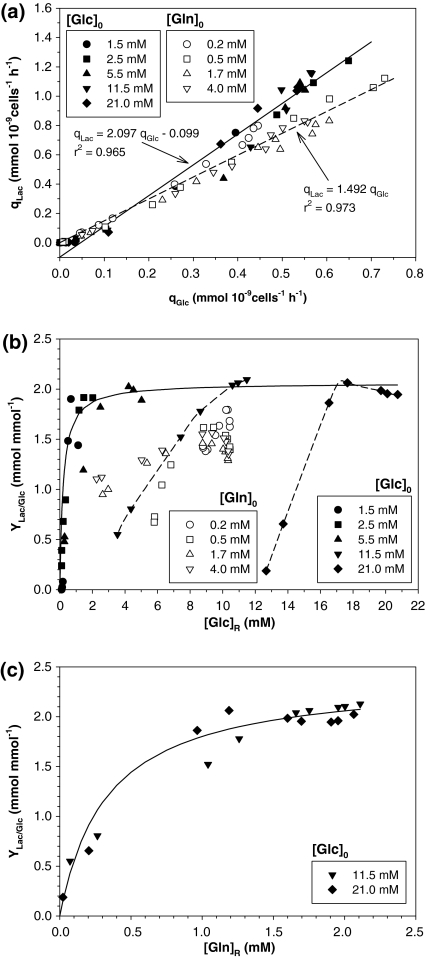
Lactate production analysis: (a) specific glucose consumption rate versus specific lactate production rate for all experiments; (b) lactate yield coefficient from glucose versus residual glucose concentration for all experiments. Solid line is the Michaelis-Menten fit; (c) lactate yield coefficient from glucose vs. residual glutamine concentration for experiments with 11.5 and 21.0 mM initial glucose concentrations. Solid line is the Michaelis-Menten fit
Figure 4c shows YXt/Gln in all experiments. YXt/Gln increased significantly at [Gln]R below 0.2 mM, indicating that, under these conditions, the glutamine metabolism was more effective and, clearly, no effect of glucose concentration was observed, although this nutrient was completely exhausted at low [Glc]0. YXt/Gln was adjusted to an equation similar to Eq. (9) in which (YXt/Gln)min = 0.4 × 10⁹ cells mmol−1 and A = 0.12 mM glutamine. YXt/Gln was mainly determined by the [Gln]R, since no effect of [Glc]R was observed in this parameter.
Lactate production
YLac/Glc have traditionally been estimated from the slope of a plot of qLac versus qGlc. Figure 5a shows qLac versus qGlc for all experiments.
Figure 5a shows a linear relationship for high qLac and qGlc with a slope of about 2 mmol mol−1 in glucose experiments. As pointed out by Zeng et al. (1998), a more thorough analysis reveals a large deviation in that linear relationship at low qLac and qGlc. To highlight this deviation, in Fig. 5b, YLac/Glc, was plotted against [Glc]R. This Figure shows that although YLac/Glc tended to a constant value, under glucose limitation ([Glc]R < 1–1.5 mM) YLac/Glc decreased to almost 0, strongly suggesting a metabolic shift from a high to low-lactate-producing metabolism.
It may be observed in Fig. 5b that YLac/Glc showed a Michaelis-Menten behaviour. The maximum YLac/Glc was 2.062 mol mol−1, while the Michaelis-Menten constant was 0.206 mM glucose. For cultures at high [Glc]0 (11.5 and 21.0 mM), the minimum [Glc]R were 3.5 and 12.7 mM respectively, because glutamine was already exhausted.
Figure 5c shows that when YLac/Glc for high [Glc]0 (11.5 and 21.0 mM) is plotted against [Gln]R, a Michaelis-Menten behaviour is also observed. It therefore seems that under stoichiometric glutamine limitation, the key parameter affecting the glucose metabolism, at least in this cell line, is not the [Glc]R in the culture but the [Gln]R. This agrees with the results found for cell production as described above.
In glutamine experiments, a linear relationship was found between qLac and qGlc with a slope of about 1.5 mmol mmol−1 (Fig. 5a). When qLac and qGlcdecreased, no clear deviation from this linear relationship seemed to appear. Nonetheless, when YLac/Glc, was plotted against [Glc]R in Fig. 5b, although YLac/Glc tended to a constant value of about 1.5 mmol mmol−1, under glutamine limitation ([Gln]R < 0.2 mM) a change in cell metabolism took place and YLac/Glc decreased. This supports a metabolic shift from a high to low-lactate-producing metabolism mentioned above, and confirms that glutamine level strongly influences glucose metabolism in this cell line.
Ammonium production
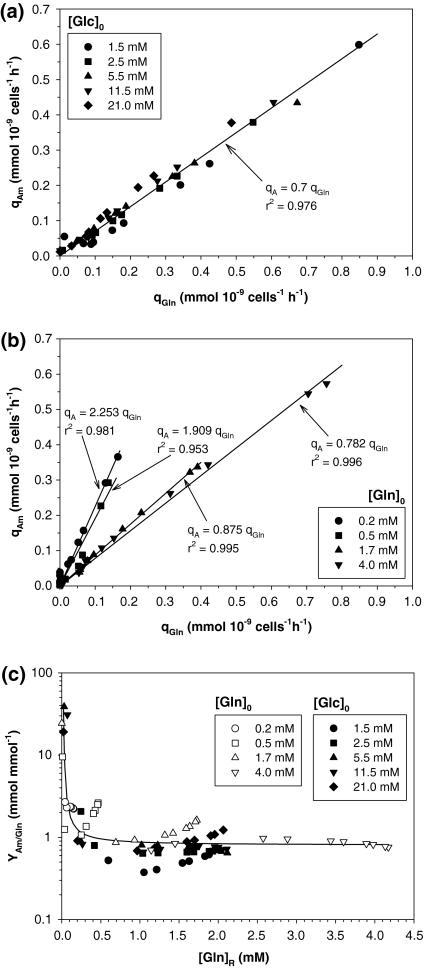
Figure 6a shows qA versus qGln in glucose experiments, in which an apparently linear relationship of qA and qGln with a 0.7 mol mol−1 slope is observed, regardless of [Glc]0.
Fig. 6.
Ammonium production analysis: (a) specific glutamine consumption rate versus specific ammonium production rate for glucose experiments; (b) ammonium yield coefficient from glutamine versus residual glutamine concentration in culture for all experiments. Solid line shows the fit with Eq. (9); (c) specific glutamine consumption rate vs. specific ammonium production rate for glutamine experiments
Nonetheless, when YA/Gln, was plotted against [Gln]R (Fig. 6b), an increase in YA/Gln at low [Gln]R (< 0.2 mM) was observed in all experiments. For [Gln]R over 0.2 mM, YA/Glnwas almost constant. This variation was fitted to an equation similar to Eq. (9) in which (YA/Gln)min = 0.8 mol mol−1, and A = 0.09 mM glutamine.
Figure 6c shows qA versus qGln in glutamine experiments. Ammonium production was clearly controlled by the amount of glutamine available. As [Gln]0 diminished, the slope increased, indicating a shift in glutamine metabolism.
MAb production
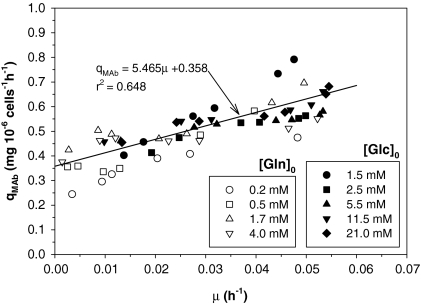
The influence of μ on qMAb plotted in Fig. 7 for all experiments suggests a combined model expressed as:
Fig. 7.
MAb production analysis: specific MAb production rate vs. specific growth rate for all experiments
 |
10 |
with α denoting the growth-dependent and β the growth-independent term (Pirt 1975). α and β were 5.465 (mg 10−6 cells−1) and 0.358 (mg 10−6 cells−1h−1) respectively.
Discussion
In this paper, two five-parameter ALEs were used to fit the time profiles of total and viable cell densities, nutrients, metabolites and product concentrations in batch cultures. Specific rates were readily calculated from the inoculation through the cell death phase (Eqs. (3)–(8)). There is excellent agreement between the values derived from these equations and experimental data for all data sets, supporting the validity of this approach. As pointed out by Goudar et al. (2005), specific uptake and production rates, as well as cell growth rate, are the key input data in metabolic flux analysis. The goodness of fit achieved with the equations presented here provides a practical, more reliable way to estimate specific rates that should enable more robust metabolic flux computation.
Cell production
YXt/Glc of around 0.1 × 10⁹ cells mmol−1 found at glucose concentrations above 1 mM (Fig. 5a) correlate well with reported values of 0.27–0.57 × 10⁹ cells mmol−1 for hybridoma cells (Ljungreen and Häggström 1992, 1994) and of 0.1–0.4 × 10⁹ cells mmol−1 for BHK cells (Linz et al. 1997; Cruz et al. 1999b). The increase at [Glc]R of <1 mM agrees with the results of Frame and Hu (1991) for hybridoma cells and Linz et al. (1997) and Cruz et al. (1999b) for BHK cells.
The increase in YXt/Gln observed when glutamine becomes limiting ([Gln]R < 0.2 mM) confirms that glutamine clearly affects glucose consumption. This agrees with the results of Vriezen et al. (1997) and indicates that at the lowest glutamine concentrations, most of the consumed glucose is used for oxidation and/or anabolic purposes.
YXt/Gln values for [Gln]R above 0.2 mM (around 0.4 × 10⁹ cells mmol−1) agree with reported values in the 0.4–0.6 × 10⁹ cells mmol−1 range for hybridoma cells (Ljungreen and Häggström 1994; Frame and Hu 1991) and BHK cells (Linz et al. 1997; Cruz et al. 1999b). The increase in YXt/Gln at low [Gln]R suggests that if the glucose supply is limited, glutamine may compensate for and replace glucose; and cells may shift part of their metabolic pathway from glycolysis to glutaminolysis as previously reported (Cruz et al. 1999a, b; Li et al. 2005).
Lactate production
The slope of qLac versus qGlc (2 mmol mmol−1) is the same as reported by Miller (1987) and Wu et al. (1992), although slightly higher than those usually reported for batch cultures in literature (1.4–1.7) (Zeng et al. 1998). The decrease in YLac/Glc at low [Glc]R shows that glucose is being metabolised by different pathways leading to more energetically efficient utilization (low lactate production) of glucose (Zhou et al. 1995; Cruz et al. 1999b).
In glutamine experiments, the slope of qLac versus qGlc (1.49 mmol mmol−1) is similar to reports in literature for batch cultures (1.4–1.7) (Zeng et al. 1998). The decrease in YLac/Glc at low [Gln]R agrees with the data found by other authors in batch and chemostat cultures for different hybridoma cells. Jeong and Wang (1995) found that in batch cultures, when [Gln]0 decreased from 6 to 0 mM, average YLac/Glc decreased more than 50% and qGlc was also affected. Vriezen et al. (1997) reported that in chemostat cultures, glutamine feed concentration influenced qGlc and YLac/Glc as well. Cruz et al. (1999b) found similar results with BHK cells.
Ammonium production
YA/Gln of around 0.8 mmol mmol−1 found for [Gln]R above 0.2 mM is in agreement with the literature for hybridoma cells, 0.6–0.76 (Ozturk and Palsson 1991), and BHK cells, 0.5–1.5 (Linz et al. 1997; Cruz et al. 1999b), and reflects the importance of the transamination pathway in the glutamine metabolism, as reported by Zupke et al. (1995). The increase in YA/Gln at low [Gln]R may be the result of an increase in consumption of other amino acids (Linz et al. 1997; Zeng et al. 1998; Li et al. 2005) and/or because a higher proportion of glutamine is entering the TCA cycle by glutamate dehydrogenase, because the cell needs to obtain the most ATP out of glutamine (Cruz et al. 1999b), leading to the conclusion that a more efficient glutamine metabolism is occurring (Ljungreen and Häggström 1994). So, under low [Gln]R, cells must use glutamine in the most efficient way, producing more ATP molecules but, consequently, also producing more ammonia per glutamine molecule (Cruz et al. 1999a).
Reciprocal regulation of glucose and glutamine utilization
In the discussion above, glucose and glutamine metabolism was shown to be affected by their residual concentrations. It is well known that mammalian cells use both glucose and glutamine for energy generation. Theoretically, a reduction in the concentration of one of these two nutrients could lead to higher specific consumption of the other. This has been reported for human diploid fibroblasts (Zielke et al. 1984), hybridomas (Hu et al. 1987; Ljungreen and Häggström 1994) and BHK cells (Cruz et al. 1999b). But, as pointed out by Vriezen et al. (1997), it is much more complicated because glutamine is also a major nitrogen donor and glutamine catabolism can use both trans- and deaminating pathways.
The ratio of specific consumption of glutamine to specific consumption of glucose (qGln/qGlc) has been the traditional parameter to study the reciprocal regulation of glucose and glutamine utilization (Vriezen et al. 1997; Zeng et al. 1998). This ratio has been found to correlate with [Glc]R. It decreases with increase in glucose concentration and reaches a constant value between 0.2 mmol mmol−1 and 0.5 mmol mmol−1 over [Glc]R = 1−1.5 mM, the maximum qGln/qGlc ratio being cell-line specific (Zeng et al. 1998). Figure 8 shows qGln/qGlc for the different glucose and glutamine experiments in our work. qGln/qGlc can be expressed by the equation:
Fig. 8.
Reciprocal regulation of glucose and glutamine utilization: ratio of specific consumption of glutamine to specific consumption of glucose as a function of the residual glucose concentration for all experiments. Solid line shows the fit with Eq. (11)
 |
11 |
The estimated value of (qGln/qGlc)min was 0.2 mmol mmol−1, which agrees with the results of Zeng et al. (1998). The B constant was 0.55 mM glucose, which is higher than the previously reported (0.03–0.05 mM) for hybridoma cells (Zeng et al. 1998).
Although no significant change in qGln/qGlc was observed in the experiments at different [Gln]0, there was a significant increase when [Glc]R remained below 1–1.5 mM in experiments at different [Glc]0. According to Cruz et al. (1999b), this could be explained by the fact that glucose and glutamine are the main carbon and energy sources, and as glutamine is a highly important metabolic building block, its decrease is not compensated by glucose, but the role of glucose as an energy source can be compensated by glutamine. Furthermore, Paquette et al. (2005) have reported that glutamine starvation induces an apoptotic program of cell death in murine hybridoma Sp2/0. According to these authors, Sp2/0 cells were irreversibly committed to die after only 2 h of glutamine starvation.
MAb production
It is well known that the specific MAb production rate, qMAb, differs significantly between different cell lines with respect to the level of productivity as well as to the influence of culture conditions. In most cases qMAb is related to the specific growth rate, μ, and is found to increase or decrease with increasing growth rate or be independent. A number of unstructured and structured models have been proposed to represent qMAb. The unstructured model equations show a wide variety of different approaches reflecting the different behaviour of the cell lines investigated (see Pörtner and Schäfer (1996) for a review). α and β found in our work are independent of glucose and glutamine level and show a predominance of non-growth-associated MAb production in this cell line.
Conclusions
Most previous work on this subject has been done in very well-controlled bioreactors where key variables such as dissolved oxygen tension and pH were carefully monitored and strictly controlled. In addition, most relevant conclusions were obtained in steady state or pseudo-steady state conditions in chemostat, perfusion, semi-perfusion or repeated fed-batch cultures, where clear correlations between variables can be assigned. In this work, two ALEs were used to accurately fit cell density, nutrient and metabolite time profiles. Time derivatives of these variables were easily computed, resulting in rapid estimation of specific rates and yield coefficients. It was shown that these equations can be used to model batch animal cell cultures in which environmental conditions are continuously changing. Specific growth rate and glucose and glutamine stoichiometric ratios are independent of glucose and glutamine concentrations over the range normally employed in cell culture media. However, for low nutrient levels ([Glc]R < 1 mM and [Gln]R < 0.2 mM), cell metabolism changes significantly, shifting to more efficient states. The glucose and glutamine uptake rates are markedly reduced at low nutrient levels, leading to a more effective utilization of these nutrients for energy metabolism and biosynthesis. It was observed that glucose metabolism in this cell line is affected by glutamine at low [Gln]R. MAb production is well represented by a combined model in which the parameters suggest a mainly non-growth-associated production of MAb. The cell physiology changes observed should be considered when establishing strategies for metabolic optimisation and in designing an optimal medium and/or feeding strategy for relevant culture processes.
Nomenclature
- a, b, c, d, e, f, g, h, i, j, A, B
Constants
- [Am]
Ammonium concentration (mM)
- [Glc]0
Initial glucose concentration (mM)
- [Gln]0
Inicial glutamine concentration (mM)
- [Glc]R
Residual glucose concentration (mM)
- [Gln]R
Residual Glutamine concentration (mM)
- k
Constant accounting for the spontaneous decomposition of glutamine (h−1)
- [Lac]
Lactate concentration (mM)
- [MAb]
Monoclonal antibody concentration (mg L−1)
- KS
Monod constant for glucose or glutamine (mM)
- qA
Specific ammonium production rate (mmol cells−1 h−1)
- qGlc
Specific glucose consumption rate (mmol cells−1 h−1)
- qGln
Specific glutamine consumption rate (mmol cells−1 h−1)
- qLac
Specific lactate production rate (mmol cells−1 h−1)
- qMAb
Specific antibody production rate (mg cells−1 h−1)
- t
Time (h)
- YA/Gln
Ammonium yield coefficient from glutamine (mmol mmol−1)
- (YA/Gln)min
Minimum ammonium yield coefficient from glutamine (mmol mmol−1)
- YLac/Glc
Lactate yield coefficient from glucose (mmol mmol−1)
- YXt/Glc
Cell yield coefficient from glucose (cells mmol−1)
- (YXt/Glc)min
Minimum cell yield coefficient from glucose (cells mmol−1)
- YXt/Gln
Cell yield coefficient from glutamine (cells mmol−1)
- (YXt/Gln)min
Minimum cell yield coefficient from glutamine (cells mmol−1)
- XT
Total cell density (cells mL−1)
- XV
Viable cell density (cells mL−1)
- α
Constant accounting for growth-dependent antibody synthesis (mg cell−1)
- β
Constant accounting for growth-independent antibody synthesis (mg cell−1 h−1)
- μ
Specific growth rate (h−1)
- μm
Maximum specific growth rate (h−1)
References
- Altamirano C, Paredes C, Cairo J, Gòdia C (2000) Improvement of CHO cell culture medium formulation: simultaneous substitution of glucose and glutamine. Biotechnol Prog 16:69–75 [DOI] [PubMed]
- Barnabé N, Butlet M (2000) The effect of glucose and glutamine on the intracellular nucleotide pool and oxygen uptake rate of a murine hybridoma. Cytotechnology 34:47–57 [DOI] [PMC free article] [PubMed]
- Carter PJ (2006) Potent antibody therapeutics by design. Nat Rev 6:343–357 [DOI] [PubMed]
- Chen P, Harcum SW (2006) Effects of elevated ammonium on glycosylation gene expresion in CHO cells. Metabol Eng 8:123–132 [DOI] [PubMed]
- Contreras A, García F, Molina E, Merchuk JC (1998) Interaction between CO2-mass transfer, light availability, and hydrodynamic stress in the growth of Phaeodactylum tricornutum in a concentric tube airlift photobioreactor. Biotechnol Bioeng 60:317–325 [DOI] [PubMed]
- Cruz HJ, Ferreira AS, Freitas CM, Moreira JL, Carrondo MJT (1999a) Metabolic responses to different glucose and glutamine levels in baby hamster kidney cell culture. Appl Microbiol Biotechnol 51:579–585 [DOI] [PubMed]
- Cruz HJ, Moreira JL, Carrondo MJT (1999b) Metabolic shifts by nutrient manipulation in continuous cultures of BHK cells. Biotechnol Bioeng 66:105–113 [DOI] [PubMed]
- Cruz HJ, Freitas CM, Alves PM, Moreira JL, Carrondo MJT (2000) Effects of ammonia and lactate on growth, metabolism, and productivity of BHK cells. Enzyme Microb Technol 27:43–52 [DOI] [PubMed]
- Dalili M, Sayles GD, Ollis DF (1990) Glutamine-limited batch hybridoma growth and antibody production: experiment and model. Biotechnol Bioeng 36:74–82 [DOI] [PubMed]
- de Tremblay M, Perrier M, Chavarie C, Archambault J (1992) Optimization of fed-batch culture of hybridoma cells using dynamic programming: single and multi feed case. Bioprocess Eng 7:229–234 [DOI]
- Edwards VH, Wilke CR (1968) Mathematical representation of culture data. Biotechnol Bioeng 10:205–232 [DOI]
- Frame KK, Hu WS (1991) Kinetic study of hybridoma cell growth in continuous culture. I. A model for non-producing cell. Biotechnol Bioeng 37:55–64 [DOI] [PubMed]
- Gambhir A, Europa A, Hu WS (1999) Alteration of cellular metabolism by consecutive fed-batch cultures of mammalian cells. J Biosci Bioeng 87:805–810 [DOI] [PubMed]
- Glacken MW, Fleischaker RJ, Sinskey AJ (1986) Reduction of waste product excretion via nutrient control: possible strategies for maximizing product and cell yields on serum in cultures of mammalian cells. Biotechnol Bioen 28:1376–1389 [DOI] [PubMed]
- Glacken MW, Huang C, Sinskey AJ (1989) Mathematical description of hybridoma culture kinetics. III. Simulation of fed-batch bioreactor. J Biotechnol 10:39–66 [DOI]
- Goudar CT, Joeris K, Konstantinov KB, Piret JM (2005) Logistic equations effectively model mammalian cell batch and fed-batch kinetic by logically constraining the fit. Biotechnol Prog 21:1109–1118 [DOI] [PubMed]
- Hu WS, Dodge TC, Frame KK, Himes VB (1987) Effect of glucose on the cultivation of mammalian cells. Dev Biol Stand 66:279–290 [PubMed]
- Jang JD, Barford JP (2000) Effect of feed rate on growth rate and antibody production in the fed-batch culture of murine hybridoma cells. Cytotechnolgy 32:229–242 [DOI] [PMC free article] [PubMed]
- Jeong YH, Wang SS (1995) Role of glutamine in hybridoma cell culture: Effects on cell growth, antibody production, and cell metabolism. Enzyme Microb Technol 17:47–55 [DOI]
- Kala G, Hertz L (2005) Ammonia effects on pyruvate/lactate production in astrocyte-interaction with glutamate. Neurochem Internat 47:4–12 [DOI] [PubMed]
- Kontoravdi C, Asprey SP, Pistikopoulos EN, Mantalaris A (2005) Application of the Sobol’ global sensitivity analysis method to a dynamic model of MAB-producing mammalian cell cultures. Biotechnol Prog 21:1128–1135 [DOI] [PubMed]
- Lambert N, Merten O-W (1997) Effect of serum-free and serum-containing medium on cellular levels of ER-based proteins in various mouse hybridoma cell lines. Biotechnol Bioeng 54:165–180 [DOI] [PubMed]
- Li L, Mi L, Feng Q, Liu R, Tang H, Xie L, Yu X, Chen Z (2005) Increasing culture efficiency of hybridoma cell by integrated metabolic control of glucose and glutamine at low level. Biotechnol Appl Biochem 42:73–80 [DOI] [PubMed]
- Linz M, Zeng AP, Wagner R, Deckwer WD (1997) Stoichiometry, kinetic, and regulation of glucose and amino acid metabolism of a recombinant BHK cell line in batch and continuous cultures. Biotechnol Prog 13:453–463 [DOI] [PubMed]
- Ljungreen J, Häggström L (1992) Glutamine limited fed-batch culture reduces the overflow metabolism of amino acids in myeloma cells. Cytotechnol 8:45–56 [DOI] [PubMed]
- Ljungreen J, Häggström L (1994) Catabolic control of hybridoma cells by glucose and glutamine limited fed batch cultures. Biotechnol Bioeng 44:808–818 [DOI] [PubMed]
- Maranga L, Goochee CF (2006) Metabolism of PER.C6TM cells cultivated under fed-batch conditions at low glucose and glutamine levels. Biotechnol Bioeng 94:139–150 [DOI] [PubMed]
- Mendieta J, Díaz-Cruz MS, Tauler R, Esteban M (1996) Application of Multivariate curve resolution to voltammetric data. Anal Biochem 240:134–141 [DOI] [PubMed]
- McKeehan WL (1982) Glycolisis, glutaminolysis and cell proliferation. Cell Biol Int Rep 6:635–649 [DOI] [PubMed]
- Miller WM (1987) A kinetic analysis of hybridoma growth and metabolism. PhD dissertation, University of California, Berkeley
- Miller WM, Wilke CR, Blanch HW (1988) Transient responses of hybridoma cells to lactate and ammonia pulse and step changes in continuous culture. Bioprocess Eng 3:113–122 [DOI]
- Ozturk SS, Palsson BO (1990) Chemical decomposition of glutamine in cell culture media: effect of media type, pH, and serum concentration. Biotechnol Prog 6:121–128 [DOI] [PubMed]
- Ozturk SS, Palsson BO (1991) Effect of medium osmolarity on hybridoma growth, metabolism and antibody production. Biotechnol Bioeng 37:989–993 [DOI] [PubMed]
- Ozturk SS, Riley MR, Palsson BO (1992) Effects of ammonia and lactate on hybridoma growth, metabolism and antibody production. Biotechnol Bioeng 39:418–431 [DOI] [PubMed]
- Paquette JC, Guérin PJ, Gauthier ER (2005) Rapid induction of the intrinsic apoptotic pathway by l-glutamine starvation. J Cell Physiol 202:912–921 [DOI] [PubMed]
- Patel SD, Papoutsakis ET, Winter JN, Miller WM (2000) The lactate issue revisited: novel feeding protocols to examine inhibition of cell proliferation and glucose metabolism in hematopoietic cell cultures. Biotechnol Prog 16:885–892 [DOI] [PubMed]
- Pirt JS (1975) Principles of microbe and cell cultivation. Blackwell, Oxford
- Pörtner R, Schäfer T (1996) Modelling hybridoma cell growth and metabolism—a comparison of selected models and data. J Biotechnol 49:119–135 [DOI] [PubMed]
- Reitzer LJ, Wice BM, Kennell D (1979) Evidence that glutamine, not sugar, is the major energy source for cultured HeLa cells. J Biol Chem 254:2669–2676 [PubMed]
- Sangsuurasak P, Mitchel D (1995) Incorporation of death kinetic into a 2-dimensional dynamic heat transfer model for solid-state fermentation. J Chem Technol Biotechnol 64:253–260 [DOI]
- Schneider M, Marison IW, von Stockar U (1996) The importance of ammonia in mammalian cell culture. J Biotechnol 46:161–185 [DOI] [PubMed]
- Thilly WG (1986) Mammalian cell technology. Butterwoth, Boston
- Tsao YS, Cardoso AG, Condon RGG, Voloch M, Lio P, Lagos JC, Kearns BG, Liu Z (2005) Monitoring chinese hamster ovary cell culture by the analysis of glucose and lactate metabolism. J Biotechnol 118:316–327 [DOI] [PubMed]
- Tsoularis A, Wallace J (2002) Analysis of logistic growth models. Math Biosci 179:21–55 [DOI] [PubMed]
- Voigt A, Zintl F (1999) Hybridoma cell growth and anti-neuroblastoma monoclonal antibody production in spinner flask using a protein-free medium with microcarriers. J Biotechnol 68:213–226 [DOI] [PubMed]
- Vriezen N, Romein B, Luyben KChAM, van Dijken JP (1997) Effects of glutamine supply on growth and metabolism of mammalian cells in chemostat culture. Biotechnol Bioeng 54:272–286 [DOI] [PubMed]
- Wentz D, Schügerl K (1992) Influence of lactate, ammonia and osmotic stress on adherent and suspension BHK cells. Enzyme Microb Technol 14:68–75 [DOI] [PubMed]
- Wu P, Ray NG, Shuler ML (1992) A single-cell model for CHO cells. Ann NY Acad Sci 665:152–186 [DOI] [PubMed]
- Zeng AP, Hu WS, Deckwer WD (1998) Variation of stoichiometric ratios and their correlation for monitoring and control of animal cell cultures. Biotechnol Prog 14:434–441 [DOI] [PubMed]
- Zhou W, Rehm J, Hu WS (1995) High viable cell concentration fed-batch cultures of hybridoma cells through on-line nutrient feeding. Biotechnol Bioeng 46:579–587 [DOI] [PubMed]
- Zielke HR, Ozand PT, Tildon JT, Sevadalian DA, Cornblath M (1978) Reciprocal regulation of glucose and glutamine utilization by cultured human diploid fibroblasts. J Cell Physiol 95:41–48 [DOI] [PubMed]
- Zielke HR, Zielke CL, Ozand PT (1984) Glutamine: a major energy source for cultured mammalian cells. Fed Proc 43:121–125 [PubMed]
- Zupke C, Sinskey AJ, Stephanopoulos G (1995) Intracellular flux analysis applied to the effect of dissolved oxygen on hybridomas. Appl Microbiol Biotechnol 44:27–36 [DOI] [PubMed]


