

Abstract
Background
In ankles with end-stage osteoarthritis or after total ankle replacement (TAR), radiographic landmarks based on joint surface morphology are usually obscured and thus inadequate for measurement. Two candidate measures for quantifying AP tibial-talar alignment without relying on those landmarks were identified in a corollary cadaver-based study. This study aimed to verify reliability and validity of those candidate measures.
Methods
On clinical radiographs of thirty-three non-arthritic and thirty-five arthritic ankles, the AP tibial-talar alignment was quantified by the two candidate measures; the tibial axis-talar ratio (T-T ratio: the ratio into which the mid-longitudinal axis of the tibial shaft divides the longitudinal talar length) and the posterior tibial line-talar ratio (P-T ratio: a similar ratio, but using the posterior longitudinal line along the tibial shaft). Two observers performed every measurement twice, in order to evaluate intra- and inter-observer reliability of the candidate measures. For non-arthritic ankles, the AP tibial-talar alignment was further determined by a control measure that directly quantifies orientation of the talar dome relative to the tibial shaft. Correlation of each candidate measure with the control measure was then evaluated for validity.
Results
Measurement of the T-T ratio with arthritic ankles was highly reproducible with the coefficients of determination (R2) greater than 0.95, for either inter- or intra-observer. Correlation between this measure and the control measure was supported (R2 = 0.60, p < 0.0001). Reliability of the P-T ratio was also strong (R2 > 0.91), though both reliability and validity of this measure was relatively inferior to the T-T ratio.
Conclusions
The T-T ratio reliably and validly described the AP tibial-talar alignment on clinical radiographs, regardless of the condition of ankle joint surface. This measure appears to be a reliable radiographic measure for determining the magnitude of AP talar subluxation in ankles with articular degeneration or after TAR, and can facilitate clinical investigations.
Keywords: ankle, alignment, radiographic measurement
INTRODUCTION
Antero-posterior (AP) ankle malalignment with end-stage osteoarthritis has been implicated with an accelerated rate of degeneration,[5,8] and AP implant malpositioning after total ankle replacement (TAR) has been considered as a possible cause of premature implant failure.[1-4,6] However, reliable means to assess AP ankle alignment in these clinical conditions have not yet well established. On ankle radiographs with either severe articular degeneration or TAR implants, radiographic landmarks based on joint surface morphology are usually obscured and inadequate for measurement. Ankle alignment under such situations must be determined without relying on those landmarks. In addition, because of difficulty in reproducibly positioning the ankle for a standing radiograph, any radiographic measure to accurately describe ankle alignment needs to tolerate perturbations of ankle positioning in clinical radiographs.
To identify a radiographic measure of AP tibial-talar alignment that meets these requirements, several candidate measures that do not rely on ankle surface landmarks were tested in a complementary cadaver-based study.[7] The candidate measures were compared in terms of sensitivity to perturbations of ankle positioning, and two of them were identified as best candidates for clinical measurement. The present work was performed to assess the reliability and validity of those candidate measures in the clinical environment.
METHODS
Sixty-eight lateral standing ankle radiographs were collected in our foot and ankle clinic. Each radiograph captured one of two groups of ankles, either with articular degeneration associated with osteoarthritis (OA ankles) or without articular degeneration (non-OA ankles). Thirty-three radiographs of non-OA ankles were obtained from 27 patients (19 females, and 8 males; age 15 – 78). Diagnoses for these ankles included heel pain in 12 patients, Achilles tendinopathy in 9, subtalar arthritis in 2, hallux valgus in 2, metatarsalgia in 1, and osteoarthritis on the contralateral ankle in 1. Thirty-five radiographs with OA ankles were from 35 patients (21 female and 14 male; age 45-82) who underwent total ankle replacement or ankle fusion with an average 4.7 score on the Kellgren-Lawrence scale (range 3 to 5). Every radiograph included at least 10 cm of the tibial shaft and clear demarcation of the floor line. The radiographs were scanned and stored as digital images for on-screen image analysis.
On all radiographs, the AP tibial-talar alignment was quantified by two candidate measures that do not rely on radiographic landmarks based on ankle articulation; 1) the tibial axis - talar ratio (T-T ratio: the ratio into which the mid-longitudinal axis of the tibial shaft divides the longitudinal talar length) and 2) the posterior line - talar ratio (P-T ratio: a similar ratio, but using the posterior longitudinal line along the tibial shaft).[7]
In addition to those candidate measures, only on non-OA radiographs, AP orientation of the talar dome with respect to the tibial mid-longitudinal axis was quantified as a control measure. The center point of a talar dome was identified as the center of the arc through three (anterior-quarter, middle, and posterior-quarter) points on the lateral projection of the central groove contour. Perpendicular distance from the tibial axis to the talar dome center was then measured and normalized to the longitudinal talar length. When the talar dome center was posterior to the tibial axis, this measure was recorded as a negative value.
Radiographic measurement was performed with use of a custom digitizing program based on PV-WAVE® (Version 6.21, Visual Numerics, Inc., San Ramon, CA).[7] All radiographs were measured by two trained observers, and each observer performed every measurement twice. Intra-observer reliability was evaluated by linear regression between the outputs of the first and second measurements, and intra-observer error was calculated as the absolute difference between measurements. The mean values of those two trials were similarly analyzed for inter-observer reliability. Those reliability analyses were preformed separately for each group of ankles. Finally, values averaged across observers were recorded as the final measures.
The data of the control measure in non-OA ankles were similarly calculated. For assessing validity of each candidate measure, the correlation with this control measure was evaluated by linear regression.
RESULTS
The T-T ratio averaged 34.8 ± 3.8 % (mean ± standard deviation) on non-OA ankles and 37.1 ± 11.6 % on OA ankles (Fig. 1a). The P-T ratio averaged 10.2 ± 4.7 % on non-OA ankles and 12.8 ± 11.7 % on OA ankles (Fig. 1b). On three of the 35 OA radiographs, some landmarks were unidentifiable (due to complete triple fusion in two, and severe tibial shaft deformity in one, Fig. 2), and these ankles could not be measured with either of the candidate methods.
Fig. 1.
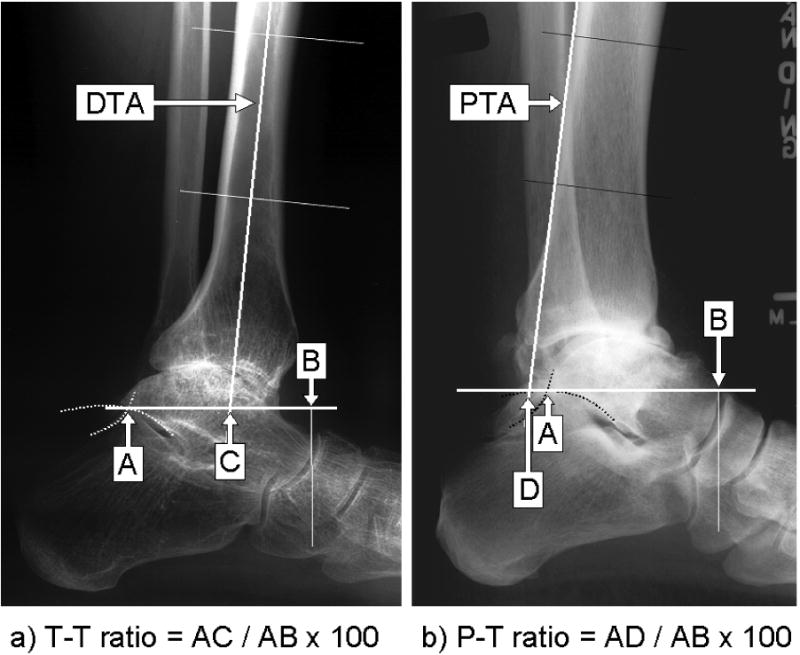
Radiographic measurement of T-T ratio (a) and P-T ratio (b) on example OA-ankle radiographs. Posterior talar point (point A) is identified as the intersection between the contours of the posterior subtalar articular surface and the postero-superior calcaneal cortex. Talar reference line (TRL) is a line through point A parallel to the floor. Anterior talar point (point B) is the vertical projection of the most anterior aspect of the talus onto the TRL. Longitudinal talar length is measured as a length AB. a) The distal tibial axis (DTA) is a longitudinal mid-bisecting line of the distal tibial shaft determined at 5 and 10 cm above the ankle. The intersection of the DTA with the TRL is point C. The T-T ratio in this case is 55.3%. b) The posterior tibial line (PTL) is a longitudinal line along the posterior tibial shaft surface, determined at the same heights. The intersection of the PTL with the TRL is point D. The P-T ratio in this case is −18.7% (Note: this measure is negative when point D is posterior to point A).
Fig. 2.

Histogram of AP tibial-talar alignment quantified by A) T-T ratio and B) P-T ratio, in thirty-three non-arthritic ankles (non-OA ankles) and thirty-two arthritic ankles (OA ankles). The height of each bar represents number of cases for which the measure is within the corresponding 5% interval range.
The T-T ratio in OA ankles was reproducibly measured, as evidenced by the coefficients of determination (R2) greater than 0.95 for either intra- or inter- observer reliability, and by inter- or intra-observer error averaging around 2 % (Table 1). In non-OA ankles, R2-values were 0.84 – 0.85. However, the associated intra- and inter-observer errors were rather smaller than the corresponding data for OA ankles. Reliability of the P-T ratio was slightly less than that of the T-T ratio, though R2-values remained greater than 0.92 with OA ankles and averaged 0.8 with non-OA ankles.
Table 1.
Reliability of the candidate measures (R-square value / mean error ± standard deviation)
| Measure | Subject | Intra-observer | Inter-observer | |
|---|---|---|---|---|
| Observer 1 | Observer 2 | |||
| T-T ratio (%) | Non-OA | 0.84 / 1.3 ± 1.2 | 0.84 / 1.2 ± 1.0 | 0.85 / 1.2 ± 1.0 |
| OA | 0.96 / 1.5 ± 1.6 | 0.97 / 2.2 ± 3.1 | 0.98 / 1.9 ± 2.1 | |
| P-T ratio (%) | Non-OA | 0.82 / 1.7 ± 1.6 | 0.78 / 1.8 ± 1.6 | 0.80 / 1.7 ± 1.4 |
| OA | 0.92 / 2.2 ± 2.1 | 0.95 / 1.9 ± 3.9 | 0.96 / 2.6 ± 3.1 | |
Correlation with the control measure was significant with either the T-T ratio (R-square = 0.60, p < 0.0001), or with the P-T ratio (R-square = 0.49, p < 0.0001) (Fig. 3).
Fig. 3.

Correlation with the control measure, with each candidate measure; A) the T-T ratio or B) the P-T ratio. On each graph, a plotted point indicates the output of the candidate measure (on the x-axis) and that of the control measure (on the y-axis), for a single non-OA ankle. The trend line by a linear regression analysis is represented as a black line, accompanied by the corresponding equation and by the coefficient of determination (R2).
DISCUSSION
High reliability of the T-T ratio was demonstrated in the measurement for OA ankles. With non-OA ankles, although the reported R2-values were smaller, this reduction is associated with the relatively narrow distribution in non-OA ankles. Indeed, the associated inter- and intra-observer errors were rather smaller in non-OA ankles than in OA ankles. The T-T ratio appears to be meaningfully reliable under clinical settings, regardless of the condition of ankle joint surface.
In the determination of the AP tibial-talar alignment of non-OA ankles, the T-T ratio showed a correlation with the control measure that directly quantified the AP orientation of the talar dome with respect to the tibia. The reported R2-value is again likely impacted by the narrow distribution of the T-T ratio in non-OA ankles. This measure appears to validly describe the AP orientation of the talus under the tibia. In clinical situations, even when the contour of the talar dome is deformed with articular degeneration, AP talar orientation can be appropriately described by the T-T ratio. This measure is capable of quantifying the magnitude of AP talar subluxation.
The T-T ratio in OA ankles was distributed more widely, including to both smaller and larger values, than in non-OA ankles. This implies that variance of the AP tibial-talar alignment is associated with articular degeneration with osteoarthritis. If the 95% confidence interval in our non-OA data (from 27% to 42%) is taken as representative of the normal range for healthy populations, five of the thirty-two OA ankles had anterior subluxation of the talus, and eleven have posterior subluxation. Either direction of subluxation is likely common in end-stage ankle osteoarthritis, and possibly plays a role in an accelerated rate of articular degeneration. To clarify this effect, longitudinal clinical investigations will be needed.
Regarding either reliability or correlation with the standard measure, the P-T ratio was slightly inferior to the T-T ratio. However, the P-T measure potentially serves as a quick means to assess AP tibial-talar alignment, especially when focusing on the intersection of the posterior tibial line with the posterior subtalar facet. Indeed, based on the 95% confidence intervals of our non-OA data (from 1% to 20%), this intersection normally should be anterior to the posterior edge of the posterior facet. If the posterior longitudinal line of the tibial shaft falls posterior to this point, the talus is likely to be anteriorly displaced.
When determining the candidate measures, the posterior end point of talus is identified not as an absolute point on a single radiographic landmark, but as a relative point where the extended contours of the subtalar articular surface and the postero-superior calcaneal cortex intersect. This definition was chosen because ankle arthritis often involves degeneration and/or dislocation of the subtalar joint, either of which obscures the posterior contour of the talus. As a result, those candidate measures are applicable to most clinical cases regardless of the condition of ankle joint surface, except in limited cases with a deformed distal tibial shaft or with a fused subtalar joint.
In conclusion, based on this study, the T-T ratio is recognized as a valid and reliable radiographic measure that is applicable regardless of ankle surface conditions. To explore the effect of AP talar subluxation on an accelerated rate of articular degeneration with osteoarthritis, or to determine the importance of implant positioning with TAR, measurement of the T-T ratio on plain lateral radiographs will serve as a reliable and practical means to assess AP ankle alignment in future scientific investigations. In the clinic, assessing the orientation of the posterior longitudinal line of the tibial shaft relative to the posterior facet of the subtalar joint helps quickly identify circumstances where the talus is anteriorly subluxated.
Acknowledgments
Financial assistance was provided by NIH Grant AR48939.
References
- 1.Conti SF, Wong YS. Complications of total ankle replacement. Clin Orthop. 2001;391:105–114. doi: 10.1097/00003086-200110000-00011. [DOI] [PubMed] [Google Scholar]
- 2.Myerson MS, Mroczek K. Perioperative complications of total ankle arthroplasty. Foot Ankle Int. 2003;24:17–21. doi: 10.1177/107110070302400102. [DOI] [PubMed] [Google Scholar]
- 3.Pyevich MT, Saltzman CL, Callaghan JJ, Alvine FG. Total ankle arthroplasty: A unique design. J Bone Joint Surg. 1998;80-A:1410–1420. [PubMed] [Google Scholar]
- 4.Saltzman CL, Tochigi Y, Rudert MJ, McIff TE, Brown TD. The effect of Agility ankle prosthesis misalignment on the peri-ankle ligaments. Clin Orthop. 2004;424:137–42. doi: 10.1097/01.blo.0000132463.80467.65. [DOI] [PubMed] [Google Scholar]
- 5.Takakura Y, Tanaka Y, Kumai T, Tamai S. Low tibial osteotomy for osteoarthritis of the ankle; results of a new operation in 18 patients. J Bone Joint Surg. 1995;77-B:50–54. [PubMed] [Google Scholar]
- 6.Tochigi Y, Rudert MJ, Brown TD, McIff TE, Saltzman CL. Effect of implantation accuracy on functional range of motion of the Scandinavian Total Ankle Replacement. J Bone Joint Surg (Br) doi: 10.1302/0301-620X.87B5.14872. Accepted, Aug. 2004. [DOI] [PubMed] [Google Scholar]
- 7.Tochigi Y, Suh J, Amendola A, Pedersen DR, Saltzman CL. Tibial-Talar Alignment on Lateral Radiographs: Part 1: Tolerance of Measures to Perturbations of Ankle Positioning. Foot Ankle Int. doi: 10.1177/107110070602700202. Submitted simultaneously with this paper. [DOI] [PMC free article] [PubMed] [Google Scholar]
- 8.Wagner KS, Tarr RR, Rensick C, Sarmiento A. The effect of simulated tibial deformities on the ankle joint during the gait cycle. Foot Ankle. 1984;5:131–141. doi: 10.1177/107110078400500306. [DOI] [PubMed] [Google Scholar]