

SUMMARY
Stem cells are thought to balance self-renewal and differentiation through asymmetric and symmetric divisions, but whether such divisions occur during hematopoietic development remains unknown. Using a Notch reporter mouse, in which GFP acts as a sensor for differentiation, we image hematopoietic precursors and show that they undergo both symmetric and asymmetric divisions. In addition we show that the balance between these divisions is not hardwired but responsive to extrinsic and intrinsic cues. Precursors in a prodifferentiation environment preferentially divide asymmetrically, whereas those in a prorenewal environment primarily divide symmetrically. Oncoproteins can also influence division pattern: although BCR-ABL predominantly alters the rate of division and death, NUP98-HOXA9 promotes symmetric division, suggesting that distinct oncogenes subvert different aspects of cellular function. These studies establish a system for tracking division of hematopoietic precursors and show that the balance of symmetric and asymmetric division can be influenced by the microenvironment and subverted by oncogenes.
INTRODUCTION
Stem cells and progenitors have the ability to give rise to differentiated cells while at the same time maintaining a pool of immature cells. It has been speculated that one way in which cells can balance renewal with commitment is via control of asymmetric and symmetric division (Morrison and Kimble, 2006). During asymmetric division, one daughter cell remains a stem cell, while the other becomes committed. In contrast, during symmetric divisions, a stem cell divides to become two stem cells (symmetric renewal) or two committed cells (symmetric commitment). When stem cells divide asymmetrically, tissues maintain a constant number of stem cells while allowing a progressive increase in the number of differentiated cells. Conversely, symmetric renewal divisions allow expansion of the immature stem or precursor pool, whereas symmetric commitment divisions allow only differentiated cells to be generated.
That precursor cells can proceed through asymmetric or symmetric division has been best demonstrated in invertebrates. For example, in the Drosophila germline, stem cells near the “hub cell” divide asymmetrically with the daughter cell that maintains contact with the hub remaining a stem cell and the daughter that is displaced away becoming a committed cell. The result of the displacement is a reduced ability to access the signals at the hub such as the soluble ligand Unpaired, which in part controls the maintenance of the stem cell (Yamashita et al., 2003). Similarly in the Drosophila nervous system, the neuroblast divides along its apical-basal axis such that the apical daughter remains a neuroblast and the basal daughter becomes a ganglion mother cell that generates differentiated progeny. This type of cell division is associated with the asymmetric distribution of Numb and Prospero, which act as determinants of the differentiated basal daughter cell (Jan and Jan, 1998; Knoblich et al., 1995). In addition to undergoing asymmetric division, stem cells can also divide symmetrically. For example, in the C. elegans germline, two stem cells give rise to several thousand germ cells through a series of symmetric divisions (Crittenden et al., 2006).
In contrast to what is known about symmetric and asymmetric divisions in invertebrates, very little is known about the division patterns in most mammalian systems. In particular, it is unclear whether hematopoietic stem and progenitor cells proceed through asymmetric divisions, symmetric divisions, or some combination thereof. It is also unknown whether extrinsic and intrinsic signals that regulate differentiation, self-renewal, or transformation do so by modulating the distribution patterns of symmetric and asymmetric cell divisions or solely by altering the rate of growth and survival of cells with specific fates. Here we address these fundamental questions by utilizing transgenic Notch reporter (TNR) mice, in which GFP fluorescence indicates the status of Notch signaling (Duncan et al., 2005). In these mice, GFP is highly expressed in populations enriched for hematopoietic stem cells (HSCs) and downregulated as these cells differentiate (Duncan et al., 2005), allowing GFP to serve as a sensor of the undifferentiated state. Using cells from the TNR mice, we have employed time-lapse microscopy to trace hematopoietic precursor division and define whether the pattern and rate of division change in the context of different microenvironments. We find that when hematopoietic precursor cells undergo division they do so through a combination of asymmetric and symmetric divisions. When these precursors are placed on stroma that induce differentiation, they predominantly use asymmetric divisions or symmetric commitment divisions; in contrast, when they are placed on stroma that promote maintenance of immature cells, they proceed predominantly through symmetric renewal divisions.
As transformation by oncogenes represents a dysregulated form of self-renewal (Reya and Clevers, 2005; Reya et al., 2001), we also tested whether oncogenes can influence the balance of symmetric and asymmetric division. BCR-ABL, which promotes chronic myelogenous leukemia (CML), had a strong influence on cell proliferation and cell survival but not on the pattern of cell division; in contrast, NUP98-HOXA9, which is associated with acute myeloid leukemia (AML), caused a significant shift in the pattern of division but little change in proliferation or cell survival. This work not only establishes a system by which division patterns of early hematopoietic precursor cells can be tracked in real time but also demonstrates that such division patterns are not hardwired but responsive to both intrinsic and extrinsic signals. Importantly, our work also shows that the mechanisms by which oncogenes transform cells vary, with some predominantly controlling cell proliferation and survival and others altering the balance between symmetric and asymmetric division.
RESULTS
The GFP Intensity of Cells from TNR Mice Functions as an Indicator of the Undifferentiated State
In previous studies, we have shown that 40%–60% of HSCs derived from TNR mice (Mizutani et al., 2007) express GFP; in contrast, GFP expression is downregulated in lineage-positive differentiated hematopoietic cells (Duncan et al., 2005). Because GFP expression in these cells acts as an indicator of the undifferentiated state, we postulated that GFP could be used to image immature cells undergoing division in real time. We first confirmed that GFP+ cells from TNR mice that also expressed c-Kit and Sca-1 and had low to negative expression of lineage markers (GFP+KLS) were enriched for functional HSCs. As shown in Figures 1A–1C, we found that the GFP+KLS cells are capable of long-term reconstitution of the hematopoietic system in both primary and secondary transplants (Figures 1A–1C). We next examined whether these GFP+ cells downregulate GFP when they differentiate in vitro, as they do in vivo (Duncan et al., 2005). For this purpose, we not only utilized cells that were GFP+KLS cells but also excluded cells that were positive for CD34 expression to further enrich for HSCs (Osawa et al., 1996). We refer to this c-kit+ Lin−/lo Sca-1+CD34− population as GFP+KLSC. Sorted GFP+KLSC cells cultured on a monolayer of 7F2 stromal cells (Thompson et al., 1998) for 3 days predominantly gave rise to GFP− cells (Figure 1D). We then analyzed the cells that remained GFP+ as well as those that had become GFP− to determine the differentiation state of each population. At the beginning of culture, sorted cells were uniformly low or negative for Lineage markers (Figure 1E) and expressed c-kit (Figure 1F). After 3 days, the majority of cells that had become GFP− also expressed lineage markers (Figure 1G) and lost c-kit expression (Figure 1H). In contrast, the majority of cells that remained GFP+ continued to lack lineage markers and express c-kit (Figures 1G and 1H). This indicated that loss of GFP in vitro correlated with phenotypic differentiation.
Figure 1. GFP+ Cells Are Phenotypically More Immature Than GFP− Cells.
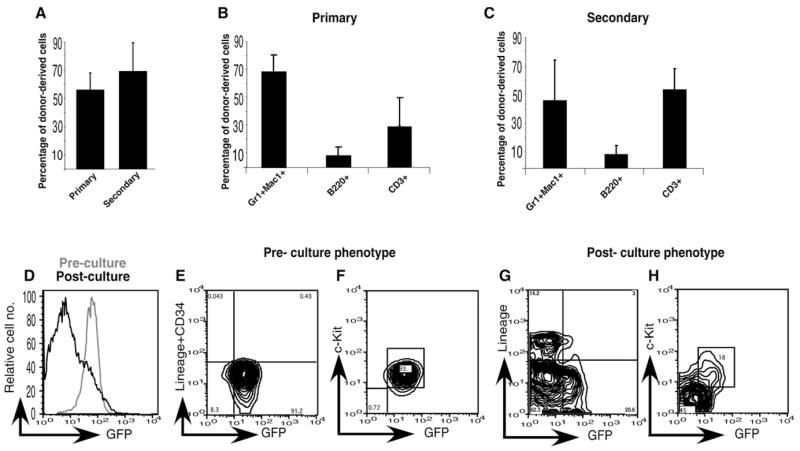
(A–C) GFP+KLS cells from TNR mice are highly enriched for hematopoietic stem cells. Five-hundred GFP+KLS cells were transplanted into recipient mice (six per cohort), and peripheral blood was analyzed for donor derived chimerism ([A], left) by FACS at 15 weeks. (A) Right, two million bone marrow cells from primary transplanted mouse were transplanted to recipient mice (six mice per cohort), and total donor chimerism was analyzed at 15 weeks. (B and C) Multilineage repopulation was determined by analysis of peripheral blood with antibodies to distinct lineage markers. Primary transplantation results shown are an average of four independent experiments. Secondary transplantation results shown are an average of three independent experiments.
(D) FACS analysis of GFP levels of GFP+KLSC cells sorted from TNR mice before (gray) and after (black) culture with stromal cells.
(E–H) Expression of GFP, Lineage, and c-kit on GFP+KLSC cells before (E and F) and after (G and H) culture.
Error bars represent standard deviation.
To confirm that the differential phenotype of the GFP+ and GFP− cells after culture reflected their functional status, we compared the ability of GFP+ or GFP− cells to form colonies in methylcellulose. GFP+ cells formed 14-fold more colonies than GFP− cells (Figure 2A, p < 0.007), suggesting that greater numbers of functionally primitive cells reside in the GFP+ fraction. We confirmed this by using the colony-forming unit-spleen (CFU-S) assay, which provides an in vivo measure of the frequency of primitive cells in a population (Till and McCulloch, 1961). We transplanted equal numbers of GFP+ or GFP− cells into lethally irradiated recipients to determine the number of colonies formed by each population in vivo. CFU-S colonies formed after 8 days are derived mainly from more differentiated cells, whereas colonies formed after 12 days are derived from more primitive cells. Whereas we did not observe any differences in d8 colonies formed by the two populations (data not shown), GFP+ cells gave rise to 7-fold more d12 colonies than GFP− cells (Figures 2B and 2C) (p < 0.0001), again suggesting that greater numbers of functionally primitive cells reside in the GFP+ fraction.
Figure 2. GFP+ Cells Are Functionally More Immature Than GFP− Cells.
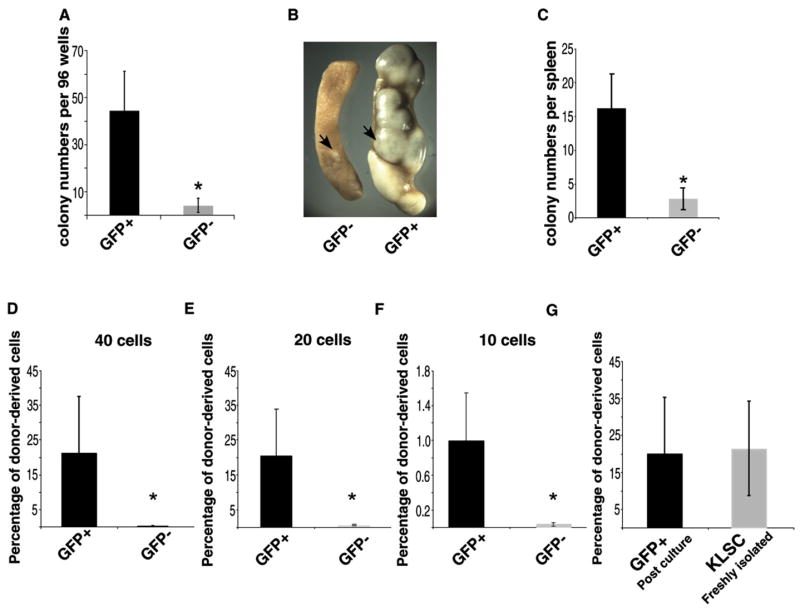
(A) GFP+KLSC cells were cocultured with 7F2 cells. Subsequently, single-sorted GFP+ or GFP− cells were cultured in methylcellulose in individual wells of a 96-well plate and colonies counted after 7 days. Average colony number per plate is shown. Results shown are an average from four independent experiments (p = 0.007).
(B and C) GFP+KLSC cells were cocultured with 7F2 cells, and subsequently, 800 GFP+ or GFP− cells were transplanted into lethally irradiated mice to assess their ability to form d12 colony-forming unit-spleen (CFU-S). Representative spleens from mice transplanted with GFP− and GFP+ cells (B) and average colonies per spleen in each group are shown (C) (p < 0.0001). Results are representative of three different experiments with three or five mice per group.
(D–F) GFP+KLSC cells were cocultured with 7F2 cells for 2 days and transplanted in limiting numbers to determine the relative transplantation efficiency of GFP+ and GFP− cells. 40, 20, and 10 GFP+ or GFP− cells were sorted and transplanted into sublethally irradiated Rag2−/− IL2rγ−/− mice. Average donor chimerism in mice is shown at 13–15 weeks after transplantation. (Results are representative of two independent experiments with three mice per cell dose for a total of 18 mice per experiment [p < 0.05].)
(G) Comparative repopulation ability of postculture GFP+ cells to freshly isolated KLSC cells. Forty KLSC and 40 postculture GFP+ cells (also shown in [D]) were transplanted into recipient mice (three or six mice per cohort), and the average donor-derived chimerism was determined by analyzing the peripheral blood at 15 weeks. Data are representative of two independent experiments.
Error bars represent standard deviation.
We also compared the reconstitution efficiency of GFP+ and GFP− cells by transplanting equivalent numbers of GFP+ or GFP− cells into lethally irradiated mice. We specifically tested whether stem cell activity could be detected in the GFP+ population at limiting numbers. To this end, we transplanted 40, 20, or 10 cells into lethally irradiated hosts. We detected donor-derived chimerism at each of these doses from the GFP+ fraction, but not from the GFP− fraction (Figures 2D–2F). In addition, the reconstitution ability of postculture GFP+ cells was similar to the reconstitution ability of freshly isolated KLSC cells (Figure 2G), indicating that the cells that remain GFP+ in culture are enriched for HSCs at a level comparable to freshly isolated HSCs. These data indicate that in vitro culture of GFP+KLSC cells leads to generation of GFP− cells that are more differentiated, and lend credence to the use of GFP as a fluorescent sensor of the differentiation state of hematopoietic cells. Although we cannot completely rule out the possibility that GFP downregulation may be a stochastic event, we feel that this is unlikely because the downregulation of GFP consistently correlates with increased acquisition of a differentiated state.
Hematopoietic Precursors Undergo Both Symmetric and Asymmetric Division
To define the pattern of divisions that KLSC cells undergo, we plated them on stromal cells in glass-bottomed Petri dishes and tracked divisions by using an inverted Axiovert microscope. Multiple GFP+ targets in the dish were identified, marked, and revisited every 10 min over a period of 72 hr. To facilitate tracking of cells, particularly when GFP expression was downregulated, we either visualized them in DIC or infected them with a viral vector expressing CFP.
We focused specifically on GFP+ cells as they underwent division to determine whether they give rise to two GFP− daughter cells (symmetric commitment), two GFP+ daughter cells (symmetric renewal), or one GFP− and one GFP+ daughter cell (asymmetric division) (Figures 3A–3C). Our first observation was that immature hematopoietic precursors are capable of all three types of division. Cells undergoing symmetric commitment (Figure 3D) can be seen dividing (Figure 3E) and downregulating GFP in both daughter cells (Figure 3F and Movie S1, in the Supplemental Data available with this article online). Cells undergoing symmetric renewal (Figure 3J) can be seen dividing (Figure 3K) and maintaining equivalent levels of GFP in both daughters (Figure 3L and Movie S3). Finally, cells undergoing asymmetric division (Figure 3P) can be seen dividing (Figure 3Q) and downregulating GFP in only one daughter (Figure 3R and Movie S5). The GFP pixel intensity unit (PIU) that was used as the objective criterion to score each division (see Experimental Procedures) is shown on the right of each panel. In each case, we monitored CFP levels as a control and found they did not change significantly and in a consistent direction during these divisions (Figures 3G–3I, 3M–3O, and 3S–3U and Movies S2, S4, and S6). Cumulatively, these data indicate that hematopoietic precursors could undergo both symmetric and asymmetric divisions.
Figure 3. Time-Lapse Imaging of Hematopoietic Precursor Divisions.
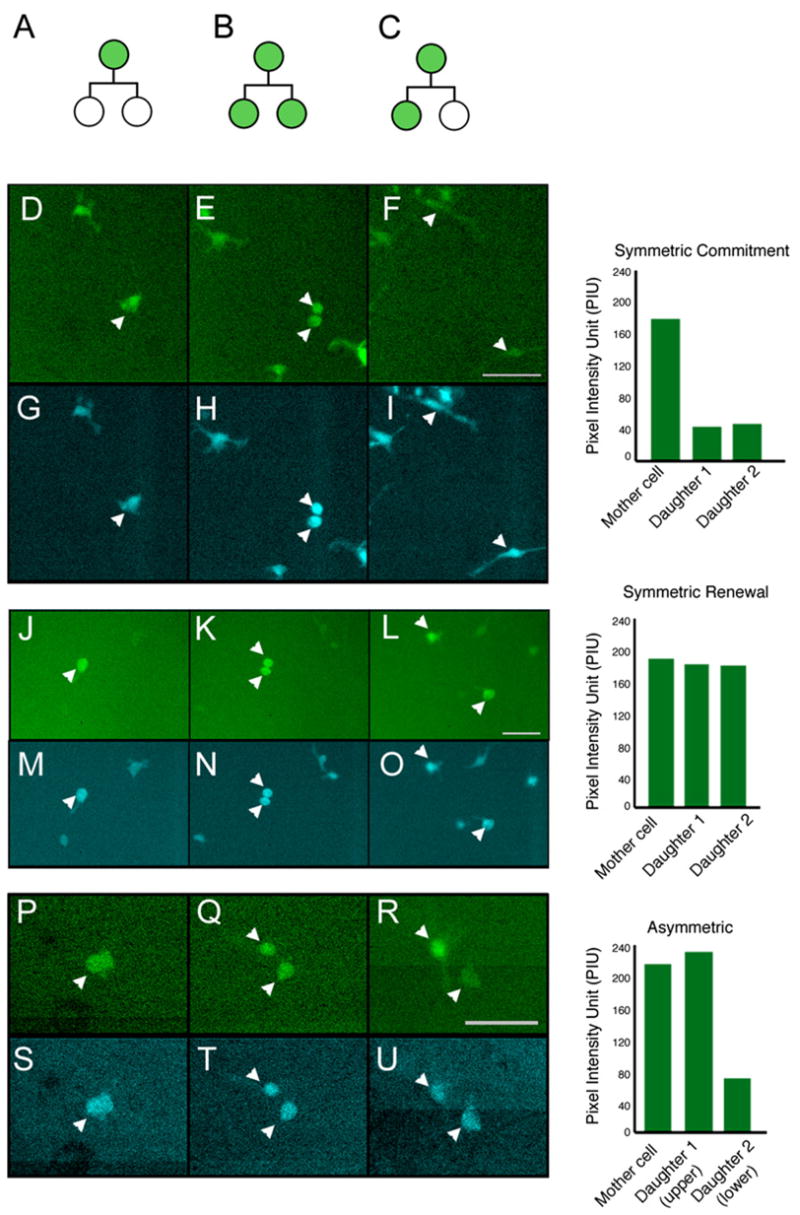
(A–C) Schematic shows three possible division patterns of hematopoietic precursors: symmetric commitment (A), symmetric renewal (B), and asymmetric division (C).
(D–U) Representative still frames of GFP+KLSC cells undergoing distinct patterns of divisions (corresponding movies shown in Movies S1–S6). GFP+KLSC cells were infected with MSCV-IRES-CFP virus, KLS CFP+ GFP+ resorted, and plated on 7F2s for imaging. Upper frames show GFP images, and lower frames show CFP images. (D–I) Symmetric commitment division. A mother cell, shown in (D) (pixel intensity unit [PIU] = 179), divides to produce two daughters (E), which downregulate GFP ([F], PIU = 46, 42). CFP intensity of the daughters (G–I) remains similar to their mother. (J–O) Symmetric renewal division. A mother cell ([J], PIU = 189) divides to produce two daughters (K) that retain GFP levels equivalent (L, PIU = 183, 180) to that of their mother. CFP intensity of the daughters (M–O) remains similar to their mother. (P–U) Asymmetric cell division. A mother cell ([P], PIU = 220) divides to produce two daughters with equivalent GFP intensity ([Q], PIU = 210); subsequently, the GFP expression of one of the daughters is downregulated ([R], PIU = 71) relative to the mother and the other daughter (PIU = 237). CFP intensity of the daughters (S–U) remains similar to their mother. Bar graphs show GFP PIU of mother cell in first panel and PIU of daughters in last panel.
Numb Is Asymmetrically Distributed and Segregated during Hematopoietic Precursor Division
The asymmetric divisions we observed could be either due to an asymmetry that is intrinsically set up during division or a result of a symmetric division followed by asymmetric exposure to stochastic environmental cues. To differentiate between these possibilities, we examined whether we could detect any intrinsic asymmetric distribution of determinants of differentiation. Because very little is known about asymmetric protein distribution in hematopoietic cells, we used a candidate gene approach and examined genes that are known to influence asymmetric division in Drosophila. Specifically we chose to examine the distribution of Numb, an adaptor protein that has been shown to inhibit Notch signaling (Guo et al., 1996; Wakamatsu et al., 1999) and has been implicated in the asymmetric division of several cell types, most notably of Drosophila neuroblasts (Cayouette and Raff, 2002; Zhong et al., 1996; Chang et al., 2007). We first analyzed whether Numb was asymmetrically localized in dividing KLSC cells. We isolated KLSC cells, cultured them in the presence of growth factors, and examined Numb distribution in cells actively undergoing division. In order to observe a significant number of cells undergoing mitosis, we treated the cells with nocodazole to arrest cells in mitosis. The dose of nocodazole that is typically used (De Brabander et al., 1981) had to be lowered significantly (to 10 nm) to avoid toxicity for HSCs. The use of a low dose is most likely the reason why we observed a significant number of cells escaping into telophase. Using immunofluorescence, we found that Numb was either symmetrically or asymmetrically distributed in cells undergoing division. While 56% showed equivalent distribution of Numb between the two incipient daughters (Figures 4A and 4B), 44% of dividing cells displayed preferential localization of Numb to one incipient daughter at various stages of mitosis (Figures 4C and 4D). In both cases of symmetric and asymmetric Numb distribution, we observed different patterns of localization of Numb ranging from a clear crescent at the cell cortex to punctate cytosolic staining; although the significance of the different localization patterns is not fully clear, they appeared to correlate at least to some extent with the different phases of mitosis (Figure S1). To rule out any possible effects of nocodazole on asymmetric Numb distribution, we also stained HSCs for Numb in the absence of nocodazole and found a similar distribution (46% n = 43, data not shown). Finally, to control for the possibility that Numb may segregate differentially solely due to differential membrane distribution in daughter cells, we costained for Numb and the general membrane marker pan-cadherin. As shown in Figures 4E and 4F, a majority of cells (61%, n = 57) that show asymmetric distribution of Numb do not show the same asymmetric distribution of pan-cadherin. In addition in the other 39% of the cells where the membrane was unevenly distributed in the two prospective daughters, pan-cadherin distribution did not colocalize to the specific domains of Numb expression. This suggests that the differential levels of Numb in the two daughters is unlikely to be a reflection purely of greater amounts of membrane in one prospective daughter versus another. We next tested whether this asymmetric distribution resulted in Numb being differentially segregated between GFP+ and GFP− cells. We thus cultured GFP+KLS cells for 2 days and found that in a majority of cells analyzed levels of Numb were significantly lower in the GFP+ progeny and preferentially segregated to the GFP− progeny (Figures 4G and 4H). Given that the GFP− population is enriched for differentiated cells (Figures 1 and 2), this suggested that Numb was segregating at a higher level into differentiated cells. To determine whether this differential expression could be functionally relevant, we tested whether the increased expression of Numb could influence either Notch activity or differentiation. We first retrovirally overexpressed Numb::CFP or a control CFP vector in GFP+KLSC cells and found that Numb overexpression significantly reduced the frequency of cells responding to Notch (from 80% to 36%; Figures 4I and 4J). Additionally, we found that Notch reporter activity was progressively more repressed with increasing expression of Numb (Figures 4K–4P). To test if Numb can functionally influence the differentiation status of hematopoietic cells, we retrovirally overexpressed Numb::GFP or a control GFP vector in KLSC cells and analyzed the frequency of immature cells at the end of the culture period. Interestingly the cells carrying Numb had 4-fold fewer lineage-negative cells compared to control infected cells (Figure 4Q). These data suggest that the asymmetric segregation of Numb may functionally result in inhibition of Notch signaling and a more differentiated state. These data also indicate that the asymmetric divisions observed in KLSC cells are associated with asymmetric distribution and segregation of Numb, and suggest that the asymmetry is at least in part intrinsically determined.
Figure 4. Numb Is Asymmetrically Distributed and Segregated during Hematopoietic Precursor Division.

(A–D) GFP+KLSC cells were cultured overnight, treated with nocodazole, and subsequently stained to visualize Numb distribution. (A) Symmetric distribution of Numb in cells undergoing division (representative of 56% of dividing cells, n = 48). DAPI staining is shown in (B). (C) Asymmetric distribution of Numb in cells undergoing division (representative of 44% of dividing cells, n = 48). DAPI staining is shown in (D).
(E and F) GFP+KLSC cells were cultured overnight, treated with nocodazole, and stained for Numb (red, left panels) and pan-cadherin (blue, right panels), n = 57 from three independent experiments.
(G and H) GFP+KLSC cells were cultured on 7F2 cells and subsequently stained with antibodies to Numb (G) and GFP (H).
(I and J) GFP+KLSC cells were infected for 48 hr with MSCV-Numb::CFP or MSCV-CFP as a control. After infection, cells were cocultured with 7F2 cells for 3 days and subsequently analyzed by FACS to determine GFP reporter expression in cells expressing either control (I) or Numb (I) vectors.
(K–P) Increased repression of Notch reporter activity with increasing levels of ectopic Numb expression. GFP levels in cells that were either negative (K and L), low (M and N), or high (O and P) for control vector or Numb expression. Results are representative of two independent experiments.
(Q) KTLS cells from wild-type mice were infected for 36 hr with MSCV-Numb::GFP or MSCV-GFP as a control. After infection, GFP+KLS cells were resorted, cocultured with 7F2 cells, and lineage marker expression analyzed. Average frequency of Lin− cells over four independent experiments (p = 0.02).
Error bars represent standard deviation.
Distinct Microenvironments Influence the Balance of Symmetric and Asymmetric Division
Although the above data show that hematopoietic precursors can undergo both symmetric and asymmetric divisions, it remained unclear whether the precise balance of asymmetric and symmetric division was intrinsically encoded in hematopoietic precursors or if it could be altered by extrinsic cues. To address this issue, we compared the division patterns of KLSC cells plated on two different types of stroma: 7F2 and OP9. 7F2 cells are an osteoblastic cell line isolated from p53−/− mice (Thompson et al., 1998). When KLSC cells were cultured on 7F2 cells, only 34% remained GFP+ and Lin−/lo, suggesting that 7F2 cells preferentially induce differentiation of hematopoietic precursors (Figure 5A, left). OP9 cells are derived from op/op mice that genetically lack M-CSF (Nakano et al., 1994). These cells can support embryonic stem cell differentiation to hematopoietic cells and can maintain HSC fate in vitro (Ueno et al., 2003). Consistent with these reports, 65% of KLSC cells plated on an OP9 monolayer remained GFP+ and Lin−/lo after 72 hr (Figure 5A, right). The cells that remain GFP+ in these cultures most likely have the ability to respond to the Notch ligands expressed on the stroma as well as neighboring HSC (Figure S2).
Figure 5. Distinct Stromal Cells Differentially Influence the Balance of Asymmetric and Symmetric Division of Hematopoietic Precursors.
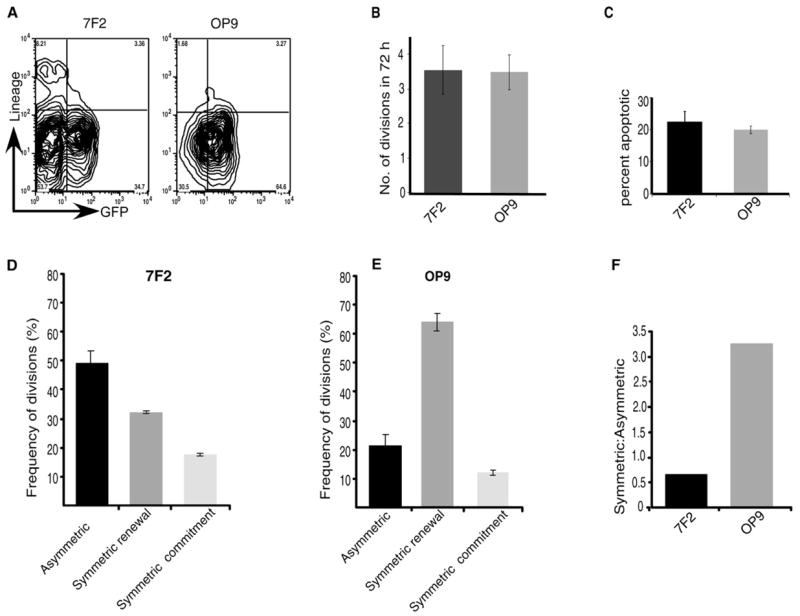
(A) GFP+KLSC cells were sorted and plated on 7F2 or OP9 cells for 72 hr, and their phenotype was analyzed by FACS.
(B) Rates of cell divisions of KLSC cells on 7F2 and OP9 were monitored by counting the number of times a cell divided in a given time period using time-lapse imaging. The division time was averaged from scoring 112 cells cultured in 7F2 and 104 cells cultured in OP9 cells (from three independent experiments).
(C) Apoptosis rates of KLSC cells on 7F2 and OP9 were determined by analyzing by time-lapse microscopy the number of cells that underwent cell fragmentation postdivision.
(D–F) Frequency of cells undergoing asymmetric, symmetric renewal or symmetric commitment division on 7F2 or OP9 cells scored over a period of 72 hr by time-lapse microscopy. Total numbers of cells tracked in 7F2 cultures were 112, and in OP9 cultures were 104. Data shown are an average of three independent experiments. The difference in the frequency of symmetric renewal and asymmetric divisions between OP9 and 7F2 was significant (p = 0.012 and p = 0.00019, respectively). Relative ratios of symmetric:asymmetric division on 7F2 or OP9 cells (F).
Error bars represent standard deviation.
One explanation for the distinct differentiation outcomes observed on 7F2 and OP9 cells could be that uncommitted cells divide at different rates on the different stromal cells. For example, if symmetric renewal divisions occurred faster on OP9 than on 7F2, this could also lead to an increased proportion of undifferentiated cells at any one time. We thus examined both the division rates and the division pattern of cells plated on these distinct stroma and found that the division rate of cells cultured on 7F2s was similar to that of cells cultured on OP9s (Figure 5B). In addition, the frequency of cell death was also similar between these conditions (Figure 5C), and the division rate of symmetric and asymmetric divisions on both the stromal layers was also equivalent (data not shown). In contrast, the distribution of symmetric and asymmetric division was markedly different. Whereas KLSC cells plated on 7F2 cells primarily underwent asymmetric division (Figure 5D), those on OP9 cells primarily underwent symmetric renewal divisions (Figure 5E). Thus KLSC cells in contact with 7F2 cells divided through asymmetric division twice as often as symmetric renewal, whereas those on OP9 cells divided through symmetric renewal 3.5 times more often than through asymmetric division (Figure 5F). The differential patterns of division also correlated with differential distribution of Numb in HSCs placed on 7F2 and OP9 cells, with cells on OP9 displaying a lower frequency of asymmetric distribution than those on 7F2 (Figure S3). That changes in the balance of symmetric and asymmetric division can lead to altered rates of differentiation of daughter cells was also confirmed via mathematical modeling (Figure S4). These data reveal that the different environments encourage different outcomes, not by governing rates of division, but rather by shifting the balance between asymmetric and symmetric division.
Distinct Oncogenes Influence the Balance of Symmetric and Asymmetric Division
It is well known that oncogenes can influence the process of transformation by enhancing cell growth and survival. However, whether they also subvert the balance of symmetric and asymmetric division is unknown. To address this issue, we first tested the effects of BCR-ABL, a translocation product predominantly associated with chronic myelogenous leukemia (CML) (Nowell and Hungerford, 1960). This translocation results from the fusion of the breakpoint cluster region (BCR) serine/threonine kinase gene on chromosome 9 with the c-abl tyrosine kinase gene on chromosome 22. We thus infected GFP+KLSC cells from TNR mice with either a control retroviral construct or a construct carrying BCR-ABL. The viral constructs included a CFP sequence so that the infected cells could be sorted and tracked by CFP expression. After infection, KLS CFP+GFP+ cells were resorted and plated on 7F2 cells, and the rates of cell division, extent of cell death, and pattern of cell division were monitored and quantified. As predicted by the literature, BCR-ABL-infected cells divided twice as frequently as vector-infected cells (Figure 6A) and underwent apoptosis at half the rate of vector-infected cells (Figure 6B), indicating that BCR-ABL promotes proliferation and survival (Amarante-Mendes et al., 1998; Daley et al., 1990). We next tested the distribution of symmetric and asymmetric divisions in both control and BCR-ABL-infected cells. Similar to uninfected cells, HSCs infected with control viruses divided primarily through symmetric commitment and asymmetric divisions (Figure 6C). Interestingly, the expression of BCR-ABL did not significantly change the distribution of symmetric and asymmetric division (Figure 6D). This suggested that, although BCR-ABL can influence the frequency of cell division and survival of the target cell, it does not significantly influence the choice the cell makes between symmetric and asymmetric division.
Figure 6. BCR-ABL Expression Does Not Influence the Balance between Asymmetric and Symmetric Division.
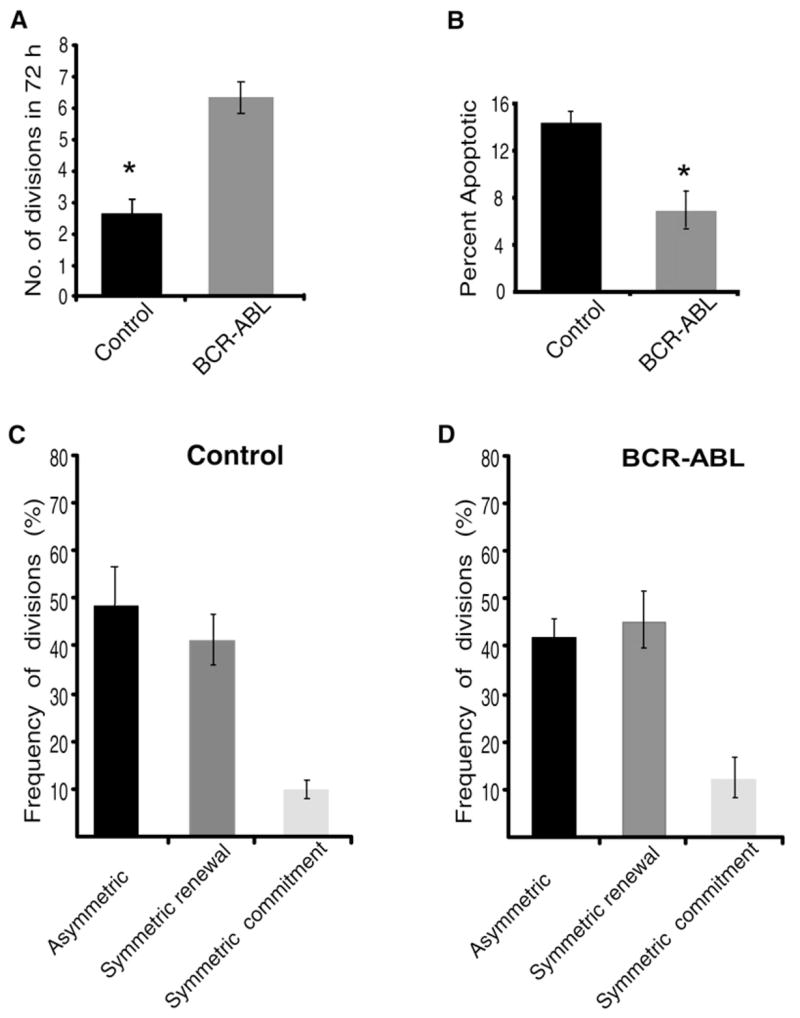
GFP+KLSC cells were sorted from TNR mice and infected with viruses carrying control vector-IRES-CFP or BCR-ABL-IRES-CFP. After infection, KLS CFP+ GFP+ cells were resorted, plated on 7F2 cells, and imaged for 72 hr.
(A) Rate of cell division of vector or BCR-ABL-infected KLS cells were monitored by counting the number of times a given cell divided in a 72 hr period. The division time was averaged from 78 and 89 cells respectively (n = 3). Frequency of divisions of BCR-ABL-infected KLSC cells was significantly higher than vector-infected KLSC cells (*p = 0.038).
(B) Apoptosis rate of vector-infected or BCR-ABL-infected KLSC cells was determined as in Figure 5C (n = 3, p = 0.040).
(C and D) Frequency of vector-infected or BCR-ABL-infected cells undergoing asymmetric, symmetric renewal or symmetric commitment division were scored over a period of 72 hr by time-lapse microscopy. Data shown are derived from 78 vector-infected and 89 BCR-ABL-infected cells, and is an average of three independent experiments. The difference in frequency of symmetric renewal divisions between vector and BCR-ABL is not significant (p = 0.392).
Error bars represent standard deviation.
We next tested the effects of the fusion protein NUP98-HOXA9 on asymmetric and symmetric division. NUP98-HOXA9 occurs as a consequence of the t(7:11) translocation and contains a transcriptional activation domain encoded by the Nucleoporin 98 protein fused to the transcription factor HOXA9 (Borrow et al., 1996; Nakamura et al., 1996). NUP98-HOXA9 translocations are associated with acute myelogenous leukemia (AML) as well as the blast crisis phase of CML (Ahuja et al., 2001; Nishiyama et al., 1999; Yamamoto et al., 2000). To test the effects of NUP98-HOXA9 on cell-division rate and pattern, we infected GFP+KLSC cells with either a control or a NUP98-HOXA9 viral construct linked to an IRES-CFP. Infected cells were sorted based on CFP expression and plated on 7F2 cells, and rate of division, cell death, and division pattern were monitored and quantified. The rate at which the NUP98-HOXA9-infected cells divided was not significantly faster than the rate at which control infected cells divided (Figure 7A, n = 63). In addition, the frequency of cells that underwent apoptosis was similar for vector-infected and NUP98-HOXA9-infected cells (Figure 7B). In contrast, NUP98-HOXA9 expression led to a significant shift in the pattern of division (Figures 7C and 7D). Thus, while with BCR-ABL the ratio of asymmetric to symmetric renewal division was 1:1 and equivalent to control conditions, the presence of NUP98-HOXA9 led to 2.5 times more symmetric renewal divisions compared to asymmetric divisions (Figure 7E). Importantly the subversion of the normal balance of symmetric and asymmetric division may explain why NUP98-HOXA9 causes the preferential growth of immature precursors that occurs in acute myeloid leukemias while BCR-ABL allows normal levels of differentiation in chronic myeloid leukemia.
Figure 7. NUP98-HOXA9 Expression Alters the Balance between Asymmetric and Symmetric Division.

(A) Rates of cell divisions of vector-infected or NUP98-HOXA9-infected KLSC cells on 7F2 were monitored by counting the number of times a cell divided in a period of 72 hr by time lapse microscopy. The division time was averaged from 78 and 63 cells, respectively (n = 3).
(B) Apoptosis rate of vector-infected or NUP98-HOXA9-infected KLSC cells were determined as in Figure 5C.
(C and D) Frequency of vector-infected or NUP98-HOXA9-infected cells undergoing asymmetric, symmetric renewal or symmetric commitment divisions were scored over 72 hr by time-lapse microscopy. Data shown are derived from 78 vector-infected and 63 NUP98-HOXA9-infected cells, and are obtained over three independent experiments. The difference in frequency of symmetric renewal divisions between vector-infected and NUP98-HOXA9-infected cells is significant (p = 0.007).
(E) Relative ratios of symmetric:asymmetric division after expression of BCR-ABL or NUP98-HOXA9. Error bars represent standard deviation.
DISCUSSION
Although it has long been speculated that mammalian stem cells undergo asymmetric and symmetric division, whether this actually occurs is unclear. In addition, whether microenvironments that influence stem cells to differentiate or self-renew do so by shifting the balance of asymmetric and symmetric divisions and whether the balance can also be subverted by oncogenes are fundamental questions that need to be addressed to better understand the basis of stem cell-fate decisions and oncogenic transformation.
Using a transgenic Notch reporter mouse, in which the GFP status of a cell acts as a sensor for the differentiated state, we have imaged how hematopoietic precursors divide in response to different stimuli during growth, differentiation, and oncogenic transformation. Specifically we show that the balance between asymmetric and symmetric divisions is not hardwired in precursors but instead is responsive to extrinsic and intrinsic cues. Precursors placed in a prodifferentiation environment preferentially divide through asymmetric or symmetric commitment division, whereas those placed in a prorenewal environment primarily divide through symmetric renewal divisions. Importantly, our data show that oncogenes also have the ability to influence a cell’s choice between symmetric or asymmetric division. In this context, we find that, although BCR-ABL predominantly influences a cell’s rate of division and death, NUP98-HOXA9 predominantly influences the normal balance of symmetric and asymmetric division. This suggests that different oncogenes subvert different aspects of cellular function, and an oncoprotein’s mode of action may dictate the type of leukemia it generates.
Although it is known that precursor cells in invertebrates divide by asymmetric and symmetric cell division, whether this occurs in mammalian cells, particularly in the hematopoietic system, was less clear. The fact that GFP expression correlates with an undifferentiated state in the TNR mice allowed us to develop a system to track the different outcomes of cell division in real time, thereby allowing screening and assessment of different stimuli or microenvironments without the need for any micromanipulation of progeny cells. Using this approach, we observed that, when hematopoietic precursors were placed on 7F2 cells, which induce differentiation, the cells underwent asymmetric division twice as often as symmetric renewal divisions. By contrast, when placed on OP9 cells, which promote the maintenance and growth of immature cells, the cells divided through symmetric renewal 2.5 times more often than asymmetric division. Interestingly, the rates of growth and death were similar on the two environments. These results suggest that one way by which the microenvironment might influence growth or differentiation is to alter the balance of symmetric and asymmetric division of hematopoietic precursors.
Previous pioneering studies in the hematopoietic system that have focused on the question of whether hematopoietic cells can undergo asymmetric division have primarily used a clone-splitting technique (Brummendorf et al., 1998; Leary et al., 1985; Suda et al., 1984). In this approach, single hematopoietic cells are cultured, their immediate progeny physically separated, and the fates of these progeny tracked by assays that measure the rate of proliferation or colony formation. This approach revealed that in cultured human cord blood hematopoietic progenitors 3%–17% of the divisions were asymmetric and that the division pattern was not influenced by exposure to different cytokines (Mayani et al., 1993). A similar lack of influence of cytokines was observed in CD34+ cells from human fetal liver where the rate of cell division was used as to track whether paired daughter cells behaved differently (Huang et al., 1999). These data indicate that the decision between different types of division may not be controlled by extrinsic regulatory molecules but rather by intrinsic mechanisms. However, experiments using more purified mouse CD34-KLS cells (Osawa et al., 1996) have shown that culture with cytokines such as SCF and IL3, which induce greater levels of differentiation, led to asymmetric divisions in 52%–62% of the cells, whereas culture with cytokines such as SCF and Tpo, which tend to preserve undifferentiated cells, led to asymmetric division in only 17% of the cells (Takano et al., 2004). These data suggest that cytokines that decrease differentiation do so by decreasing asymmetric division and are consistent with our findings, which show that distinct microenvironments do lead to a corresponding change in the balance of hematopoietic precursor divisions. Our work also provides a possible mechanism underlying the choice between symmetric and asymmetric fates by showing that asymmetric divisions correspond to asymmetric distribution and segregation of Numb. Although our data also show that increased Numb can contribute to specification of the differentiated daughter cell, it is likely that multiple other molecules are involved in this asymmetric division event, and a complete elucidation of the relevant pathways will be an important area of future work. In this regard, it is important to point out that it has recently been reported that primitive human hematopoietic cells asymmetrically segregate proteins such as CD63 and CD71 during mitosis (Beckmann et al., 2007). Together with our work, this suggests that the intrinsic segregation of a variety of protein determinants likely plays a role in fate specification of both mouse and human HSCs.
Using our imaging system, we have also found that oncogenes can subvert the normal balance of asymmetric and symmetric division. Interestingly, although the oncoprotein BCR-ABL had a clear impact on increasing the rate of cell division and decreasing the rate of cell death, it did not affect the choice between asymmetric and symmetric division compared to control conditions. In contrast, NUP98-HOXA9 led to a significant increase in symmetric renewal divisions but did not affect the rates of division and cell death. The differential impact of the two oncogenes may be important because BCR-ABL is mostly associated with CML, which is an indolent disease with intact differentiation. In contrast, NUP98-HOXA9 is often associated with AML and blast crisis CML, cancers that display an aggressive growth of more immature cells and reduced differentiation. It is important to note that, in mouse models, although the use of BCR-ABL recapitulates CML-like disease, NUP98-HOXA9 leads to a myelo-proliferative disease that progresses later to clonal AML. In addition, NUP98-HOXA9 can cooperate with BCR-ABL to lead to blast crisis phase of CML (Dash et al., 2002; Mayotte et al., 2002). It is possible that it is the differential impact of these oncogenes on the balance of asymmetric and symmetric divisions that defines the ability of BCR-ABL to induce only a chronic and differentiated disease and NUP98-HOXA9 to induce a more aggressive and undifferentiated disease.
Our work provides an important mammalian complement to studies of Drosophila neuroblasts that have examined the consequences of mutations of genes that are involved in asymmetric renewal on tumor formation. Neuroblasts are normally polarized along their apical-basal axis, and the apical cell becomes another neuroblast while the basal daughter becomes the ganglion mother cell that goes on to make differentiated cells. Mutations of the gene brat, which normally segregates asymetrically to specify the differentiated fate, lead to unregulated growth of two uncommitted daughter cells and subsequent tumorigenesis (Betschinger et al., 2006; Lee et al., 2006). In addition, altering asymmetric division of neuroblasts by mutating the asymmetrically distributed protein Numb, Miranda, or prospero leads to overgrowth of neuroblasts and subsequent formation of tumors (Caussinus and Gonzalez, 2005). These data suggest that, at least in flies, subversion of the balance between symmetric and asymmetric division is an important component of tumor growth. Our data indicate that such subversion of a normal cell-division pattern also in fact occurs during mammalian oncogenesis. However, by comparing the effects of different oncogenes, our work also suggests that the alteration of asymmetry may be specific to some oncogenes and not others, and raises the possibility that whether an oncogene alters asymmetry may dictate the type of leukemia it generates. Perhaps one of the more exciting implications of our findings is that molecules that alter the choice between symmetric and asymmetric division could be used to inhibit or slow the aggressive growth of acute leukemias. Only further work along these lines will reveal whether altering the aberrant symmetry of transformed cells can be a new target for cancer therapy.
EXPERIMENTAL PROCEDURES
Mice
CD1 wild-type mice and transgenic Notch reporter (TNR) were used at 6–8 weeks of age. Balb/C Rag2−/− IL2rγ−/− and SCID mice used as transplant recipients were >10 weeks of age. Mice were bred and maintained on acidified water in the animal care facility at Duke University Medical Center. All live animal experiments were performed according to protocols approved by the Duke University IACUC.
Cell Isolation and FACS Analysis
HSCs were sorted from mouse bone marrow, and analysis of transplanted cells was performed as described previously (Duncan et al., 2005; Osawa et al., 1996). Analysis and cell sorting were carried out on a FACSVantage (Becton Dickinson) at the Duke Cancer Center FACS facility.
Notch Ligand Analysis
KLSC cells were stained with antibodies from Santa Cruz Biotechnology: anti-Jagged1 (sc-6011), anti-Jagged 2 (sc-8158), anti-Dll 1 (sc-8155), or anti-Dll 4 (sc-18641). Total RNA was extracted from cultured OP9 and 7F2 cells with an RNeasy Mini kit (74104, QIAGEN) according to the manufacturer’s instructions. One microgram of total RNA was reverse transcribed with Superscript II Reverse Transcriptase (18064, Invitrogen). cDNA was amplified by PCR for 40 cycles (primer sequences are in the Supplemental Experimental Procedures).
In Vitro Methylcellulose Assays
GFP+KLSC cells from TNR mice were cocultured with 7F2 cells for 3 days, and the resulting GFP+ or GFP− cells were sorted at 1 cell/well and cultured in complete methylcellulose medium (Methocult GF M3434 from StemCell Technologies). Colonies were scored after 7 days of culture and identified by morphology.
In Vivo Analysis of HSC Function
GFP+KLSC cells from TNR mice were cocultured with 7F2 cells for 2 days. Subsequently, 10, 20, or 40 GFP+ or GFP− cells were transplanted into groups of Rag2−/− IL2rγ−/− hosts (three mice/dose, total of 48 over two experiments). Host mice were sublethally irradiated with 4.5 Gy by using a 200 kV X-ray machine 4 hr prior to transplantation and subsequently maintained on antibiotic water. To test the repopulating ability of GFP+KLS cells from TNR mice, 500 GFP+KLS cells were transplanted into irradiated SCID mice (4.5 Gy) with 300,000 Sca-1-depleted SCID bone marrow cells. For the secondary transplantation, 2 million BM cells from primary transplanted mouse were transplanted into SCID mice. Immunodeficient recipient mice were used because the TNR mice are on an outbred CD1 background. Transplanted mice were bled every 3 weeks and peripheral blood analyzed to determine the level of donor-derived chimerism. Donor and host cells were distinguished by expression of CD45.1 (A20, eBioscience) and CD45.2 (104, eBioscience).
Time-Lapse Imaging
GFP+KLSC cells from TNR mice were cultured on feeder cells, on glass bottomed 35 mm petri dishes. Unattended time-lapse movies of randomly chosen GFP+ HSCs were assembled with minimal intensity fluorescent excitation, provided by camera triggered and Uniblitz shuttered illumination, driven by Metamorph’s multidimensional acquisition (MDA) feature. Continuity of focus stability of movies was assured by using a temperature-stabilized Zeiss Vert200 mot, fitted with a fully enclosed Pecon XL3 incubation box and an Orca AG Fire-wire camera (Hamamatsu). Where possible, image intensity was maximized by using acceptable levels of increased camera gain and binning, consistent with generating acceptable image resolution and contrast under modest levels of illumination best tolerated by the cells. A reproducibly low and homogeneous level of illumination was provided by an X-Cite 120 liquid light guided metal halide lamp (Exfo Corp). All targets were coimaged in GFP with DIC or CFP fluorescence, using nonoverlapping widefield fluorescent filter sets (Omega Optical Corp. Battleboro, VT) to aid in cell identification. To maximize the potential of unattended data collection, multiple HSC targets in the dish were identified, marked, and revisited multiple times, utilizing the Mark and Find feature of the Metamorph MDA, over a period of 72 hr, with cultures maintained at 37°C, 5% CO2, and saturating levels of humidification. Target cells were reviewed in movie replay after data concatenation into Metamorph time-lapse stacks. To facilitate assembly of lineage trees for fate mapping of cells undergoing multiple rounds of cell division, it was sometimes necessary to stitch together adjacent image fields into larger montages (tiling in Metamorph, example shown in Figures 3P–3U) so that the fate of HSCs entering or leaving target fields of interest could be followed over time. Criteria for scoring division patterns are described in the Supplemental Experimental Procedures.
Viral Production and Infection
BCR-ABL (from W. Pear and A.M. Pendergast) was cloned into an MSCV-IRES-CFP retroviral expression vector. NUP98-HOXA9-IRES-CFP was a gift from C. Jordan and G. Gilliland. Numb cDNA (accession number BC033459, NCBI) was fused to GFP or CFP in the MSCV-GFP (or CFP) vector. VSVG pseudotyped and concentrated virus was produced, and viral infection was carried out as described in (Duncan et al., 2005). Infected cells were sorted based on KLS, GFP, and CFP expression.
Immunofluorescence Staining
GFP+KLSC-sorted cells were cultured overnight in 96-well U bottom plates in the presence of X-Vivo15, 50 mM 2-ME, 2% FBS, SLF (30 ng/ml), and Flt3L (30 ng/ml). After 12–18 hr, 10 nM nocodazole (Sigma) was added for 24 hr. Cells were collected and stained with antibodies to Numb (1:200) (ab4147, Abcam), phospho-H3 (1:200) (06-570, Upstate), or pan-cadherin (1:100) (ab6529, Abcam) and counterstained with DAPI. Secondary antibodies used: for Numb staining, donkey anti-goat Alexa Fluor 546 (Mol. Probes), and for PH3 and pan-cadherin staining, goat anti-Rabbit Alexa Fluor 350 (Mol. Probes). To examine Numb segregation into GFP+/− cells, cells were costained with anti-GFP (1:400) (A21202, Mol. Probes). In certain experiments, GFP+KLSC cells were sorted and plated on coverslips coated with 7F2 or OP9 cells, treated with nocodozole for 18–24 hr, fixed with 4% paraformaldehyde, and then stained with relevant antibodies.
Statistical Analysis
Student’s t test was utilized to determine statistical significance. P values less than 0.05 were considered significant.
Supplementary Material
Representative movie of a GFP+KLSC cell undergoing division followed by downregulation of GFP in both daughter cells ( Movie S1). CFP expression serves as a control and does not change significantly after division ( Movie S2). Cells of interest are indicated by arrowheads. Clock at bottom of movie represents culture time (hours:minutes) in 10 minute intervals.
Representative movie of a GFP+KLSC cell undergoing division followed by downregulation of GFP in both daughter cells ( Movie S1). CFP expression serves as a control and does not change significantly after division ( Movie S2). Cells of interest are indicated by arrowheads. Clock at bottom of movie represents culture time (hours:minutes) in 10 minute intervals.
Representative movie of a GFP+KLSC cell undergoing division followed by maintenance of GFP expression in both daughter cells ( Movie S3). CFP expression serves as a control and remains similar in mother and daughter cells ( Movie S4). Cells of interest are indicated by arrowheads. Clock at bottom of movie represents culture time (hours:minutes) in 10 minute intervals.
Representative movie of a GFP+KLSC cell undergoing division followed by maintenance of GFP expression in both daughter cells ( Movie S3). CFP expression serves as a control and remains similar in mother and daughter cells ( Movie S4). Cells of interest are indicated by arrowheads. Clock at bottom of movie represents culture time (hours:minutes) in 10 minute intervals.
Representative movie of a GFP+KLSC cell undergoing division followed by downregulation of GFP expression in one of the daughter cells ( Movie S5, bottom arrow). CFP expression serves as a control and remains similar in mother and daughter cells ( Movie S6). Cells of interest are indicated by arrowheads. Clock at bottom of movie represents culture time (hours:minutes) in 10 minute intervals.
Representative movie of a GFP+KLSC cell undergoing division followed by downregulation of GFP expression in one of the daughter cells ( Movie S5, bottom arrow). CFP expression serves as a control and remains similar in mother and daughter cells ( Movie S6). Cells of interest are indicated by arrowheads. Clock at bottom of movie represents culture time (hours:minutes) in 10 minute intervals.
Acknowledgments
We are grateful to Brigid Hogan for invaluable help and advice, Mike Dustin for advice on time-lapse microscopy, Gary Gilliland and Craig Jordan for providing the NUP98-HOXA9 construct, Ann Marie Pendergast and Warren Pear for providing the BCR-ABL construct, Motonari Kondo for providing Rag2−/− IL2rγ−/− mice, Alan Chen and Yin Yiu for excellent technical help, Mike Cook and Beth Harvat for cell sorting, and Anthony Means, Brigid Hogan, and Terry Lechler for critical review of the manuscript. T.R. is a recipient of a Cancer Research Institute Investigator Award, an Ellison Medical Foundation New Scholar award, and a Leukemia and Lymphoma Society Scholar Award. This work was also supported by NIH grants DK63031 and DK072234 and a Duke Stem Cell Research Program grant to T.R.
Footnotes
Supplemental Data include Supplemental Experimental Procedures, four figures, and six movies and can be found with this article online at http://www.cellstemcell.com/cgi/content/full/1/5/541/DC1/.
References
- Ahuja HG, Popplewell L, Tcheurekdjian L, Slovak ML. NUP98 gene rearrangements and the clonal evolution of chronic myelogenous leukemia. Genes Chromosomes Cancer. 2001;30:410–415. doi: 10.1002/1098-2264(2001)9999:9999<::aid-gcc1108>3.0.co;2-9. [DOI] [PubMed] [Google Scholar]
- Amarante-Mendes GP, McGahon AJ, Nishioka WK, Afar DE, Witte ON, Green DR. Bcl-2-independent Bcr-Abl-mediated resistance to apoptosis: protection is correlated with up regulation of Bcl-xL. Oncogene. 1998;16:1383–1390. doi: 10.1038/sj.onc.1201664. [DOI] [PubMed] [Google Scholar]
- Beckmann J, Scheitza S, Wernet P, Fischer JC, Giebel B. Asymmetric cell division within the human hematopoietic stem and progenitor cell compartment: identification of asymmetrically segregating proteins. Blood. 2007;109:5494–5501. doi: 10.1182/blood-2006-11-055921. [DOI] [PubMed] [Google Scholar]
- Betschinger J, Mechtler K, Knoblich JA. Asymmetric segregation of the tumor suppressor brat regulates self-renewal in Drosophila neural stem cells. Cell. 2006;124:1241–1253. doi: 10.1016/j.cell.2006.01.038. [DOI] [PubMed] [Google Scholar]
- Borrow J, Shearman AM, Stanton VP, Jr, Becher R, Collins T, Williams AJ, Dube I, Katz F, Kwong YL, Morris C, et al. The t(7;11)(p15;p15) translocation in acute myeloid leukaemia fuses the genes for nucleoporin NUP98 and class I homeoprotein HOXA9. Nat Genet. 1996;12:159–167. doi: 10.1038/ng0296-159. [DOI] [PubMed] [Google Scholar]
- Brummendorf TH, Dragowska W, Zijlmans J, Thornbury G, Lansdorp PM. Asymmetric cell divisions sustain long-term hematopoiesis from single-sorted human fetal liver cells. J Exp Med. 1998;188:1117–1124. doi: 10.1084/jem.188.6.1117. [DOI] [PMC free article] [PubMed] [Google Scholar]
- Caussinus E, Gonzalez C. Induction of tumor growth by altered stem-cell asymmetric division in Drosophila melanogaster. Nat Genet. 2005;37:1125–1129. doi: 10.1038/ng1632. [DOI] [PubMed] [Google Scholar]
- Cayouette M, Raff M. Asymmetric segregation of Numb: a mechanism for neural specification from Drosophila to mammals. Nat Neurosci. 2002;5:1265–1269. doi: 10.1038/nn1202-1265. [DOI] [PubMed] [Google Scholar]
- Chang JT, Palanivel VR, Kinjyo I, Schambach F, Intlekofer AM, Banerjee A, Longworth SA, Vinup KE, Mrass P, Oliaro J, et al. Asymmetric T lymphocyte division in the initiation of adaptive immune responses. Science. 2007;315:1687–1691. doi: 10.1126/science.1139393. [DOI] [PubMed] [Google Scholar]
- Crittenden SL, Leonhard KA, Byrd DT, Kimble J. Cellular analyses of the mitotic region in the Caenorhabditis elegans adult germ line. Mol Biol Cell. 2006;17:3051–3061. doi: 10.1091/mbc.E06-03-0170. [DOI] [PMC free article] [PubMed] [Google Scholar]
- Daley GQ, Van Etten RA, Baltimore D. Induction of chronic myelogenous leukemia in mice by the P210bcr/abl gene of the Philadelphia chromosome. Science. 1990;247:824–830. doi: 10.1126/science.2406902. [DOI] [PubMed] [Google Scholar]
- Dash AB, Williams IR, Kutok JL, Tomasson MH, Anastasiadou E, Lindahl K, Li S, Van Etten RA, Borrow J, Housman D, et al. A murine model of CML blast crisis induced by cooperation between BCR/ABL and NUP98/HOXA9. Proc Natl Acad Sci USA. 2002;99:7622–7627. doi: 10.1073/pnas.102583199. [DOI] [PMC free article] [PubMed] [Google Scholar]
- De Brabander M, Geuens G, Nuydens R, Willebrords R, De Mey J. Taxol induces the assembly of free microtubules in living cells and blocks the organizing capacity of the centrosomes and kinetochores. Proc Natl Acad Sci USA. 1981;78:5608–5612. doi: 10.1073/pnas.78.9.5608. [DOI] [PMC free article] [PubMed] [Google Scholar]
- Duncan AW, Rattis FM, DiMascio LN, Congdon KL, Pazianos G, Zhao C, Yoon K, Cook JM, Willert K, Gaiano N, Reya T. Integration of Notch and Wnt signaling in hematopoietic stem cell maintenance. Nat Immunol. 2005;6:314–322. doi: 10.1038/ni1164. [DOI] [PubMed] [Google Scholar]
- Guo M, Jan LY, Jan YN. Control of daughter cell fates during asymmetric division: interaction of Numb and Notch. Neuron. 1996;17:27–41. doi: 10.1016/s0896-6273(00)80278-0. [DOI] [PubMed] [Google Scholar]
- Huang S, Law P, Francis K, Palsson BO, Ho AD. Symmetry of initial cell divisions among primitive hematopoietic progenitors is independent of ontogenic age and regulatory molecules. Blood. 1999;94:2595–2604. [PubMed] [Google Scholar]
- Jan YN, Jan LY. Asymmetric cell division. Nature. 1998;392:775–778. doi: 10.1038/33854. [DOI] [PubMed] [Google Scholar]
- Knoblich JA, Jan LY, Jan YN. Asymmetric segregation of Numb and Prospero during cell division. Nature. 1995;377:624–627. doi: 10.1038/377624a0. [DOI] [PubMed] [Google Scholar]
- Leary AG, Strauss LC, Civin CI, Ogawa M. Disparate differentiation in hemopoietic colonies derived from human paired progenitors. Blood. 1985;66:327–332. [PubMed] [Google Scholar]
- Lee CY, Robinson KJ, Doe CQ. Lgl, Pins and aPKC regulate neuroblast self-renewal versus differentiation. Nature. 2006;439:594–598. doi: 10.1038/nature04299. [DOI] [PubMed] [Google Scholar]
- Mayani H, Dragowska W, Lansdorp PM. Lineage commitment in human hemopoiesis involves asymmetric cell division of multipotent progenitors and does not appear to be influenced by cytokines. J Cell Physiol. 1993;157:579–586. doi: 10.1002/jcp.1041570318. [DOI] [PubMed] [Google Scholar]
- Mayotte N, Roy DC, Yao J, Kroon E, Sauvageau G. Oncogenic interaction between BCR-ABL and NUP98-HOXA9 demonstrated by the use of an in vitro purging culture system. Blood. 2002;100:4177–4184. doi: 10.1182/blood-2002-04-1244. [DOI] [PubMed] [Google Scholar]
- Mizutani K, Yoon K, Dang L, Tokunaga A, Gaiano N. Differential Notch signaling distinguishes neural stem cells from intermediate progenitors. Nature. 2007;449:351–355. doi: 10.1038/nature06090. [DOI] [PubMed] [Google Scholar]
- Morrison SJ, Kimble J. Asymmetric and symmetric stem-cell divisions in development and cancer. Nature. 2006;441:1068–1074. doi: 10.1038/nature04956. [DOI] [PubMed] [Google Scholar]
- Nakamura T, Largaespada DA, Lee MP, Johnson LA, Ohyashiki K, Toyama K, Chen SJ, Willman CL, Chen IM, Feinberg AP, et al. Fusion of the nucleoporin gene NUP98 to HOXA9 by the chromosome translocation t(7;11)(p15;p15) in human myeloid leukaemia. Nat Genet. 1996;12:154–158. doi: 10.1038/ng0296-154. [DOI] [PubMed] [Google Scholar]
- Nakano T, Kodama H, Honjo T. Generation of lymphohematopoietic cells from embryonic stem cells in culture. Science. 1994;265:1098–1101. doi: 10.1126/science.8066449. [DOI] [PubMed] [Google Scholar]
- Nishiyama M, Arai Y, Tsunematsu Y, Kobayashi H, Asami K, Yabe M, Kato S, Oda M, Eguchi H, Ohki M, et al. 11p15 translocations involving the NUP98 gene in childhood therapy-related acute myeloid leukemia/myelodysplastic syndrome. Genes Chromosomes Cancer. 1999;26:215–220. [PubMed] [Google Scholar]
- Nowell PC, Hungerford DA. Chromosome studies on normal and leukemic human leukocytes. J Natl Cancer Inst. 1960;25:85–109. [PubMed] [Google Scholar]
- Osawa M, Hanada K, Hamada H, Nakauchi H. Long-term lymphohematopoietic reconstitution by a single CD34-low/negative hematopoietic stem cell. Science. 1996;273:242–245. doi: 10.1126/science.273.5272.242. [DOI] [PubMed] [Google Scholar]
- Reya T, Clevers H. Wnt signalling in stem cells and cancer. Nature. 2005;434:843–850. doi: 10.1038/nature03319. [DOI] [PubMed] [Google Scholar]
- Reya T, Morrison SJ, Clarke MF, Weissman IL. Stem cells, cancer, and cancer stem cells. Nature. 2001;414:105–111. doi: 10.1038/35102167. [DOI] [PubMed] [Google Scholar]
- Suda T, Suda J, Ogawa M. Disparate differentiation in mouse hemopoietic colonies derived from paired progenitors. Proc Natl Acad Sci USA. 1984;81:2520–2524. doi: 10.1073/pnas.81.8.2520. [DOI] [PMC free article] [PubMed] [Google Scholar]
- Takano H, Ema H, Sudo K, Nakauchi H. Asymmetric division and lineage commitment at the level of hematopoietic stem cells: inference from differentiation in daughter cell and granddaughter cell pairs. J Exp Med. 2004;199:295–302. doi: 10.1084/jem.20030929. [DOI] [PMC free article] [PubMed] [Google Scholar]
- Thompson DL, Lum KD, Nygaard SC, Kuestner RE, Kelly KA, Gimble JM, Moore EE. The derivation and characterization of stromal cell lines from the bone marrow of p53−/− mice: new insights into osteoblast and adipocyte differentiation. J Bone Miner Res. 1998;13:195–204. doi: 10.1359/jbmr.1998.13.2.195. [DOI] [PubMed] [Google Scholar]
- Till JE, McCulloch CE. A direct measurement of the radiation sensitivity of normal mouse bone marrow cells. Radiat Res. 1961;14:213–222. [PubMed] [Google Scholar]
- Ueno H, Sakita-Ishikawa M, Morikawa Y, Nakano T, Kitamura T, Saito M. A stromal cell-derived membrane protein that supports hematopoietic stem cells. Nat Immunol. 2003;4:457–463. doi: 10.1038/ni916. [DOI] [PubMed] [Google Scholar]
- Wakamatsu Y, Maynard TM, Jones SU, Weston JA. NUMB localizes in the basal cortex of mitotic avian neuroepithelial cells and modulates neuronal differentiation by binding to NOTCH-1. Neuron. 1999;23:71–81. doi: 10.1016/s0896-6273(00)80754-0. [DOI] [PubMed] [Google Scholar]
- Yamamoto K, Nakamura Y, Saito K, Furusawa S. Expression of the NUP98/HOXA9 fusion transcript in the blast crisis of Philadelphia chromosome-positive chronic myelogenous leukaemia with t(7;11)(p15;p15) Br J Haematol. 2000;109:423–426. doi: 10.1046/j.1365-2141.2000.02003.x. [DOI] [PubMed] [Google Scholar]
- Yamashita YM, Jones DL, Fuller MT. Orientation of asymmetric stem cell division by the APC tumor suppressor and centrosome. Science. 2003;301:1547–1550. doi: 10.1126/science.1087795. [DOI] [PubMed] [Google Scholar]
- Zhong W, Feder JN, Jiang MM, Jan LY, Jan YN. Asymmetric localization of a mammalian numb homolog during mouse cortical neurogenesis. Neuron. 1996;17:43–53. doi: 10.1016/s0896-6273(00)80279-2. [DOI] [PubMed] [Google Scholar]
Associated Data
This section collects any data citations, data availability statements, or supplementary materials included in this article.
Supplementary Materials
Representative movie of a GFP+KLSC cell undergoing division followed by downregulation of GFP in both daughter cells ( Movie S1). CFP expression serves as a control and does not change significantly after division ( Movie S2). Cells of interest are indicated by arrowheads. Clock at bottom of movie represents culture time (hours:minutes) in 10 minute intervals.
Representative movie of a GFP+KLSC cell undergoing division followed by downregulation of GFP in both daughter cells ( Movie S1). CFP expression serves as a control and does not change significantly after division ( Movie S2). Cells of interest are indicated by arrowheads. Clock at bottom of movie represents culture time (hours:minutes) in 10 minute intervals.
Representative movie of a GFP+KLSC cell undergoing division followed by maintenance of GFP expression in both daughter cells ( Movie S3). CFP expression serves as a control and remains similar in mother and daughter cells ( Movie S4). Cells of interest are indicated by arrowheads. Clock at bottom of movie represents culture time (hours:minutes) in 10 minute intervals.
Representative movie of a GFP+KLSC cell undergoing division followed by maintenance of GFP expression in both daughter cells ( Movie S3). CFP expression serves as a control and remains similar in mother and daughter cells ( Movie S4). Cells of interest are indicated by arrowheads. Clock at bottom of movie represents culture time (hours:minutes) in 10 minute intervals.
Representative movie of a GFP+KLSC cell undergoing division followed by downregulation of GFP expression in one of the daughter cells ( Movie S5, bottom arrow). CFP expression serves as a control and remains similar in mother and daughter cells ( Movie S6). Cells of interest are indicated by arrowheads. Clock at bottom of movie represents culture time (hours:minutes) in 10 minute intervals.
Representative movie of a GFP+KLSC cell undergoing division followed by downregulation of GFP expression in one of the daughter cells ( Movie S5, bottom arrow). CFP expression serves as a control and remains similar in mother and daughter cells ( Movie S6). Cells of interest are indicated by arrowheads. Clock at bottom of movie represents culture time (hours:minutes) in 10 minute intervals.