

Abstract
Cholinergic input to the optic tectum is necessary for visual map maintenance. To understand why, we examined the effects of activation of the different cholinergic receptor subtypes in tectal brain slices and determined whether the retinotectal map was affected by manipulations of their activity in vivo. Both α-bungarotoxin sensitive and insensitive nicotinic receptor agonists increased spontaneous postsynaptic currents (sPSCs) in a subpopulation of patch-clamped tectal cells; application of subtype selective receptor antagonists reduced nicotine-induced increases in sPSCs. Activation of α-bungarotoxin insensitive nicotinic receptors also induced substantial inward current in some cells. Muscarinic receptor mediated outward current responses were blocked by the M2-like muscarinic receptor antagonists himbacine or AF-DX 384 and mimicked by application of the M2-like agonist oxotremorine. A less frequently observed muscarinic response involving a change in sPSC frequency appeared to be mediated by M1-like muscarinic receptors. In separate experiments, pharmacological manipulation of cholinergic receptor subtype activation led to changes in the activity-dependent visual map created in the tectum by retinal ganglion cell terminals. Chronic exposure of the tectum to either α-bungarotoxin insensitive, α-bungarotoxin sensitive or M1-like receptor antagonists resulted in map disruption. However, treatment with the M2-like receptor antagonist, AF-DX 384, compressed the map. We conclude that nicotinic or M1-like muscarinic receptors control input to tectal cells while α-bungarotoxin insensitive nicotinic receptors and M2-like muscarinic receptors change tectal cell responses to that input. Blockade of the different cholinergic receptor subtypes can have opposing effects on map topography that are consistent with expected effects on tectal cell activity levels.
Keywords: nicotinic, muscarinic, Rana pipiens, topographic map, retinotectal
Introduction
Acetylcholine (ACh) is important to the experience-dependent neuronal plasticity found within a number of central nervous system regions. The well-described deficits in learning and memory that accompany decreases in cholinergic neurotransmission in the mature brain provide a good illustration of this importance (Felder, 1995; Chessell, 1996; Isacson et al., 2002). At the cellular level, cholinergic activity is known to facilitate the induction of synaptic potentiation in such diverse regions of the brain as the hippocampus, cortex and midbrain reward areas (Hasselmo & Barkai, 1995; Brocher et al., 1992; Mansvelder & McGehee, 2000; Cheong et al., 2001; Ji et al., 2001).
In developing cortex, alterations in cholinergic activity can result in delayed neuronal development and changes in cytoarchitecture (Hohmann & Berger-Sweeney, 1998; Lauder & Schambra, 1999). ACh can also have a profound effect on visual organization and function. Cholinergic input facilitates the ocular dominance shift from the closed to the open eye that occurs in kittens when one eye is sutured shut during the critical period (Bear & Singer, 1986). It can also cause long-lasting modifications in the receptive fields of cortical neurons (Greuel et al., 1988).
Both nicotinic and muscarinic receptors, the two major classes of cholinergic receptors, have been implicated in visual plasticity phenomena. Application of an M1-like muscarinic receptor antagonist blocks ocular dominance shifts (Gu & Singer, 1993) and the retinal ganglion cell terminals of mice lacking the β2 subunit of nicotinic receptors fail to segregate into eye-specific areas within visual areas (Rossi et al., 2001). Cholinergic facilitation of long-term depression in the visual cortex is also known to involve M1-like muscarinic receptors (Kirkwood et al., 1999). Nevertheless, how activation of these and/or other receptor subtypes contributes to the effects of ACh on visual plasticity is not understood. Nor is it known whether those effects are limited to the requirement for ACh as a permissive factor, necessary only for increasing activity levels to a point at which plasticity is possible (Kirkwood, 2000).
To examine these issues, we used the retinotectal system of the frog. In this system, retinal ganglion cells create and maintain a topographic map at the optic tectum (Debski & Cline, 2002). The integrity of this map is activity-dependent (Cline & Constantine-Paton, 1989) and cholinergic activity is needed to maintain it (Tu et al., 2000). The tectum, like the visual cortex, contains both nicotinic and muscarinic receptor subtypes (Butt et al., 2000, 2001). While the multiple responses of tectal cells to nicotinic and muscarinic receptor activation have been recently described (Titmus et al., 1999; Yu & Debski, 2003) the contribution of these different receptor subtypes to the modulation of tectal activity levels and/or the visual map is unknown. In this paper we investigate whether these different receptor subtypes have effects on visual map maintenance that are consistent with their effects on tectal cell activity.
Materials and methods
Animal care and surgical procedures used in this study were approved by the Institutional Animal Care and Use Committee at the University of Kentucky. Adult Rana pipiens were purchased from Charles Sullivan (Nashville, TN, USA) and housed at room temperature in 1-gallon plastic tubs or 10-gallon glass tanks. They were fed mealworms periodically until killed for experimental use.
Electrophysiology
Tectal brain slices were prepared for patch-clamp recording as described previously (Hickmott & Constantine-Paton, 1993; Yu & Debski, 2003). Animals were anaesthetized by immersion in a 0.1% solution of ethyl m-amino benzoate, then decapitated. In brief, brains were embedded in agarose (type VII agarose, Sigma, St. Louis, MO, USA) and sliced into transverse tectal slices (350 μm) using a Campden vibrotome (WPI, Sarasota, FL, USA). Slices from mid-tectum were transferred to a recording chamber (Warner Instrument Corporation, Hamden, CT, USA) which was then positioned on the stage of an inverted microscope. Slices were perfused initially with a normal bath solution (pH 7.4) composed of (in mm): 112 NaCl, 2 KCl, 17 NaHCO3, 3 CaCl2, 3 MgCl2, 24.2 glucose and saturated with 95% O2 and 5% CO2. All experiments were performed at a room temperature of 20–22 °C.
Patch micropipettes (5–7 MΩ resistance) were pulled from borosilicate glass (WPI) using a vertical puller (Narashige, Sea Cliff, NY, USA). They were filled with the following solution (in mm): 100 KCl, 15 NaCl, 10 Hepes, 10 EGTA, 3 MgCl2, 1 CaCl2, 3 ATP-Mg, 0.3 GTP-Na (pH 7.4; Malayev & Debski, 1998). This filling solution was chosen so that Cl− mediated inhibitory postsynaptic potentials would not interfere with our ability to detect excitatory postsynaptic events (Yu & Debski, 2003). The tectum contains a substantial amount of GABAA receptor-mediated activity (Hickmott & Constantine-Paton, 1993; Rybicka & Udin, 1994; Li & Fite, 1998). The solution used depolarized the Cl− reversal potential so when cells were voltage-clamped at −65 mV, as they were in our recordings, Cl− mediated events led to inward currents.
Whole cell recordings from cells in the main cellular layer of the tectum (layer 6; Székely & Lázár, 1976) were obtained (Yu & Debski, 2003). A recording pipette was lowered into the slice and slowly advanced until it came into contact with a cell. Negative pressure was applied until a tight seal (>1 GΩ) was formed. Application of further negative pressure ruptured the underlying membrane and established whole-cell configuration. Series resistance was 10–25 MΩ after ‘break-in’ and was periodically monitored during the experiment. Whole cell capacitance was adjusted and the series resistance was electrically compensated 70–90%. Recorded cells differed in the frequency with which spontaneous postsynaptic potentials were observed, ranging from low (0.25 Hz) to very high levels (23.50 Hz). Most cells had low levels of background activity (median 2.38; mean 3.71; n = 114) that were maintained for the duration of the 15–60 minute recording session. No correlation with the level of spontaneous postsynaptic potential activity and cholinergic response type was evident. Action potentials were rarely observed in any of the recorded cells.
Drugs, dissolved in normal bath solution, were applied to the brain slice using an external perfusion system, which consisted of a number of 30 mL syringes connected to a valve with multiple input ports and one output port. The solution flow was gravity driven and the flow rate was 1.4–1.6 mL/min. It took solutions approximately 11 s to reach the recording chamber whose working volume was 150 μL.
AF-DX 384 was a gift from Boehringer–Ingelheim (Biberach, Germany); all other compounds used were purchased from Sigma. Receptor agonists were applied for 30 s and the interval between the beginning of one application and the start of another was 5 min. Because of an apparent and long-lasting desensitization of nicotinic receptors upon exposure to nicotinic agonists (Yu & Debski, 2003), individual tectal slices were used only once for recording of the reported nicotinic responses. Carbachol was used to evoke muscarinic responses following the desensitization of nicotinic receptors by repeated nicotine exposure. As carbachol could evoke repeated responses in tectal cells, muscarinic receptor antagonists, when used, were introduced 2 min prior to the second application of this agonist, unless otherwise stated. They were applied for a period of time that slightly exceeded the observed or expected duration of the agonist-induced response.
In control experiments, the nicotinic and muscarinic receptor antagonists used in this study were examined for any effects on membrane potential or sPSC frequency in the absence of the application of a cholinergic receptor agonist. No such effects were found.
Membrane currents were recorded using an Axopatch 200 amplifier (Axon Instruments, Foster City, CA, USA) in the ‘whole-cell’ mode. The signal from the amplifier was filtered at 5 kHz and was acquired with the pclamp software package using a DigiData 1200 interface (Axon Instruments). The data were saved in digital format and then processed with pclamp. For current responses, peak amplitudes, response durations and latencies (time from beginning of an agonist application to half the peak amplitude of the response) were determined from the original traces. For changes in spontaneous miniature postsynaptic currents (sPSCs) event histograms were constructed using Prism software (GraphPad Software Inc., San Diego, CA, USA). Responses were analyzed in eight-second bin widths to obtain peak frequency values and response duration measurements. The peak change in frequency was calculated using the following formula: (peak frequency with the agonist minus peak frequency before the agonist)/(peak frequency with the agonist plus peak frequency before the agonist) (Titmus et al., 1999). One-second bin widths were used to determine half-peak latencies. Given values are means (± SEM). Statistical significance was determined using the unpaired t-test for nicotinic receptor data and a paired comparison for muscarinic receptor data.
Release of cholinergic receptor antagonists from Elvax
The slow-release plastic, Elvax, was used as a drug delivery vehicle for the studies assessing the effects of chronic exposure to specific cholinergic receptor antagonists on visual map topography. Subtype-selectivity for many of these antagonists, particularly the muscarinic compounds, is dependent upon the concentration of the drug used (Dorje et al., 1991; Miller et al., 1991). In order to better determine what concentration of drugs to embed in Elvax to obtain release rates within the specificity range, we determined the rate of release of three of the four compounds used in our chronic treatment studies: α-bungarotoxin (8000 g/mol), pirenzepine (351.4 g/mol), and AF-DX 384 (574.7 g/mol). Release from Elvax of the fourth compound, dihydro-β-erythroidine (DHβE; 275.4 g/mol), was not assayed because a radiolabelled form was unavailable.
Elvax was prepared as described previously (Silberstein & Daniel, 1982; Cline & Constantine-Paton, 1989; Tu et al., 2000). Stock solutions of the compounds under examination [α-bungarotoxin (33.3 μm), AF-DX 384 (33.3 μm) and pirenzepine (66.7 μm; RBI)] were prepared in 100 μL of dimethylsulfoxide and added to the dissolved Elvax. Each stock solution contained 5 μL of a radiolabelled form of the drug ([125I]α-bungarotoxin, 2200Ci/mmol; [3H]pirenzepine, 78.8Ci/mmol; [3H]AF-DX 384, 133.1 Ci/mmol; all purchased from New England Nuclear, Boston, MA, USA). Ten microlitres of a fast green solution (2mg/100μL dimethylsulfoxide; 0.01% at final embedded concentration) was also included so that the Elvax could be seen easily. The final concentrations of the drugs in Elvax were either 1.67 μm (α-bungarotoxin and AF-DX 384) or 3.33 μm (pirenzepine).
The amount of drug released per day was determined by scintillation spectrometry over the course of 6–8 weeks. Three separate batches of Elvax containing each drug were prepared and release measurements were taken from three slices from each batch. Each slice was soaked in 1 mL of physiological buffer (112 mm NaCl, 2 mm KCl, 17 mm NaHCO3, 3 mm CaCl2, 3 mm MgCl2, 12.2 mm glucose; Malayev & Debski, 1998) and kept in separate scintillation vials. To obtain a measurement, the soaking solution was removed from each tube and replaced with 1 mL of fresh buffer. The used solution was then read for the number of decays per minute (d.p.m.) on a scintillation counter. When tritiated ligands were used the solution to be counted was first placed in 3 mL of scintillation cocktail (3a70b; RPI Corporation, Mt. Prospect, IL, USA). The d.p.m. were converted to fmol released/mg Elvax per day based upon the specific activity of the radioligand, the proportion of radioligand to unlabelled drug in the Elvax, the weight of the Elvax slice, and the number of days between measurements. Measurements were taken every day during the first 5–6 days, every 2–3 days during the second week of the experiment, and once a week for the remainder of the testing period. The measurements were averaged and plotted with Graph Pad Prism 3.0.
These studies demonstrated that α-bungarotoxin, AF-DX 384 and pirenzepine all were initially released at high rates from the Elvax but these rates plummeted to achieve relatively stable levels (Fig. 1). Slight differences in the details of release existed. Alpha-bungarotoxin release declined rapidly over the first eight days to stabilize at a rate of approximately 0.5% of its initial concentration per day. AF-DX 384 release eventually stabilized at essentially this same value although its initial decline phase was more rapid than that of α-bungarotoxin. The initial decrease in pirenzepine release was prolonged relative to the other two compounds examined. The low levels of release characteristic of α-bungarotoxin- or AF-DX 384-containing Elvax were not achieved by pirenzepine-containing Elvax until days 20–25. Release continued to decline slowly from there, eventually stabilizing at approximately 0.35% per day.
Fig. 1.

Release profiles of cholinergic receptor antagonists from the slow release plastic Elvax. Graphs show release over time as a percentage of the original concentration of the drug embedded in Elvax. Insets represent the actual number of femtomoles of drug released. (A) α-Bungarotoxin release declined rapidly over the first week to stabilize at a daily release of approximately 0.5% of the initial concentration. (B) Pirenzepine release declined slowly over a two week period from its initial high rates to eventually attain a release of approximately 0.35%. (C) The pattern of AF-DX 384 release resembled that seen for α-bungarotoxin and also stabilized at 0.5% of the initial embedded concentration. Error bars are the standard error of the mean (SEM). n = 3 for each point.
Visual map assessment
Previous studies have indicated that α-bungarotoxin (5 nm), DHβE (500 nm), AF-DX 384 (5 nm) and pirenzepine (10 nm) bind selectively to different cholinergic receptor subtypes in the frog optic tectum (Butt et al., 2000, 2001). Embedded Elvax concentrations (α-bungarotoxin, 1.67 μm; pirenzepine, 3.33 μm; AF-DX 38, 1.67 μm) that would result in subtype-selective release concentrations were calculated using the stabilized release rates determined in the experiments above. The concentration of DHβE to embed (167 μm) was estimated using a release rate of 0.3% (Cline & Constantine-Paton, 1989; Smith et al., 1995).
Elvax was prepared as outlined above, without the addition of radioligand (Cline & Constantine-Paton, 1989; Tu et al., 2000), and then sliced at 30 μm on a vibratome for implantation into animals. Slices of the pirenzepine-embedded Elvax were soaked in a large volume (200 mL) of buffer for two weeks prior to its implantation because of this compound's prolonged high release phase (Fig. 1).
For implantation, animals were anaesthetized by an intraperitoneal injection of 2% ethyl m-aminobenzoate (0.1 cc/15 g body weight) and a slice of drug-containing Elvax was placed over one tectal lobe as described previously (Tu et al., 2000). The Elvax covered the majority of the tectal surface and was left in position for six weeks. After the chronic treatment, the integrity of the topographic map was assayed as described below. Previous studies have demonstrated that the plastic and the solvents used in making Elvax have no effect on retinal topography in the tectum (Tu et al., 2000).
Topographic map assays
The effects of the four drug treatments on the maintenance of the retinotectal visual map were determined by local injections of horseradish peroxidase (HRP; Sigma) into defined areas of the anteromedial tectum. Retinal ganglion cells that project to the tectal injection site transport the HRP to their cell bodies in the retina (Cline & Constantine-Paton, 1989; Tu et al., 2000). The retinal area occupied by HRP-positive retinal ganglion cell bodies can then be used to assay the integrity of the visual map.
At the end of the treatment period, animals implanted with drug-containing Elvax were anaesthetized with ethyl m-aminobenzoate as described above. The skullcap was removed again, the correct positioning of the Elvax over only one tectal lobe and under the dura mater was verified, and then the Elvax slice was removed. Injection pipettes were pulled on a horizontal puller (model PLU-1, WPI), broken back to a tip diameter of approximately 50 μm, and filled with HRP (20% in Tris-HCl [50 mm]/NaCl [l00 mm] buffer; Cline & Constantine-Paton, 1989; Tu et al., 2000). The dura and pia mater over both tectal lobes was removed, and HRP was injected with a Picospritzer (General Valve, Farefield, NJ, USA). Injections were made into the superficial layer of the anteromedial tectum in both tectal lobes of an animal (the lobe that had been previously covered by the Elvax slice and the one that had not) using the same injection pipette. The order of injection into the drug and control tectal lobes was randomized. The skullcap and skin were replaced in their original positions, and the wound was resealed with Vetbond Tissue Adhesive (3M Animal Care, St. Paul, MN, USA).
After a survival period of one week that allowed for the retrograde transport of HRP to the retinal ganglion cell bodies, the retinal and tectal tissues of the injected animals were processed for visualization of the HRP staining. The animals were injected with 2% ethyl m-aminobenzoate and dark-adapted for 45 min. They were then perfused through the heart with a Tris-HCl/NaCl buffer. The eyes were removed, perforated once with a forceps tip, and placed in a Ca2+/Mg2+-free Hepes buffer solution for 15 min at room temperature. The retinas were then separated from the eyes and placed in an ice-cold (4 °C) Tris/NaCl. The brain was removed from the skull, and the dura and pia maters were separated from the brain in an ice-cold Tris-NaCl solution. The retinas and brain were then reacted with a 3,3′-diaminobenzidene (Sigma) solution (50 mg 3,3′-diaminobenzidene, 1.5 mL dimethylsulfoxide, and 130 μL H2O2 (30% stock) in 98.37 mL Tris/NaCl; Tu et al., 2000). At the end of the 10–15 minute reaction, the retinas were placed in ice-cold Tris/NaCl for 45 min, which facilitated their flat mounting afterwards between two coverslips. During the waiting period the tectal lobes were dissected from the brain, marked by specific cuts for orientation, and flat mounted. The mounted retinas and tectal lobes were then fixed for 15–30 min in a solution of 2% paraformaldehyde/2% glutaraldehyde in 0.1 m phosphate-buffered saline.
To assay the integrity of the retinotectal map, the size of the injection site on the surface of the tectal lobe and the size of the retinal area occupied by HRP-positive retinal ganglion cell bodies were measured and normalized to the total area of the tectal lobe or retina, respectively. This was accomplished by first tracing the images of the flattened tissue projected through camera lucida optics, which indicated the outlines of the tissue, the outlines of the injection site, and the position of HRP-labelled retinal ganglion cells. The tracings were scanned into a computer using a flatbed scanner, and their images proportionally reduced to a working size with Adobe Photoshop 5.0. Areas were measured in square pixels with NIH Image 1.61 and then converted to a percentage of the total area of the tectal lobe or retina accordingly (Tu et al., 2000). Graph Pad Prism 3.0 was used to plot the results and analyse those results for significance with paired t-tests. Only animals with similar injection site sizes and placements were included in the analysis. Sample sizes are stated in the results section and ranged from four to eight animals for each experiment.
Results
Cholinergic activity is needed to both obtain optic tectum mediated responses to visual stimuli and maintain correct retinotectal topography (Gruberg et al., 1991; Tu et al., 2000). Although nicotinic receptors are known to be located on retinal ganglion cell terminals where they apparently modulate glutamate release (Sargent et al., 1989; Titmus et al., 1999; Yu & Debski, 2003), the tectum contains several different cholinergic receptor subtypes whose location and function are largely unknown (Butt et al., 2000, 2001). In order to understand how activation of these different receptor subtypes affects tectal activity, we examined the responses elicited in patch-clamped tectal neurons by cholinergic receptor subtype selective agonists and antagonists.
α-Bungarotoxin sensitive and insensitive nicotinic receptor responses
Nicotine increases the frequency and amplitude of sPSCs in 44% of tectal cells (Fig. 2; Yu & Debski, 2003). We first investigated the ability of nicotinic receptor agonists to mimic this response.
Fig. 2.
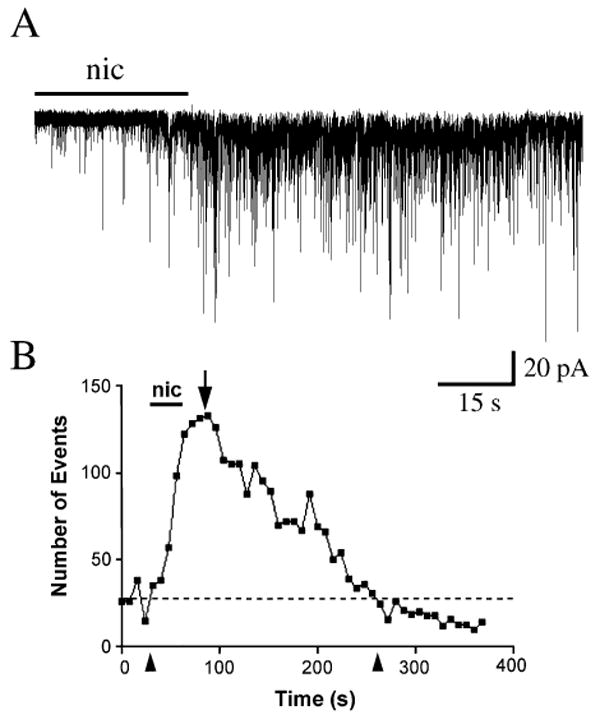
Increases in sPSCs induced by nicotine. (A) A 30-s application of nicotine (nic; 100 μm) resulted in a long-lasting increase in the amplitude and frequency of sPSCs. (B) Event histogram of response of cell shown in A to nicotine. Response duration was 230 s (time between two arrowheads) and the peak change in frequency was 55.6% (arrow and see Materials and methods). Dotted line represents level of baseline activity before nicotine application.
Epiboxidine (10 nm), a selective agonist of α-bungarotoxin insensitive nicotinic receptors, increased sPSCs in 11 out of the 26 cells (42%) to which it was applied (Fig. 3A). The epiboxidine-induced response looked remarkably similar to a nicotine-induced increase in sPSCs and was not significantly different from it with regard to duration, peak frequency change or latency (Table 1). Nicotine-induced increases in sPSCs have both glutamatergic and GABAergic components (Yu & Debski, 2003). This was also true of responses elicited with epiboxidine. Application of either the non-NMDA receptor antagonist 6-cyano-7-nitroquinoxaline-2,3-dione (CNQX) or the GABAA receptor antagonist, bicuculline, reduced the over-all magnitude of the recorded response to epiboxidine (Fig. 3A). Despite this visible reduction, the features of the response that we quantified did not change significantly in the presence of CNQX (n = 3; Table 1). Application of bicuculline significantly reduced the duration of the response (155.6 ± 30.3 s; P < 0.05; n = 4) but did not alter its peak frequency or latency.
Fig. 3.
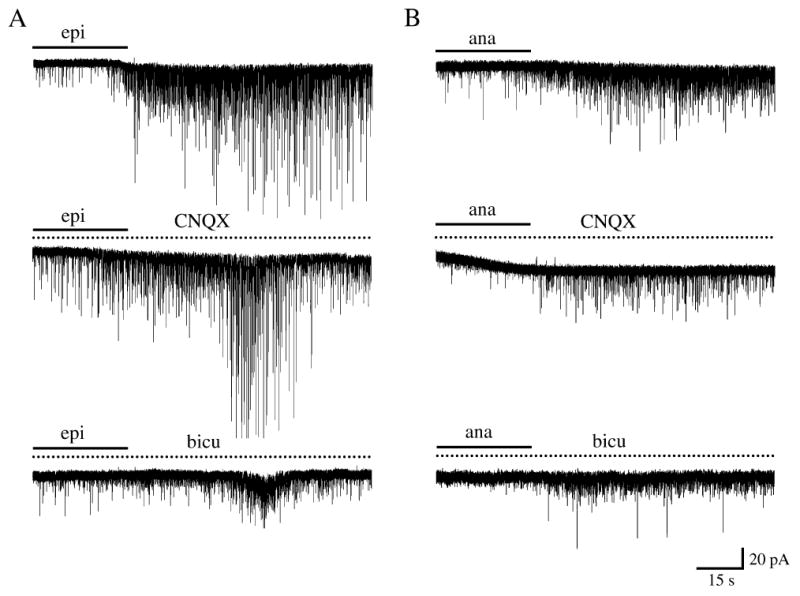
Both α-bungarotoxin insensitive and α-bungarotoxin sensitive nicotinic receptor agonists elicit increases in sPSCs that have glutamatergic and GABAergic components. (A) The α-bungarotoxin insensitive receptor agonist, epiboxidine (10 nm), was able to induce an increase in sPSCs in some tectal cells (top trace). In the presence of CNQX (50 μm; middle trace) or bicuculline methiodide (25 μm; bottom trace) the over-all response to epiboxidine was reduced. (B) Increases in sPSCs produced by the α-bungarotoxin sensitive receptor agonist, anatoxin-a (1 μm; A). These increases were also decreased in the presence of CNQX (middle trace) or bicuculline (bottom trace). Note the low-amplitude, long-lasting inward current elicited by anatoxin-a in one of these cells (middle trace). Solid line indicates the time during which either epiboxidine (A) or anatoxin-a (B) was applied; dotted line the time during either CNQX or bicuculline was present. CNQX or bicuculline were introduced 30 s before the agonist (not shown). All recordings are from different cells. Abbreviations: bicu, bicuculline; epi, epiboxidine; ana, anatoxin-a.
Table 1.
sPSC responses to nicotine, epiboxidine (α-bungarotoxin-insensitive receptor agonist) and anatoxin-a (α-bungarotoxin-sensitive receptor agonist)
| Response duration (s) | Peak increase in frequency (%) | Response latency (s) | |
|---|---|---|---|
| Nicotine† | 577.8 ± 97.0 (n = 5) | 54.4 ± 3.2 (n = 45) | 24.6 ± 1.4 (n = 41) |
| Nicotine + CNQX (n = 6)† | 155.6 ± 30.3* | 52.1 ± 5.6 | 33.6 ± 3.2* |
| Nicotine + Bicuculline (n = 4)† | 289.7 ± 113.6 | 78.7 ± 6.2* | 35.6 ± 4.7* |
| Epiboxidine (n = 4) | 756.3 ± 197.4 | 74.0 ± 5.5 | 31.8 ± 5.3 |
| Epiboxidine + CNQX (n = 3) | 670.2 ± 267.5 | 73.8 ± 4.0 | 28.3 ± 4.6 |
| Epiboxidine + Bicuculline (n = 4) | 155.8 ± 34.9* | 77.9 ± 4.1 | 31.8 ± 5.2 |
| Anatoxin-a (n = 4) | 304.0 ± 148.4 | 72.6 ± 4.9 | 32.2 ± 3.6 |
| Anatoxin-a + CNQX (n = 5) | 100.2 ± 11.3 | 37.2 ± 2.8* | 35.0 ± 3.1 |
| Anatoxin-a + Bicuculline (n = 10) | 51.2 ± 9.8* | 56.6 + 5.7 | 50.2 ± 5.9 |
Data from Yu & Debski (2003).
P < 0.05 when compared to the results from treatment with the agonist alone.
Anatoxin-a (1 μm), a selective agonist of α-bungarotoxin sensitive nicotinic receptors, also induced increased sPSCs (Fig. 3B), doing so in 55.9% of tectal cells (n = 34). As with epiboxidine, no significant differences were noted between the characteristics of these responses (n = 4) and those evoked by nicotine (Table 1). It did appear, however, that anatoxin-a induced two distinct classes of responses, one with a short duration (76.3 ± 11.3 s; n = 2) and the other with a long one (531.7 ± 168.3 s; n = 2). There were no obvious differences in the frequency or latencies of these two groups of responses. Application of bicuculline (n = 10) significantly reduced the duration of anatoxin-a evoked responses to 51.2 ± 9.8 s (P < 0.05) indicating that GABAergic activity contributed substantially to the response. A glutamatergic contribution was also evident as application of CNQX (n = 5) significantly reduced the change in peak frequency of the anatoxin-a evoked response (37.2 ± 2.8%; P < 0.05).
Use of the nicotinic receptor agonists indicated that activation of either α-bungarotoxin sensitive or insensitive nicotinic receptors can produce increased sPSC activity in tectal cells. To obtain further evidence for this conclusion, we next investigated the ability of specific nicotinic receptor antagonists to block nicotine-induced increases in sPSCs. As nicotine elicits an increase in sPSCs only in some cells and only upon its first application (Yu & Debski, 2003), we needed to obtain partial blocks with these antagonists so that the response of any given cell to nicotine would still be identifiable. For this reason, nicotinic receptor antagonists were applied 5 s after the application of the nicotine to our preparation and treatment was maintained until the end of the agonist exposure.
Nicotine-induced increases in sPSCs were significantly reduced in the presence of the α-bungarotoxin insensitive receptor antagonist DHβE (10 μm; 154.6 ± 18.2 s; n = 17; P < 0.01; Fig. 4). Exposure to 100 μm DHβE reduced response duration somewhat further (136.7 ± 42.7 s; n = 8; P < 0.01) as did 300 μm DHβE (101.7 ± 13.5 s; n = 4; P < 0.01). The higher doses of DHβE were tried because of a previous study indicating that the blockade of presynaptic α-bungarotoxin insensitive receptors requires concentrations of DHβE in the range of several hundred micromolar (Mulle et al., 1991). The peak frequency and latency of the response were unaffected by DHβE at all concentrations.
Fig. 4.

Contributions of α-bungarotoxin sensitive and insensitive nicotinic receptors to the increase in sPSCs induced by nicotine exposure. Histograms summarizing the effects of nicotine (striped bars), nicotine + TTX (dark bars), nicotine + nicotinic receptor antagonists (open bars) and nicotinic receptor agonists (stippled bars) on the duration, peak frequency and half-peak latency of the increase in sPSCs response. Note that responses induced by nicotine in the presence of MLA have been divided into two classes, a short duration class and a long duration one. Treatments are indicated below the graphs. Error bars represent the SEM. The error bar for the duration of the nicotinic response in the presence of 300 μm DHβE is not detectable at the presented scale. *P < 0.05 and **P < 0.01 when compared to the response induced by nicotine alone.
Consistent with the anatoxin-a results, methyllycaconitine (MLA; 100 nm), a α-bungarotoxin sensitive receptor antagonist, was also able to reduce the duration of the nicotine-evoked increase in sPSCs although it did so for only half of the cells on which it was tested (n = 6; Fig. 4). In three cells, the duration of the response was reduced to 70.5 ± 5.1 s (range, 61.3–78.9 s) far below the range of values seen with nicotine alone and significantly different from their mean (P < 0.01). Response latency in these cells was also increased (42.9 ± 9.5 s; P < 0.01) but change in peak frequency was not significantly affected. In three other cells, MLA appeared to have no effect on response duration (911.7 ± 167.2 s; range 600.0–1173 s). However, both the change in peak frequency (85.8 ± 3.7%) and the latency (35.6 ± 8.2 s) of the nicotine-induced response were increased in these cells when compared to the values produced by nicotine alone (P < 0.01 and P < 0.05, respectively).
Nicotine can also induce inward current responses in tectal cells and these responses were also sensitive to DHβE. Although application of DHβE at 1 or 10 μm, had no affect on the inward current response, at 100 μm (n = 7), it significantly reduced this current (peak amplitude, 5.7 ± 1.5 pA; P < 0.05) and its duration (61.5 ± 5.9 s; P < 0.01). The latency of the response (25.1 ± 1.8 s; n = 7) did not change. Application of a higher DHβE concentration (300 μm) did not further reduce either the amplitude or the duration of the nicotine-induced inward current significantly.
MLA did not, however, reduce the nicotine-evoked inward current response. In its presence, peak current measured 16.5 ± 5.2 pA (n = 7) in amplitude, as compared to the 19.4 ± 3.3 pA (n = 19) recorded in its absence. Half-peak latency was also unchanged (26.9 ± 2.1 s), as apparently was response duration. As with nicotine exposure alone (Yu & Debski, 2003), only some of the responses returned to baseline within the 5 min recovery period. In MLA-treated cells in which the response did not return to baseline (n = 4) after nicotine exposure, current amplitude was 25.8 ± 13.1% of the peak current. This value was also very close to that obtained without MLA (28.3 ± 4.0%).
The α-bungarotoxin insensitive nicotinic receptor agonist, epiboxidine, was able to induce an inward current in four of the cells (36%) in which it produced a response (Fig. 5). The mean peak amplitude (22.0 ± 9.4 pA) and latency of this current (35.3 ± 4.3 s) were not significantly different from that produced by nicotine. The induced current was long lasting and none of the responses had returned to baseline 5 min after the start of the 30 s drug exposure. Current amplitude at this time was 42.5 ± 9.7% of peak amplitude. In contrast, inward current comprised a component of the response in only three of the 19 cells (15.8%) in which anatoxin-a produced responses (Fig. 3B). This current was long lasting and of low amplitude.
Fig. 5.

Inward current responses evoked by application of nicotine (A) or an α-bungarotoxin sensitive receptor agonist, epiboxidine (10 nm; B). A 30-s exposure to nicotine (nic) or epiboxidine (epi) produced a long-lasting, high amplitude inward current in two different tectal cells. The frequency of sPSCs was also slightly increased by the agonists.
M1- and M2-like muscarinic receptor responses
In the optic tectum, muscarinic receptor responses can be evoked with carbachol after nicotinic receptor desensitization (Yu & Debski, 2003). Unlike nicotinic responses, carbachol-induced responses can be evoked repeatedly allowing the evaluation of responses in the presence and absence of receptor antagonists within the same cell.
The most frequently observed carbachol-induced response is that of outward current (63% of total cells; Yu & Debski, 2003). This response could be completely blocked by himbacine, an M2-like receptor antagonist. Three cells were tested first with carbachol and then with himbacine plus carbachol (Fig. 6A). The peak current in these cells upon an initial exposure to carbachol was 15.45 ± 3.2 pA. Subsequent exposure to himbacine (10 μm) for 2 min prior to and during carbachol application elicited no response at all from these cells. More limited exposures to himbacine led to partial, dose-dependent blocks of the outward current response. The effects of himbacine were not reversible within the wash-out periods that we were able to test (up to 60 min). Carbachol-induced outward current responses were also blocked by AF-DX 384, a more selective antagonist for M2-like muscarinic receptors than himbacine (Dorje et al., 1991; Miller et al., 1991; Aubert et al., 1992; Miller et al., 1992). Blockade was dose-dependent; application of 5 nm AF-DX 384 eliminated 53.2 ± 12.8% (n = 4) of the outward current and 10 nm, 87.6 + 3.0% of the response (n = 5; Fig. 6B). Both of these decreases were highly significant (P < 0.01). In contrast, pirenzepine (100 nm), an M1-like receptor antagonist had no significant effect on outward current responses (Fig. 6C). In tectal cells averaging 12.55 ± 3.3 pA (n = 4) upon a first exposure to carbachol, the peak current produced upon a second application of carbachol after exposure to and in the presence of pirenzepine was 9.4 ± 2.7 pA. Pirenzepine also had no affect on the duration (70.8 ± 1.5 vs. 69.4 ± 1.3 s) and the latency (26.6 ± 1.1 vs. 29.0 ± 1.9 s) of this type of carbachol-induced response.
Fig. 6.

The carbachol-induced outward current response is mediated by M2-like receptor activation. (A) A cell responds to an initial application of 100 μm carbachol (cch) with outward current (top trace). The presence of the M2-like receptor antagonist himbacine (10 μm) eliminates the response of the same cell to a second application of carbachol (bottom trace). (B) The outward current response induced by carbachol is also virtually eliminated by the presence of another M2-like receptor antagonist, AF-DX 384 (10 nm). (C) Application of carbachol in the presence of the M1-like receptor antagonist pirenzepine (100 nm, bottom trace) in another cell does not significantly alter the outward current response from that cell recorded in the absence of pirenzepine (top trace). In A, B and C, the application of the receptor antagonists began two minutes prior to the application of carbachol and the interval between the beginning of the first and second applications of carbachol was 5 min. Solid line indicates the time during which carbachol was applied; dotted line the time during the indicated receptor antagonist was present. A, B and C were recorded from different cells.
Application of the M2-like receptor agonist, oxotremorine (100 μm) was able to induce outward current in cells in which carbachol elicited such a response. Although oxotemorine currents peaked at 7.0 ± 1.7 pA (n = 5) in comparison to the 13.1 ± 3.5 pA induced by carbachol on the previous trial, this difference was not significant. The oxotremorine-induced current response was, however, prolonged and of longer latency than that produced by carbachol. The latency for the oxotremorine-induced response (46.5 ± 7.0 s; n = 5) was significantly increased over that obtained with carbachol (24.6 ± 4.6 s; P < 0.05; d.f. = 8). None of the five cells tested, had returned to baseline 5 min after the beginning of the initial oxotremorine exposure. The amplitude of their current at this time was 66.4 ± 5.6% of peak. Application of a higher dose of oxotremorine (200 μm n = 6) also induced only approximately 53% of the peak current previously induced by carbachol. Half-peak latency values and duration properties were also similar to those obtained at the lower oxotremorine dose. Application of the M1-like receptor agonist McN-A-343 (100 μm) was not able to produce any outward current in cells in which this response was induced by carbachol (n = 13).
Carbachol also induces both decreases and increases in sPSCs (5% and 9% of total cells, respectively; Yu & Debski, 2003). The scarcity of these types of responses made them difficult to investigate. Nevertheless, we have obtained some evidence suggesting that these responses were mediated by the M1-like muscarinic receptor.
Application of the M1-like receptor agonist McN-A-343 (100 μm) was shown to mimic the decrease in synaptic activity in cells that responded to carbachol with this type of a response (Fig. 7). While carbachol produced a change in frequency of −61.9 ± 12.1% in sPSCs, subsequent application of McN-A-343 to these same cells led to a decrease of −69.3 ± 11.5%. There were some differences, however, in response characteristics. The duration of the effect was greatly prolonged with McN-A-343, lasting 331.8 ± 17.7 s with a 30-s application in comparison to the 71.4 ± 12.1 s that the response lasted in these same cells when carbachol was applied (n = 3; P < 0.01). Although this difference did not reach significance, response latency also appeared to increase, averaging 47.4 ± 16.4 s for McN-A-343 induced response as opposed to only 17.3 ± 4.2 s for the carbachol induced response. Activity after application of each of these drugs recovered, with activity following carbachol rebounding to levels higher than initial firing rates.
Fig. 7.

The carbachol-induced decrease in spontaneous activity is due to the activation of M1-like receptors. (A) Spontaneous activity of a tectal cell in normal bath solution. (B) Application of carbachol (cch; 100 μm) decreases the spontaneous activity in the cell. (C) The application of the M1-like receptor agonist, McN-A-343 (McN; 100 μm), also decreases spontaneous activity in the cell. Note, however, the prolonged nature of the response. (D) Comparison of the time course and magnitude of the carbachol- and McN-A-343-induced responses in this cell. The number of sPSC events in 8 s time bins is plotted. Dotted vertical lines indicate time of application of the drugs.
Carbachol-induced responses consisting of increases in sPSCs could be decreased by application of pirenzepine. Initial application of carbachol elicited an increase in sPSCs that averaged 48.4 ± 6.8% (n = 6). Subsequent application of carbachol, in the presence of pirenzepine (applied for 70 s beginning 30 s prior to the carbachol), resulted in a peak change in frequency of 20.5 ± 5.8% or only 42.4% of the original response (P < 0.01). The latencies and durations of the responses were not changed in the presence of pirenzepine (32.6 ± 3.5 s and 76.7 ± 10.3 s, respectively, vs. 34.3 ± 2.6 s and 65.2 ± 12.1 s in pirenzepine). The effect of pirenzepine on sPSC frequency was somewhat reversible with the application paradigm that we used. In three cells in which we were able to return the slice to normal bathing medium and reapply carbachol 5 min after its last application, we recorded a response that was 56.2% of the initial response (as compared to the 42.4% recorded in the presence of pirenzepine).
Activity-dependent topographic map maintenance
The ability of specific cholinergic receptor subtypes to drive different aspects of tectal activity patterns, suggested that these receptor subtypes might have different effects on the activity-dependent maintenance of the topographic visual map. We examined whether this was so by chronically treating the tectum with subtype-selective cholinergic receptor antagonists (see Materials and methods).
Nicotinic receptor blockade
The optic tectum was chronically treated with either DHβE, to inactivate α-bungarotoxin insensitive nicotinic receptors, or α-bungarotoxin, to block α-bungarotoxin sensitive nicotinic receptors (Butt et al., 2000). Both of these compounds increased the area covered by HRP-positive retinal ganglion cells in the retina that projected to the treated lobe when compared to the HRP-positive area of the retina that projected to the untreated tectal lobe (Fig. 8A and B). In animals whose tecta had been treated with DHβE, the percentage area of HRP-labelled retinal ganglion cells in the retina projecting to the treated tectal lobe (3.98 ± 0.33%) was significantly greater (P < 0.05) than the area covered by HRP-positive cells in the retina associated with the untreated tectal lobe (2.62 ± 0.22%). α-Bungarotoxin had a similar, although weaker effect, also disrupting retinal topography (2.90 ± 0.54% vs. 1.58 ± 0.31%; P < 0.05). These results were not caused by differences in the tectal injection sites, whose placement and area covered were indistinguishable for the control and drug retinas. Furthermore, the number of HRP-labelled cells in the retina projecting to the treated tectal lobe (drug retina) was not significantly different from that in the retina that projected to the untreated tectal lobe (control retina) in both experimental manipulations (DHβE 204 ± 16 (drug) vs. 180 ± 18 (control), n = 6; α-bungarotoxin 164 ± 45 (drug) vs. 151 ± 47 (control), n = 4).
Fig. 8.

Blockade of nicotinic receptor subtypes disrupts visual map topography. (A) Representative camera lucida drawings (left) and summed group data (right) show that chronic treatment of a tectal lobe with the α-bungarotoxin insensitive receptor antagonist DHβE significantly enlarges (P < 0.05) the region of retina from which retinal ganglion cells project to a given tectal site (drug retina) when compared to the retina projecting to the nontreated tectal lobe of the same animal (control retina). (B) Chronic treatment with α-bungarotoxin also significantly enlarges (P < 0.05) the region of retina projecting to a given tectal site. The drawings in each row are from the same animal. HRP-labelled retinal ganglion cells are represented by small black dots in the retinas. The orientation of retinas is as indicated in the bottom of the figure (V, ventral; T, temporal). The scale bar (2 mm) applies only to the retina and not to the retinal ganglion cells, n = 6 for A and n = 4 for B. Error bars represent the SEM.
Muscarinic receptor blockade
The effects of blocking the function of muscarinic ACh receptor subtypes were markedly different from the results obtained with nicotinic receptor subtype blockade. Treatment with pirenzepine, an antagonist of M1-like muscarinic receptors (Buckley et al., 1989; Dorje et al., 1991), produced a robust disruption of visual topography that was greater than that observed after nicotinic ACh receptor blockade (Fig. 9A). HRP-labelled retinal ganglion cells projecting to the pirenzepine-treated tectum covered 2.72 ± 0.45% of the retina. This area was significantly greater than that covered by HRP-filled retinal ganglion cells in the retina projecting to the control tectum (1.32 ± 0.16%; P < 0.01; n = 8).
Fig. 9.

Bidirectional effect on topographic map maintenance of muscarinic receptor subtype blockade. (A) Representative camera lucida drawings (left) and summed group data (right) show that chronic treatment of a tectal lobe with the M1-like receptor antagonist pirenzepine disrupts the visual map, significantly (P < 0.01) enlarging the area of retina from which retinal ganglion cells project to a given tectal site (drug retina) when compared to the retina projecting to the nontreated tectal lobe of the same animal (control retina). (B) Chronic treatment with the M2-like receptor antagonist AF-DX 384 compresses the map, significantly (P < 0.01) reducing the region of retina projecting to a given tectal site. The drawings in each row are from the same animal. HRP-labelled retinal ganglion cells are represented by small black dots in the retinas. The orientation of retinas is as indicated in the bottom of the figure. The scale bar (2 mm) applies only to the retina and not to the retinal ganglion cells, n = 8 for A and B, respectively. Error bars represent the SEM.
The blockade of inhibitory M2-like muscarinic receptors with the selective antagonist AF-DX 384 (Miller et al., 1991) had a completely different effect on visual topography than the blockade of the other ACh receptor subtypes. In all AF-DX 384-treated animals (n = 8), the retina that projected to the treated tectal lobe had a smaller area of HRP-labelled retinal ganglion cells than the retina that projected to the untreated tectal lobe (Fig. 9B). Quantitative analysis demonstrated that the area of HRP-labelling in the retina associated with the treated tectum was 1.28 ± 0.12% while the area labelled in the retina that projected to the control tectum was 1.95 ± 0.16%. These two numbers were highly significantly different from one another (P < 0.01).
As in the nicotinic receptor antagonist experiments, the sizes of the injection sites in the treated and untreated tectal lobes in the muscarinic ACh receptor blockade experiments were equivalent. The number of retinal ganglion cells labelled by HRP in both experiments also did not differ significantly between Elvax and non-Elvax retinas [pirenzepine 162 ± 48 (drug) vs. 154 ± 43 (control); AF-DX 384 166 ± 33 (drug) vs. 190 ± 33 (control)].
Discussion
In the frog, almost all of the ACh found in the optic tectum is supplied by a projection from the nucleus isthmi, a midbrain structure with which it is reciprocally connected (Desan et al., 1987; Marín & González, 1999). This input could activate a number of different nicotinic and muscarinic receptor subtypes that are present in the tectum (Butt et al., 2000, 2001). In this study we have shown that activation of these different cholinergic receptor subtypes produces distinct responses in tectal cells. Furthermore, chronic exposure to antagonists of any of these receptor subtypes affects visual map topography, inducing either map expansions or compressions. This bidirectionality suggests that, depending upon the subtype of receptor activated, ACh can either facilitate or inhibit the activity-dependent process by which correctly placed retinal ganglion cell terminals are stabilized within the tectum.
Nicotinic receptor type and location in the optic tectum
Nicotinic receptors are pentameric structures consisting of two α and three β subunits and can be classified pharmacologically as either α-bungarotoxin sensitive or insensitive (Sargent, 1993; Role & Berg, 1996). Both classes of receptors are present in the frog optic tectum (Butt et al., 2000). We have demonstrated previously that nicotine exposure produced two types of responses in tectal cells: an increase in sPSCs and/or an inward current (Yu & Debski, 2003). Here, we show how the different nicotinic receptor subtypes contribute to these responses.
Presynaptic nicotinic acetylcholine receptors are present on retinal ganglion cell terminals in the superior colliuculus (Prusky & Cynader, 1988) and lateral geniculate terminals in the cortex (Prusky et al., 1987). Perhaps not surprisingly then, the majority of the nicotinic receptors present in the frog tectum appear to be on retinal ganglion cell terminals (Sargent et al., 1989) where they are thought to regulate the release of glutamate (Titmus et al., 1999; Yu & Debski, 2003). Such an action is consistent with a demonstrated facilitating effect of the cholinergic nucleus isthmi on retinotectal transmission (Caine & Gruberg, 1985; Gruberg et al., 1991; King & Schmidt, 1991). Receptor autoradiography combined with optic nerve lesion indicates that the receptors on retinal ganglion cell terminals belong to the α-bungarotoxin insensitive class (Butt et al., 2000). In support of this idea, we have shown that the α-bungarotoxin insensitive receptor antagonist, DHβE, reduces a nicotine-evoked increase in sPSCs. Furthermore, application of epiboxidine, an α-bungarotoxin insensitive receptor agonist, can produce an increase in sPSCs. Somewhat disappointingly, analysis of the response characteristics that we quantified failed to demonstrate a glutamatergic component to this response. Nevertheless, visual inspection of the records seems to indicate an over-all reduction of the magnitude of the response in the presence of CNQX and so we believe that glutamatergic activity contributes to the epiboxidine-induced response. This response, as does that evoked by nicotine, includes a large amount of GABAergic activity. This activity may result from the release of GABA from a subpopulation of retinal ganglion cells that contain it (Li & Fite, 2001).
Activation of α-bungarotoxin sensitive receptor also resulted in increased sPSCs with glutamatergic and GABAergic components. This was somewhat surprising as long-term optic nerve lesions fail to reduce α-bungarotoxin sensitive binding sites and such sites are scattered throughout tectal layers 8 and 9 rather than being present in a laminar pattern (Butt et al., 2000). Such results seem to make it unlikely that α-bungarotoxin sensitive receptors are present on retinal ganglion cell terminals. One way these data might be reconciled is if α-bungarotoxin sensitive receptors were on cholinergic terminals and increased the release of ACh upon activation. This ACh could then interact with the α-bungarotoxin insensitive receptors on retinal ganglion cell terminals. Co-localization of GABA with glutamate in some retinal ganglion cell terminals would then give rise to glutamatergic and GABAergic sPSCs (Li & Fite, 2001). Another possibility is that this cholinergic activity facilitates the release of glutamate onto inhibitory neurons, as has been suggested in the superior colliculus to explain GABAergic activity following presynaptic nicotinic receptor activation (Binns & Salt, 2000). Given the two apparent classes of responses revealed by the use of anatoxin-a and MLA, α-bungarotoxin sensitive receptors may well be present at two or more different sites, each having a different functional consequence upon activation.
The other response elicited by nicotine from 30% of tectal cells is an inward current (Yu & Debski, 2003). DHβE was able to significantly decrease the magnitude of this response and epiboxidine was able to induce a similarly looking current. These two observations indicate that the inward current response is likely mediated by α-bungarotoxin insensitive receptors located on tectal cells. Such a location is in agreement with receptor binding data showing that although the majority of α-bungarotoxin insensitive binding sites are in tectal layers 8 and 9, these sites are also present at lower levels in deeper tectal layers including the main cellular one (Butt et al., 2000).
Muscarinic receptor type and location in the tectum
The results of both receptor binding and physiological experiments indicate that muscarinic receptors are on tectal cell membranes (Fite & Wang, 1986; Butt et al., 2001). Muscarinic receptors are metabotropic receptors that directly activate second messenger systems upon ligand binding (Felder, 1995) and five subtypes have been identified (designated m1–m5; Bonner, 1989; Baldwin, 1994). Three of these receptors (m1, m3 and m5) mobilize intracellular calcium by activating phospholipases and are collectively referred to as M1-like receptors. The remaining two (m2 and m4), reduce intracellular levels of cAMP by inhibiting adenylate cyclase activity and are known as M2-like receptors (Felder, 1995).
Muscarinic receptors are present on at least some collicular (Aubert et al., 1992; Levey et al., 1994) and cortical cells (Wang et al., 1994; Tigges et al., 1997). They are found throughout the optic tectum (Butt et al., 2001). Muscarinic responses induced by carbachol application can roughly be classified as two types: changes in sPSCs and/or outward current (Yu & Debski, 2003). The vast majority of muscarinic responses (89%) involve the induction of outward current. This current is apparently mediated by M2-like receptor activation as indicated by the ability of himbacine and AF-DX 384 to block it and oxotremorine to induce a similar, albeit smaller and longer-lasting, response.
Both increases and decreases in sPSCs can also be induced by carbachol (Yu & Debski, 2003). Our data are less complete regarding the ability of both M1-like agonists and antagonists to mimic and block these responses, respectively, owing to the infrequency with which these responses were recorded. Nevertheless, we have demonstrated that McN-A-343 can mimic the decrease in sPSCs produced by carbachol and that pirenzepine can block carbachol-induced increases in sPSCs. These results suggest that M1-like receptors have terminal locations and regulate neurotransmitter release. Our previous work has indicated that this location is unlikely to include the terminals of retinal ganglion cells (Butt et al., 2001). Although we did not characterize the activity affected by M1-like receptor activation, presynaptic M1-like receptors have been found to change GABA release (Kayadjanian et al., 1994; Guo & Chiappinelli, 2001) and facilitate cholinergic and peptidergic transmission (Tobin, 1998) in other systems.
Visual map topography
Our results indicate that blockade of M1-like receptors inhibits neuronal plasticity mechanisms in the optic tectum while blockade of M2-like receptors facilitates them. These conclusions find support in the work of other investigators. Intracortical infusion of pirenzepine suppresses the shift in ocular dominance that normally occurs in a monocularly deprived animal in the kitten visual cortex (Gu & Singer, 1993) while blockade of M2-like muscarinic receptors enhances long-term potentiation at corticostriatal synapses (Calabresi et al., 1998).
We have recently reported that serotonin (5-HT) receptors can affect map topography bidirectionally: blockade of 5-HT1A receptors compresses the map while blockade of 5-HT1B receptors disrupts it (Butt et al., 2002). Both 5-HT1A and M2-like receptors hyperpolarize tectal cells and are coupled to decreases in cAMP levels, consistent with the idea that they affect visual map topography by changing membrane polarization and/or second messenger levels. Future experiments will have to assess whether chronic treatments with receptor antagonists produce the changes that acute treatments would predict.
We have also shown that activation of both α-bungarotoxin insensitive and α-bungarotoxin sensitive nicotinic receptors plays a role in maintaining map integrity. Blocking either of these receptor subtypes disrupts the map. This is consistent with a previous result obtained in the goldfish optic tectum in which chronic exposure to α-bungarotoxin results in the movement of retinal ganglion cell terminals away from their proper tectal targets (Schmidt, 1985, 1995). However, our results differ from a report in which DHβE, used in the superior colliculus, does not affect visual map formation (Simon et al., 1992).
Conclusions
ACh is often thought of as gating visual plasticity (Kirkwood, 2000). However, it has both excitatory and inhibitory effects within the optic tectum that may explain its ability to cause bidirectional changes in map topography. As with hippocampal long-term depression and potentiation, our data are consistent with the idea that the membrane potential of the postsynaptic neuron and the rate of presynaptic stimulation are critical in determining the direction of synapse modification (Shouval et al., 2002). Stabilizing or de-stabilizing a retinal input with ACh in a predictable fashion may then depend upon the ability to differentially activate its specific receptor subtypes.
Acknowledgments
We thank Dr Malathi Srivatsan for her gift of the Elvax used in this study. This work was supported by a grant from the National Eye Institute (EY11913).
Abbreviations
- 5-HT
serotonin
- Ach
acetylcholine
- CNQX
6-cyano-7-nitroquinoxaline-2,3-dione
- DHβE
dihydro-β-erythroidine
- HRP
horseradish peroxidase
- MLA
methyllycaconitine
- sPSCs
spontaneous postsynaptic currents
References
- Aubert I, Cecyre D, Gauthier S, Quirion R. Characterization and autoradiographic distribution of [3H]AF-DX 384 binding to putative muscarinic M2 receptors in the rat brain. Eur J Pharmacol. 1992;217:173–184. doi: 10.1016/0014-2999(92)90843-s. [DOI] [PubMed] [Google Scholar]
- Baldwin JM. Structure and function of receptors coupled to G proteins. Curr Opin Cell Biol. 1994;6:180–190. doi: 10.1016/0955-0674(94)90134-1. [DOI] [PubMed] [Google Scholar]
- Bear MF, Singer W. Modulation of visual cortical plasticity by acetylcholine and noradrenaline. Nature. 1986;320:172–176. doi: 10.1038/320172a0. [DOI] [PubMed] [Google Scholar]
- Binns KE, Salt TE. The functional influence of nicotinic cholinergic receptors on the visual responses of neurones in the superficial superior colliculus. Vis Neurosci. 2000;17:283–289. doi: 10.1017/s0952523800172116. [DOI] [PubMed] [Google Scholar]
- Bonner TI. The molecular basis of muscarinic receptor diversity. Trends Neurosci. 1989;12:148–151. doi: 10.1016/0166-2236(89)90054-4. [DOI] [PubMed] [Google Scholar]
- Brocher S, Artola A, Singer W. Agonists of cholinergic and noradrenergic receptors facilitate synergistically the induction of long-term potentiation in slices of rat visual cortex. Brain Res. 1992;573:27–36. doi: 10.1016/0006-8993(92)90110-u. [DOI] [PubMed] [Google Scholar]
- Buckley NJ, Bonner TI, Buckley CM, Brann MR. Antagonist binding properties of five cloned muscarinic receptors expressed in CHO-K1 cells. Mol Pharmacol. 1989;35:469–476. [PubMed] [Google Scholar]
- Butt CM, Pauly JR, Debski EA. Distribution and development of nicotinic acetylcholine receptor subtypes in the optic tectum of Rana pipiens. J Comp Neurol. 2000;423:603–618. doi: 10.1002/1096-9861(20000807)423:4<603::aid-cne6>3.0.co;2-f. [DOI] [PMC free article] [PubMed] [Google Scholar]
- Butt CM, Pauly JR, Wilkins LH, Dwoskin LP, Debski EA. Pharmacology, distribution and development of muscarinic acetylcholine receptor subtypes in the optic tectum of Rana pipiens. Neuroscience. 2001;104:161–179. doi: 10.1016/s0306-4522(01)00048-3. [DOI] [PMC free article] [PubMed] [Google Scholar]
- Butt CM, Zhao B, Duncan MJ, Debski EA. Sculpting the visual map: the distribution and function of serotonin-1A and serotonin-1B receptors in the optic tectum of the frog. Brain Res. 2002;931:21–31. doi: 10.1016/s0006-8993(01)03370-4. [DOI] [PubMed] [Google Scholar]
- Caine HS, Gruberg ER. Ablation of nucleus isthmi leads to loss of specific visually elicited behaviors in the frog Rana pipiens. Neurosci Lett. 1985;54:307–312. doi: 10.1016/s0304-3940(85)80096-3. [DOI] [PubMed] [Google Scholar]
- Calabresi P, Centonze D, Gubellini P, Pisani A, Bernardi G. Blockade of M2-like muscarinic receptors enhances long-term potentiation at corticostriatal synapses. Eur J Neurosci. 1998;10:3020–3023. doi: 10.1111/j.1460-9568.1998.00348.x. [DOI] [PubMed] [Google Scholar]
- Cheong MY, Yun SH, Mook-Jung I, Joo I, Huh K, Jung MW. Cholinergic modulation of synaptic physiology in deep layer entorhinal cortex of the rat. J Neurosci Res. 2001;66:117–1121. doi: 10.1002/jnr.1203. [DOI] [PubMed] [Google Scholar]
- Chessell JP. Acetylcholine receptor targets on cortical pyramidal neurones as targets for Alzheimer's therapy. Neurodegeneration. 1996;5:453–459. doi: 10.1006/neur.1996.0062. [DOI] [PubMed] [Google Scholar]
- Cline HT, Constantine-Paton M. NMDA receptor antagonists disrupt the retinotectal topographic map. Neuron. 1989;3:413–426. doi: 10.1016/0896-6273(89)90201-8. [DOI] [PubMed] [Google Scholar]
- Debski EA, Cline HT. Activity-dependent mapping in the retinotectal projection. Curr Opin Neurobiol. 2002;12:93–99. doi: 10.1016/s0959-4388(02)00295-7. [DOI] [PubMed] [Google Scholar]
- Desan PH, Gruberg ER, Grewell KM, Eckenstein F. Cholinergic innervation of the optic tectum in the frog Rana pipiens. Brain Res. 1987;413:344–349. doi: 10.1016/0006-8993(87)91026-2. [DOI] [PubMed] [Google Scholar]
- Dorje F, Wess J, Lambrecht G, Tacke R, Mutschler E, Brann MR. Antagonist binding profiles of five cloned human muscarinic receptor subtypes. J Pharmacol Exp Ther. 1991;256:727–733. [PubMed] [Google Scholar]
- Felder CC. Muscarinic acetylcholine receptors: signal transduction through multiple effectors. FASEB J. 1995;9:619–625. [PubMed] [Google Scholar]
- Fite KV, Wang SR. Microiontophoresis and single-unit analysis of cholinergic drugs in the optic tectum of the frog. Brain Behav Evol. 1986;28:198–206. doi: 10.1159/000118703. [DOI] [PubMed] [Google Scholar]
- Greuel JM, Luhmann HJ, Singer W. Pharmacological induction of use-dependent receptive field modifications in the visual cortex. Science. 1988;242:74–77. doi: 10.1126/science.2902687. [DOI] [PubMed] [Google Scholar]
- Gruberg ER, Wallace MT, Caine HS, Mote MI. Behavioral and physiological consequences of unilateral ablation of the nucleus isthmi in the leopard frog. Brain Behav Evol. 1991;37:92–103. doi: 10.1159/000114350. [DOI] [PubMed] [Google Scholar]
- Gu Q, Singer W. Effects of intracortical infusion of anticholinergic drugs on neuronal plasticity in kitten striate cortex. Eur J Neurosci. 1993;5:475–485. doi: 10.1111/j.1460-9568.1993.tb00514.x. [DOI] [PubMed] [Google Scholar]
- Guo J, Chiappinelli VA. Distinct muscarinic receptors enhance spontaneous GABA release and inhibit electrically evoked GABAergic synaptic transmission in the chick lateral spiriform nucleus. Neuroscience. 2001;104:1057–1066. doi: 10.1016/s0306-4522(01)00152-x. [DOI] [PubMed] [Google Scholar]
- Hasselmo ME, Barkai E. Cholinergic modulation of activity-dependent synaptic plasticity in the piriform cortex and associative memory function in a network biophysical simulation. J Neurosci. 1995;15:6592–6604. doi: 10.1523/JNEUROSCI.15-10-06592.1995. [DOI] [PMC free article] [PubMed] [Google Scholar]
- Hickmott PW, Constantine-Paton M. The contributions of NMDA, non-NMDA, and GABA receptors to postsynaptic responses in neurons of the optic tectum. J Neurosci. 1993;13:4339–4353. doi: 10.1523/JNEUROSCI.13-10-04339.1993. [DOI] [PMC free article] [PubMed] [Google Scholar]
- Hohmann CF, Berger-Sweeney J. Cholinergic regulation of cortical development and plasticity. New twists to an old story. Perspect Dev Neurobiol. 1998;5:401–425. [PubMed] [Google Scholar]
- Isacson O, Seo H, Lin L, Albeck D, Granholm AC. Alzheimer's disease and Down's syndrome: roles of APP, trophic factors and ACh. Trends Neurosci. 2002;25:79–84. doi: 10.1016/s0166-2236(02)02037-4. [DOI] [PubMed] [Google Scholar]
- Ji D, Lape R, Dani JA. Timing and location of nicotinic activity enhances or depresses hippocampal synaptic plasticity. Neuron. 2001;31:131–141. doi: 10.1016/s0896-6273(01)00332-4. [DOI] [PubMed] [Google Scholar]
- Kayadjanian N, Gioanni H, Menetrey A, Besson MJ. Muscarinic receptor stimulation increases the spontaneous [3H]GABA release in the rat substantia nigra through muscarinic receptors localized on striatonigral terminals. Neuroscience. 1994;63:989–1002. doi: 10.1016/0306-4522(94)90567-3. [DOI] [PubMed] [Google Scholar]
- King WM, Schmidt JT. The long latency component of retinotectal transmission: enhancement by stimulation of nucleus isthmi or tectobulbar tract and block by nicotinic cholinergic antagonists. Neuroscience. 1991;40:701–712. doi: 10.1016/0306-4522(91)90006-a. [DOI] [PubMed] [Google Scholar]
- Kirkwood A. Serotonergic control of developmental plasticity. Proc Natl Acad Sci USA. 2000;97:1951–1952. doi: 10.1073/pnas.070044697. [DOI] [PMC free article] [PubMed] [Google Scholar]
- Kirkwood A, Rozas C, Kirkwood J, Perez F, Bear MF. Modulation of long-term synaptic depression in visual cortex by acetylcholine and norepinephrine. J Neurosci. 1999;19:1599–1609. doi: 10.1523/JNEUROSCI.19-05-01599.1999. [DOI] [PMC free article] [PubMed] [Google Scholar]
- Lauder JM, Schambra UB. Morphogenetic roles of acetylcholine. Environ Health Perspect. 1999;107:65–69. doi: 10.1289/ehp.99107s165. [DOI] [PMC free article] [PubMed] [Google Scholar]
- Levey AI, Edmunds SM, Heilman CJ, Desmond TJ, Frey KA. Localization of muscarinic m3 receptor protein and M3 receptor binding in rat brain. Neuroscience. 1994;63:207–221. doi: 10.1016/0306-4522(94)90017-5. [DOI] [PubMed] [Google Scholar]
- Li Z, Fite KV. Distribution of GABA-like immunoreactive neurons and fibers in the central visual nuclei and retina of frog, Rana pipiens. Vis Neurosci. 1998;15:995–1006. doi: 10.1017/s0952523898155207. [DOI] [PubMed] [Google Scholar]
- Li Z, Fite KV. GABAergic visual pathways in the frog Rana pipiens. Vis Neurosci. 2001;18:457–164. doi: 10.1017/s0952523801183124. [DOI] [PubMed] [Google Scholar]
- Malayev A, Debski EA. Serotonin modulates induced synaptic activity in the optic tectum of the frog. Brain Res. 1998;781:167–181. doi: 10.1016/s0006-8993(97)01230-4. [DOI] [PubMed] [Google Scholar]
- Mansvelder HD, McGehee DS. Long-term potentiation of excitatory inputs to brain reward areas by nicotine. Neuron. 2000;27:349–357. doi: 10.1016/s0896-6273(00)00042-8. [DOI] [PubMed] [Google Scholar]
- Marín O, González A. Origin of tectal cholinergic projections in amphibians: a combined study of choline acetyltransferase immunohistochemistry and retrograde transport of dextran amines. Vis Neurosci. 1999;16:271–283. doi: 10.1017/s0952523899162084. [DOI] [PubMed] [Google Scholar]
- Miller JH, Aagaard PJ, Gibson VA, McKinney M. Binding and functional selectivity of himbacine for cloned and neuronal muscarinic receptors. J Pharmacol Exp Ther. 1992;263:663–667. [PubMed] [Google Scholar]
- Miller JH, Gibson VA, McKinney M. Binding of [3H]AF-DX 384 to cloned and native muscarinic receptors. J Pharmacol Exp Ther. 1991;259:601–607. [PubMed] [Google Scholar]
- Mulle C, Vidal C, Benoit P, Changeux JP. Existence of different subtypes of nicotinic acetylcholine receptors in the rat habenulo-interpeduncular system. J Neurosci. 1991;11:2588–2597. doi: 10.1523/JNEUROSCI.11-08-02588.1991. [DOI] [PMC free article] [PubMed] [Google Scholar]
- Prusky GT, Cynader MS. [3H]nicotine binding sites are associated with mammalian optic nerve terminals. Vis Neurosci. 1988;1:245–248. doi: 10.1017/s0952523800001504. [DOI] [PubMed] [Google Scholar]
- Prusky GT, Shaw C, Cynader MS. Nicotine receptors are located on lateral geniculate nucleus terminals in cat visual cortex. Brain Res. 1987;412:131–138. doi: 10.1016/0006-8993(87)91447-8. [DOI] [PubMed] [Google Scholar]
- Role LW, Berg DK. Nicotinic receptors in the development and modulation of CNS synapses. Neuron. 1996;16:1077–1085. doi: 10.1016/s0896-6273(00)80134-8. [DOI] [PubMed] [Google Scholar]
- Rossi FM, Pizzorusso T, Porciatti V, Marubio LM, Maffei L, Changeux JP. Requirement of the nicotinic acetylcholine receptor beta 2 subunit for the anatomical and functional development of the visual system. Proc Natl Acad Sci USA. 2001;98:6453–6458. doi: 10.1073/pnas.101120998. [DOI] [PMC free article] [PubMed] [Google Scholar]
- Rybicka KK, Udin SB. Ultrastructure and GABA immunoreactivity in layers 8 and 9 of the optic tectum of Xenopus laevis. Eur J Neurosci. 1994;6:1567–1582. doi: 10.1111/j.1460-9568.1994.tb00547.x. [DOI] [PubMed] [Google Scholar]
- Sargent PB. The diversity of neuronal nicotinic acetylcholine receptors. Annu Rev Neurosci. 1993;16:403–443. doi: 10.1146/annurev.ne.16.030193.002155. [DOI] [PubMed] [Google Scholar]
- Sargent PB, Pike SH, Nadel DB, Lindstrom JM. Nicotinic acetylcholine receptor-like molecules in the retina, retinotectal pathway, and optic tectum of the frog. J Neurosci. 1989;9:565–573. doi: 10.1523/JNEUROSCI.09-02-00565.1989. [DOI] [PMC free article] [PubMed] [Google Scholar]
- Schmidt JT. Apparent movement of optic terminals out of a local postsynaptically blocked region in goldfish optic tectum. J Neurophysiol. 1985;53:237–251. doi: 10.1152/jn.1985.53.1.237. [DOI] [PubMed] [Google Scholar]
- Schmidt JT. The modulatory cholinergic system in goldfish tectum may be necessary for retinotopic sharpening. Vis Neurosci. 1995;12:1093–1103. doi: 10.1017/s095252380000674x. [DOI] [PubMed] [Google Scholar]
- Shouval HZ, Bear MF, Cooper LN. A unified model of NMDA receptor-dependent bidirectional synaptic plasticity. Proc Natl Acad Sci USA. 2002;99:10831–10836. doi: 10.1073/pnas.152343099. [DOI] [PMC free article] [PubMed] [Google Scholar]
- Silberstein GB, Daniel CW. Elvax 40P implants: sustained, local release of bioactive molecules influencing mammary ductal development. Dev Biol. 1982;93:272–278. doi: 10.1016/0012-1606(82)90259-7. [DOI] [PubMed] [Google Scholar]
- Simon DK, Prusky GT, O'Leary DD, Constantine-Paton M. N-methyl-d-aspartate receptor antagonists disrupt the formation of a mammalian neural map. Proc Natl Acad Sci USA. 1992;89:10593–10597. doi: 10.1073/pnas.89.22.10593. [DOI] [PMC free article] [PubMed] [Google Scholar]
- Smith AL, Cordery PM, Thompson ID. Manufacture and release characteristics of Elvax polymers containing glutamate receptor antagonists. J Neurosci Meth. 1995;60:211–217. doi: 10.1016/0165-0270(95)00014-l. [DOI] [PubMed] [Google Scholar]
- Székely G, Lázár G. Cellular and synaptic architecture of optic tectum. In: Llinás R, Precht W, editors. Frog Neurobiology. Springer; New York: 1976. pp. 407–434. [Google Scholar]
- Tigges M, Tigges J, Rees H, Rye D, Levey AI. Distribution of muscarinic cholinergic receptor proteins m1 to m4 in area 17 of normal and monocularly deprived rhesus monkeys. J Comp Neurol. 1997;388:130–145. [PubMed] [Google Scholar]
- Titmus MJ, Tsai HJ, Lima R, Udin SB. Effects of choline and other nicotinic agonists on the tectum of juvenile and adult Xenopus frogs: a patch-clamp study. Neuroscience. 1999;91:753–769. doi: 10.1016/s0306-4522(98)00625-3. [DOI] [PubMed] [Google Scholar]
- Tobin G. Presynaptic muscarinic M1 and M2 receptor modulation of auriculotemporal nerve transmission in the rat. J Auton Nerv Syst. 1998;72:61–71. doi: 10.1016/s0165-1838(98)00088-5. [DOI] [PubMed] [Google Scholar]
- Tu S, Butt CM, Pauly JR, Debski EA. Activity-dependent regulation of substance P expression and topographic map maintenance by a cholinergic pathway. J Neurosci. 2000;20:5346–5357. doi: 10.1523/JNEUROSCI.20-14-05346.2000. [DOI] [PMC free article] [PubMed] [Google Scholar]
- Wang Y, Gu Q, Mao F, Haugland RP, Cynader MS. Activity-dependent expression and distribution of M1 muscarinic ACh receptors in visual cortex neuronal cultures. J Neurosci. 1994;14:4147–4158. doi: 10.1523/JNEUROSCI.14-07-04147.1994. [DOI] [PMC free article] [PubMed] [Google Scholar]
- Yu CJ, Debski EA. The effects of nicotinic and muscarinic receptor activation on patch-clamped cells in the optic tectum of Rana pipiens. Neuroscience. 2003 doi: 10.1016/S0306-4522(02)00768-6. In press. [DOI] [PMC free article] [PubMed] [Google Scholar]