

Summary
Planarians have been a classic model system for the study of regeneration, tissue homeostasis, and stem cell biology for over a century, but have not historically been accessible to extensive genetic manipulation. Here we utilize RNA-mediated genetic interference (RNAi) to introduce large-scale gene inhibition studies to the classic planarian system. 1065 genes were screened. Phenotypes associated with the RNAi of 240 genes identify many specific defects in the process of regeneration and define the major categories of defects planarians display following gene perturbations. We assessed the effects of inhibiting genes with RNAi on tissue homeostasis in intact animals and stem cell (neoblast) proliferation in amputated animals identifying candidate stem cell, regeneration, and homeostasis regulators. Our study demonstrates the great potential of RNAi for the systematic exploration of gene function in understudied organisms and establishes planarians as a powerful model for the molecular genetic study of stem cells, regeneration, and tissue homeostasis.
Introduction
Planarians are bilaterally symmetric metazoans renowned for their regenerative capacities, extensive tissue turnover as part of their normal homeostasis, and the presence of a pluripotent adult stem cell population known as the neoblasts (Reddien and Sánchez Alvarado, 2004). Planarians have derivatives of all three germ layers, bilobed cephalic ganglia, photoreceptors and other sensory cell types, cilia and a muscular system for locomotion and negotiating objects, a gastrovascular system for digestion, a muscular pharynx, an excretory system, and an epidermis (Hyman, 1951). Surrounding the branched gastrovascular system is a mesenchymal tissue known as the parenchyma (Hyman, 1951). Planarians are currently viewed as members of the Lophotrochozoa, which are one of the three major phyletic groupings of bilaterally symmetric animals (Adoutte et al., 2000). The Lophotrochozoa are comprised of a diverse set of animals that display a number of attributes not manifested by current ecdysozoan model systems (e.g., C. elegans and Drosophila), such as regeneration and adult somatic stem cells. Therefore, studies of planarian biology will help the understanding of processes relevant to human development and health not easily studied in current invertebrate genetic systems.
Neoblasts are the only known proliferating cells in adult planarians and reside in the parenchyma. Following injury, a neoblast proliferative response is triggered, generating a regeneration blastema consisting of initially undifferentiated cells covered by epidermal cells. Moreover, essentially all tissues in adult planarians turnover and are replaced by neoblast progeny. Although the characteristics and diversity of the neoblasts still await careful molecular elucidation, neoblasts may be totipotent stem cells (Reddien and Sánchez Alvarado, 2004). The use of stem cells to replace aged or damaged cells is important to the life of most metazoans, including humans, but poorly understood mechanistically (Weissman, 2000). Thus, planarians provide arenas for mechanistic investigation of in vivo stem cell regulation that are likely to inform the functioning of stem cells in all animals.
How can the function of genes regulating planarian biology be explored? One approach that has been pivotal in understanding the biology of multiple metazoans, including D. melanogaster (Nusslein-Volhard and Wieschaus, 1980), C. elegans (Brenner, 1974), and Danio rerio (Driever et al., 1996; Haffter et al., 1996), involves large scale functional genetic surveys, or mutant screens. Such an approach has historically been precluded by planarian life cycles. The development of dsRNA-mediated genetic interference (RNAi) (Fire et al., 1998) and the application of RNAi to systematic studies of gene function (Fraser et al., 2000; Gonczy et al., 2000) has opened the door for a new generation of genetic manipulations. Since RNAi is an effective methodology for perturbing planarian gene function (Sánchez Alvarado and Newmark, 1999), the in vivo activities of planarian genes can now be addressed for the first time. We developed an RNAi-based screening strategy and performed the first large-scale survey of gene function in planarian biology, with an emphasis on the processes of tissue homeostasis and regeneration. We selected 1065 genes, intended to be a representative sampling of the planarian S. mediterranea genome, and found that RNAi of 240 of these genes generated phenotypes. Inherently potent in the RNAi-screening strategy is the fact that known gene sequences allow immediate association of phenotypes with predicted biochemical function(s). Since this screen is the first systematic investigation of gene function in planarians, essentially all of the RNAi phenotypes and associated genes are new. Additional experiments involving the study of gene function in homeostasis, neoblast proliferation, and blastema differentiation and patterning allowed grouping of genes into functional categories. Together, our data presents a broad survey of the genetic control of planarian biology and identifies genes with candidate functions in the sequential events of regeneration.
Results
An RNAi screen in S. mediterranea
RNAi has been demonstrated to result in specific and near complete elimination of detectable S. mediterranea mRNA and proteins (Newmark et al., 2003; Sánchez Alvarado and Newmark, 1999; data not shown). Nonetheless, since it is impractical to monitor protein levels for the products of each gene in an RNAi screen, some phenotypes resulting from dsRNA treatment could reflect incomplete gene loss of function. The RNAi by feeding methodology used for our screen involves expressing dsRNA from a planarian gene in bacteria and suspending those bacteria with blended liver and agarose (Newmark et al., 2003). We optimized the feeding method and protocol used in this manuscript (Figure 1, methods) through extensive experimentation (data not shown). We generated an RNAi vector (pDONRdT7) that contains two T7 RNA polymerase promoters flanked by two class I T7 transcriptional terminators (Figure 1A) that results in more effective RNAi than does the conventional vector (data not shown). pDONRdT7 utilizes a modified Gateway cloning strategy (Invitrogen) to facilitate cDNA transfer.
Figure 1.
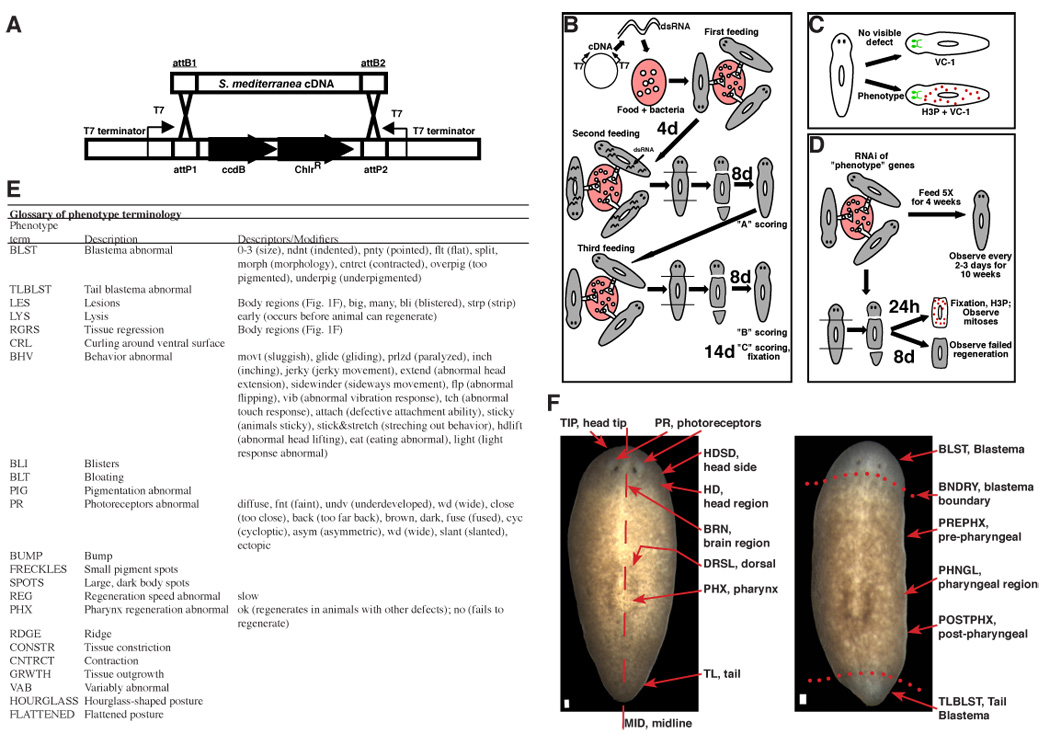
RNAi screening strategy. (A) S. mediterranea cDNAs were transferred into pDONRdT7, which contains two T7 promoters and terminators, using a single-step Gateway (Invitrogen) reaction (see methods). (B) Screening procedure (see methods for details). (C) Animals with a phenotype were labelled with αH3P (mitotic neoblasts) and VC-1 (photoreceptor neurons). Animals with no phenotype were labelled with VC-1 and screened for defects. (D) 143 genes that conferred phenotypes following RNAi and amputation were inhibited with five dsRNA feedings, left intact, and observed for six weeks. Presence and capacity to divide of neoblasts was assessed by amputation, fixation, and labeling with αH3P (see methods). (E) Systematic phenotype nomenclature: uppercase “phenotype terms” with lowercase “descriptors” in parentheses, with lowercase “modifiers” in brackets. Blastema size descriptors refer to mean animal blastema size, ranging from 0 (none) to 3 (normal). e.g., BLST(0.5) indicates half of the animals had no detectable blastema and half of the animals had a size “1” blastema. This glossary can be used to examine phenotypes shown in Tables 2, S1, S4, Figure 2, Figure 6 and supplemental tables. (F) Planarian anatomy and terminology for body regions used to describe phenotypes. Wild-type dorsal surfaces, clonal line CIW-4 asexual S. mediterranea animal (left) and regenerating animal (right) face the viewer. Anterior, top. Bar, 0.1 mm. Photoreceptors (PR) sense light. The brain region (BRN) lies posterior and ventral to the PR. The pharynx (PHX) controls feeding and defecation. Head and tail were removed from the regenerating animal (right). Nine days of regeneration have occurred, and blastemas (BLST) are visible (unpigmented regions).
S. mediterranea cDNAs randomly selected from two cDNA libraries were inserted into pDONRdT7 and introduced into the RNaseIII-deficient bacterial strain HT115 (Timmons et al., 2001). The two cDNA libraries were derived from a neoblast-enriched cell population and animal heads; all cDNAs used define unique genes (see methods). 1065 genes were inhibited using RNAi by feeding. Given the S. mediterranea genome sequence is currently incomplete, it is unknown what percentage of the total number of S. mediterranea genes these 1065 represent. The screen protocol consisted of three feedings, two rounds of regeneration following amputation of heads and tails, and three scorings (Figure 1B). Animals were scored for size of head blastemas on trunks and tails, size of tail blastemas, ability of tails to regenerate a pharynx in pre-existing tissues, shape of blastemas, presence and pattern of photoreceptors, light response, vibration response, touch response, flipping, locomotion, turning, and head lifting. Many animals, both with and without a detectable defect, were fixed and analyzed by antibody labeling to detect additional phenotypes at the cellular level (Figure 1C). Multiple RNAi feedings and two rounds of regeneration likely minimized protein perdurance. The multiple scoring timepoints served to determine degrees of phenotype expressivity, since aspects of a particular phenotype might be observed in the initial scoring and precluded by a more severe aspect of the phenotype in the latter scoring.
Development of a nomenclature system for comparisons of phenotypes
This manuscript contains a large amount of new phenotype terminology and involves the presentation of large datasets. Comparisons of phenotypes can allow the clustering of genes into candidate functional categories. There is, however, a practical problem involving the comparisons of phenotypes that are descriptive. Because essentially all of the phenotypes reported in this manuscript are new, we have devised a nomenclature system that allows common usage of descriptive terms for different phenotypes and comparison of different regeneration defects. To assist the reader, major terms used to define phenotypes are listed in Figure 1E; planarian body regions related to locations where defects were observed, and the terms used in phenotype descriptions to identify these regions, are presented in Figure 1F.
240 genes for which RNAi generates a phenotype have been identified
Of the 1065 genes perturbed by RNAi, 240 (22.5%) conferred specific phenotypes when perturbed (Table 1, Table 2, S1). A sampling of the spectrum of phenotypes observed can be found in Table 1 and Figure 2A–J. Genes are identified in Tables and Figures with an RNAi clone identification name in which the letter(s) “H” or “NB” refer to genes from the head or neoblast-enriched cDNA libraries, respectively, “E” indicates that clones are “entry” clones in the Gateway naming system, and the alphanumerical code refers to 96-well plate coordinates. Many phenotypic categories were uncovered, including the inability to regenerate (Figure 2B). Blastema-size abnormalities have been categorized on a scale from 0 to 3, with “BLST(0)” referring to no regeneration and “BLST(3)” referring to normal regeneration (Figure 1E, Figure 2B). Other major phenotypic categories include ventral curling (Figure 2B), blastema shape and morphology abnormalities (Figure 2C), a variety of photoreceptor abnormalities (Figure 2D), behavioral defects (Tables 2, S1), tissue regression (Figure 2E), lesions (Figure 2F), and lysis (Figure 2F). We also uncovered a large number of unexpected and surprising phenotypic categories that occurred with lower frequency. Examples include defects unique to caudal blastemas (TLBLST, Table 2, Figure 2B), animals that glide sideways (Table 2), animals with signs of asymmetry (Tables 2, S1, Figure 2D, Figure 5H), animals with abnormal posture (Figure 2H), animals with pigment “freckles” in the normally unpigmented blastemas or darkened body spots (Figure 2I), and animals with ectopic growths and photoreceptors (Figure 3J, Figure 5J). These defined phenotype categories can be used as tools for the study of cellular events and genetic regulatory mechanisms that control the poorly understood biology of planarians.
Table 1. Summary of S. mediterranea RNAi screen results.
Phenotype details are in Figure 1E, F, Table 2. Since the phenotype of many genes involved multiple defects, a particular gene may fall into multiple categories. Each gene falls into only one functional category. Homology details are in Tables 2, S1.
| Screen and phenotype details | No. Genes | Functional category | No. Genes |
|---|---|---|---|
| Total screened | 1065 | Translation | 39 |
| Total with phenotype | 240 | No match | 35 |
| No regeneration | 69 | Signal transduction | 29 |
| Limited regeneration | 35 | Metabolism | 19 |
| Reduced regeneration | 36 | Transcription/chromatin | 17 |
| Caudal blastema | 6 | RNA binding | 16 |
| Regression | 23 | Cytoskeleton | 13 |
| Curling | 48 | Protein degradation/protease | 12 |
| Blastema morphology | 43 | Vesicle/protein trafficking | 11 |
| Photoreceptors | 79 | Novel with homology | 8 |
| Lesions | 20 | Cell cycle/DNA repair | 8 |
| Lysis | 76 | Channels & transporters | 7 |
| Blisters &/or Bloating | 8 | Neuronal | 7 |
| Behavior | 44 | Disease | 6 |
| Pigmentation | 8 | RNA splicing/metabolism | 5 |
| Antibody only | 20 | Cell adhesion/ECM | 4 |
| Other | 15 | Protein folding/stability | 4 |
Table 2. 240 genes confer phenotypes in S. mediterranea.
See Figure 1E, F for phenotype terminology. “a” observed in “A” scoring (Figure 1B), “c”, observed in “C” scoring (all others observed in “B”). Blastema size: trunk cephalic; smll, small (when number unavailable); hyphen, for large range. Normal sizes not noted. Body fragments: hdfrg, head; tlfrg, tail. Body regions abbreviations are in Figure 1F. If BLST(>1), PR(no) noted if absent; if BLST(≤1), PR(ok) noted if present, nothing noted if absent. If BLST(≤2), “PHX” noted if abnormal and “PHX(ok)” if not. Nothing noted if pharynx data inconclusive. For BLST(≥2.5) ok pharynx regeneration not noted. Eating noted only when should have been possible. Days (d) following amputation noted if schedule atypical.
| Gene ID | Homology | Phenotype | ||
|---|---|---|---|---|
| RNAi limits regeneration, BLST(0–1.5), and causes curling (n=47) | ||||
| HB.14.06d | Argonaute | BLST(0); CRL; LYS(c) | ||
| HE.2.01H | Histone deacetylase 2 | BLST(0); CRL; LYS | ||
| NBE.1.04E | ribosomal protein L3 | BLST(0); CRL; LYS | ||
| NBE.3.08C | H.s.spastic paraplegia | BLST(1.5,ndnt); PHX; PR(no); RGRS(c,blst); CRL(c) | ||
| NBE.3.11F | chondrosarcoma CSA2 | BLST(0,ndnt[c]); REG(slow); CRL | ||
| NBE.4.04D | ADP-ribosylation GAP 3 | BLST(a,0); CRL(a); LYS(a) | ||
| NBE.4.06D | RNA-binding prot S1 | BLST(0,ndnt[c]); CRL; LYS(c) | ||
| NBE.4.08A | Prohibitin | BLST(0); CRL(c); LYS(c) | ||
| NBE.4.08C | PI transfer protein | BLST(0); RGRS; CRL(c); LYS(c) | ||
| NBE.4.10B | CDC23 | BLST(0); PHX; CRL(c); LYS(c) | ||
| NBE.6.12E | replication prot A1 | BLST(1); RGRS(c); CRL(c); LYS(c) | ||
| NBE.6.12H | anion/sugar transporter | BLST(0); CRL | ||
| NBE.7.07D | poly(A) binding prot II | BLST(1); PHX; CRL(c); LYS(c) | ||
| NBE.7.08A | Sec24C | BLST(a,0); CRL(a); LYS(a) | ||
| NBE.8.02D | Tubulin, gamma 1 | BLST(0.5); PHX; CRL(c) | ||
| NBE.8.12D | DEAD box; eIF-4a-like | BLST(0); CRL; LYS | ||
| Other, 31(ribosomal(18), splicing(2), metab(3), chaperones(3), proteasome(2), No match(3)) | ||||
| RNAi limits regeneration, BLST(0–1.5) (n=51) | ||||
| HE.1.07A | DEAD box polypeptide | BLST(1.5,ndnt); PR(no) | ||
| HE.2.01A | THOC4 protein | BLST(1.5); RGRS(b,blst) | ||
| HE.3.03B | SMAD4 | BLST(0.5,ndnt[a]) | ||
| HE.3.03E | prot phosphatase 1cgamma | BLST(0,split[c]); PHX; BUMP | ||
| HE.3.05A | Topoisomerase | BLST(1); PHX; PR(no) | ||
| HE.3.10F | Baf53a | BLST(1); REG(c,slow); PHX | ||
| HE.3.12B | Sec61 | BLST(a,1,ndnt); LYS(a) | ||
| HE.4.02E | DEAD box RNA helicase | BLST(1) | ||
| HE.4.05E | signal recog particle 54k | BLST(0); LES; LYS | ||
| NBE.2.01F | chromobox homolog 1 | BLST(0); PHX; RGRS | ||
| NBE.2.09B | Cyclin L1 | BLST(1.5,pnty); PHX; PR(fnt,cyc); RGRS(c); LES(c,phngl,big); LYS(c) | ||
| NBE.2.10C | tumor suppressor prot101 | BLST(a,1); PHX(a); LYS(a,early) | ||
| NBE.3.01A | K+ channel regulator | BLST(0–2); PR(close); RGRS(blst) | ||
| NBE.3.03G | Rho1 GTPase | BLST(1.5); TLBLST(c,smll,ndnt) | ||
| NBE.3.10d | U2 snRNP A’ | BLST(0.5,ndnt[a]); PHX; PR(no) | ||
| NBE.4.04F | Structure spec recog prot1 | BLST(0.5); PR(no); LYS(c) | ||
| NBE.4.12G | G protein suppressor 1 | BLST(1); PR(back); VAB | ||
| NBE.6.02C | Chromatin assemb fctr1 P55 | BLST(1,morph); PHX; PR(no,asym) | ||
| NBE.6.07H | striatin | BLST(0.5); PR(no); LYS(c) | ||
| Other, 32(TLN(14), metab(8), proteasome(3), protein sorting(4), no match(3)) | ||||
| RNAi limits regeneration, BLST(0–1.5), and perturbs behavior (n=6) | ||||
| HE.2.09G | RNA helicase | BLST(1); BHV(hdfrg) | ||
| HE.3.07A | Sly1 | BLST(a,smll); BHV(a); LES(a); LYS(a) | ||
| HE.3.07H | Novel | BLST(1.5,flt); PHX; PR(close); RGRS(c,pr[mid]); BHV(movt,flp,vib,light) | ||
| NBE.2.03h | No Match | BLST(1.5); PHX; PR(undv); BHV(a,movt,flp,vib,light) | ||
| NBE.2.09A | KH domain | BLST(1.5); PHX; PR(fnt;wd); BHV(movt,flp,tch,light) | ||
| NBE.6.09E | cyclin B5 | BLST(1.5); PR(no); BHV(movt,light); RGRS(c,blst) | ||
| RNAi reduces regeneration, BLST(2–2.5) (n=24) | ||||
| HB.19.8f | histone acetyltransferase | BLST(2); PR(fnt) | ||
| HE.1.01F | adenylate cyclase-assoc prot1 | BLST(2); PHX(ok); PR(fnt); LYS(c) | ||
| HE.1.06C | Actin | BLST(2); PHX; PR(fnt) | ||
| HE.1.06D | DEAD-box protein 54 | BLST(2); TLBLST(ndnt); PR(no,fnt) | ||
| HE.3.02A | WW domain prot2 | BLST(2); PHX(ok); BHV(sticky) | ||
| NBE.1.12F | TIMM50 phosphatase | BLST(2,morph) | ||
| NBE.2.09G | WD-40 repeat | BLST(2,overpig[bndry]); PHX; PR(close); CRL(c) | ||
| NBE.3.03D | serum response factor | BLST(2); PHX(ok); PR(diffuse); PIG(c,pr) | ||
| NBE.5.03E | ComB | BLST(2); PR(back); RGRS(c,tip) | ||
| NBE.7.09G | Mak16/RNA binding protein | BLST(2); PHX; PR(fnt,asym) | ||
| Other, 14 (TLN(5), metab(5), no match(3), vesicle traffic(1)) | ||||
| RNAi reduces regeneration, BLST(2–2.5), and perturbs behavior (n=11) | ||||
| HE.3.09F | casein kinase I | BLST(2); PR(wd); BHV(movt,eat) | ||
| HE.4.05F | sec granule neuroendocrine prot | BLST(2.5); BHV(movt,flp,vib,light); FLATTENED | ||
| NBE.1.05B | Elongation factor Tu | BLST(2, flt); PHX(ok); PR(back); BHV(movt) | ||
| NBE.1.12G | Tropomyosin 2 | BLST(2); BHV(movt,flp,light); HOURGLASS; LYS(c) | ||
| NBE.5.01A | APC subunit 1 | BLST(2,flt); PHX(ok); RGRS(c,tip); BHV(movt,flp) | ||
| NBE.5.04A | POU domain gene 50 | BLST(2.5); BHV(movt); SPOTS; BLI; BLT | ||
| NBE.6.09C | TXN coactivator tubedown100 | BLST(2,overpig[a]); PHX(ok); PR(no); BHV(jerky,flp,vib,light) | ||
| NBE.8.01B | NA/K-transporter | BLST(2,cntrct); BHV(prlzd,flp,vib,light); LYS(c) | ||
| Other, 3(no match) | ||||
| RNAi allows regeneration but causes tissue regression (n=4) | ||||
| HE.2.11C | MyosinII essential light chain | RGRS(c,asym) | ||
| NBE.2.08E | zinc transporter | PR(asym); RGRS(c,hdsd) | ||
| NBE.3.05F | FKBP-like | RGRS(c,blst) | ||
| NBE.4.12H | No Match | PHX; RGRS(c,hdblst) | ||
| RNAi perturbs blastema morphology but not formation (n=11) | ||||
| H.68.04A | Slit | BLST(flt); PR(slant,ectopic[41d]); GRWTH(c) | ||
| HE.1.05E | ACTG1 | BLST(pnty); PR(cyc); BHV(eat); BMP | ||
| HE.1.06A | synaptotagmin | BLST(pnty) | ||
| HE.2.07D | tolloid-BMP-1 | BLST(ndnt) | ||
| myoD | MyoD | BLST(pnty) | ||
| NBE.1.11D | moesin | BLST(pnty); PR(fuse) | ||
| NBE.2.06D | No Match | BLST(rdge,pnty); PR(fuse); BHV(hdlift) | ||
| NBE.3.12A | common-site lymphoma GEF | BLST(flt) | ||
| NBE.5.01G | neurexin I | HDBLST(ndnt); TLBLST(Split) | ||
| NBE.5.05E | Dorsal switch protein 1 | BLST(pnty); PR(fuse) | ||
| NBE.8.12A | ubiquitin activating enzyme | PR(wd); LES(c); VAB; GRWTH(c,tlfrag[pr]) | ||
| RNAi allows regeneration but perturbs photoreceptor formation (n=26) | ||||
| HE.1.03A | rab GDI | PR(fnt); LES(prephx) | ||
| HE.2.03F | DEAD box RNA helicase | PR(fnt) | ||
| HE.2.05E | myocyte enhancing factor 2 | PR(fnt); BHV(attach,eat) | ||
| HE.3.02C | ACY1L2 protein | PR(fnt,fuse,brown) | ||
| NBE.1.01E | polypyrimidine binding prot | PR(fnt) | ||
| NBE.1.05H | RGS9 | PR(no); BHV(light) | ||
| NBE.1.11C | Ku70-binding protein | PR(fnt) | ||
| NBE.4.10D | memb-bound O-acyl transferase | PR(fnt); BHV(light); FLATTENED | ||
| NBE.6.04A | HMGB2 protein | PR(fnt) | ||
| NBE.6.04H | tumor differentially expressed 2 | BLST(overpig); PR(fnt); BHV(light) | ||
| NBE.6.06A | senescence downregulated leo1 | PR(no,fnt) | ||
| NBE.7.03B | Rab-related GTPase | PR(fnt) | ||
| NBE.7.03H | signal recog particle rec, B | PR(c,fnt) | ||
| NBE.7.09D | ribonuclease | PR(fnt) | ||
| NBE.8.07H | astacin | PR(fnt); BHV(light) | ||
| Other, 11(no match/novel(6), metabolism(2), proteolysis(2), protein sorting(1)) | ||||
| RNAi allows regeneration but causes abnormal behavior (n=25) | ||||
| HE.1.01H | beta tubulin | BLST(cntrct); BHV(prlzd,flp,vib,tch,light); BLT; BLI; LYS(c) | ||
| HE.1.02E | coiled-coil, rootletin | BHV(movt,flp,tch); BLI; BLT | ||
| HE.1.03G | tubulin, alpha 3 | BLST(cntrct); BHV(glide,flp,vib,light); BLI; BLT; LYS(c,hdfrg) | ||
| HE.1.08G | Spectrin alpha chain | FRECKLES; BHV(movt,vib) | ||
| HE.1.08H | RNA-binding Cpo/MEC-8 | BHV(movt,flp,eat) | ||
| HE.2.02B | proprotein convertase 2 | BLST(2); BHV(prlzd,flp,vib,tch,light); LYS | ||
| HE.2.07B | Polypyrimidine binding prot2 | BHV(movt,flp); FLATTENED | ||
| HE.3.02G | inositol polyP multikinase | BHV(eat) | ||
| HE.3.06G | clathrin-associated protein | PR(diffuse); BHV(movt,flp,vib) | ||
| HE.4.01H | Na/K ATPase Transporter | BHV(movt,extend,flp,vib,light) | ||
| NBE.1.11B | nudC | PHX; PR(no); BHV(movt,flp); LES(c); LYS(c) | ||
| NBE.6.12B | Transcription factor BTF3 | BHV(movt,flp,light); LYS(hdfrg; tlfrg) | ||
| NBE.7.02G | GTP-binding reg beta chain | TLBLST(split); BHV(movt,flp) | ||
| NBE.7.10A | Zinc Finger Iguana/Dzip1 | BHV(inch,vib); BLI; BLT | ||
| NBE.8.03E | Outer dense fiber sperm tails 2 | BHV(sidewinder,light) | ||
| NBE.8.11B | Pre-acrosome localization prot | BHV(inch,eat) | ||
| NBE.8.11C | hepatocell carcinoma antigen127 | BHV(stick&stretch) | ||
| NBE.8.11E | WD-40 repeat g-prot beta-like | BHV(movt,flp); HOURGLASS; BUMP; LYS(c,hdfrag,tlfrag) | ||
| Other, 6(no match/novel) | ||||
| RNAi primarily causes early lysis (n=8) | ||||
| HE.3.01G | Na/K ATPase alpha | LYS(early) | ||
| HE.3.04D | no match | LYS(early) | ||
| HE.3.11E | Contactin | LYS(a,early) | ||
| NBE.1.07G | 60S ribosomal protein L9 | BLST(a,smll); BHV(a,movt); LYS(a) | ||
| NBE.5.12D | proteasome beta 4 subunit | LYS(a) | ||
| Other, 3(ARP2/3 subunits(2), no match(1)) | ||||
| RNAi allows regeneration but causes other defects (n=27) | ||||
| HE.4.06F | No Match | TLBLST(0,ndnt); PR(c,no) | ||
| NBE.3.07F | hunchback TXN factor | SPOTS, BLI, BLOAT | ||
| NBE.7.07H | nucleostemin/GTPase | TLBLST(0,split); REG(slow[phx]); PR(fnt) | ||
| NBE.7.09H | 3-hydroxybutyrate dehydrog | PHX(big) | ||
| NBE.8.03C | No Match | FRECKLES | ||
| NBE.8.09D | activin receptor kinase | BHV(light); FLATTENED; RDGE(drsl) | ||
| VC-1 only (n=11), H3P only (n=7), H3P/VC-1 (n=3) | ||||
Figure 2.
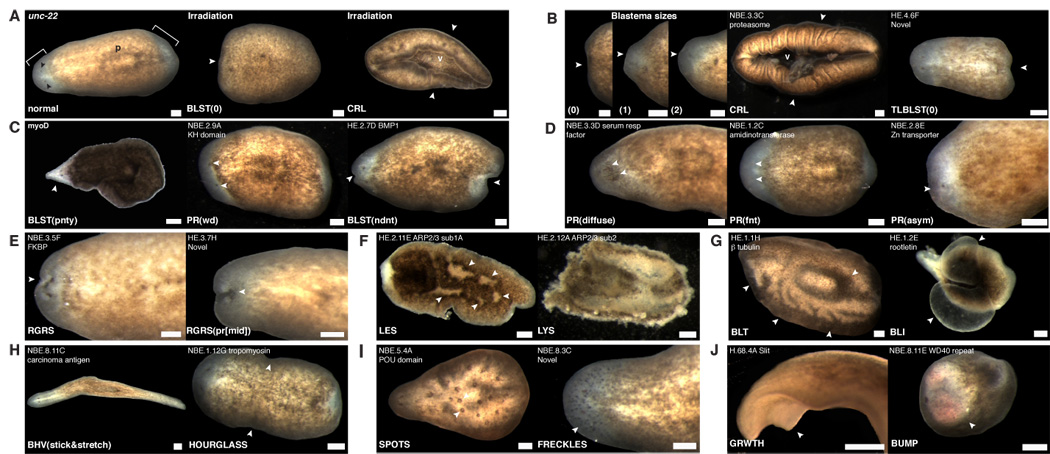
Representative phenotypes from the RNAi screen. Phenotype nomenclature and homologies are in Table 2. White arrowheads, defects. Anterior, left. v, ventral surface. Bar, 0.2 mm. (A) Control, unc-22 (a C. elegans gene) RNAi animal. Irradiation at 6000rad blocked regeneration (BLST(0), 8d) and caused curling (CRL, 15d). Black arrowhead, photoreceptor. P, pharynx. Brackets, blastema (unpigmented). (B) Reduced regeneration, curling, and caudal regeneration defects. (C) Pointed, wide, and indented blastemas. (D) Diffuse, faint, and asymmetric photoreceptors. (E) Regression of the anterior tip and between the photoreceptors. (F) Lesions and lysis. (G) Bloated and blistered. (H) Sticking and stretching and hourglass postures. (I) Spots and freckles. (J) Growth and bump.
Figure 5.
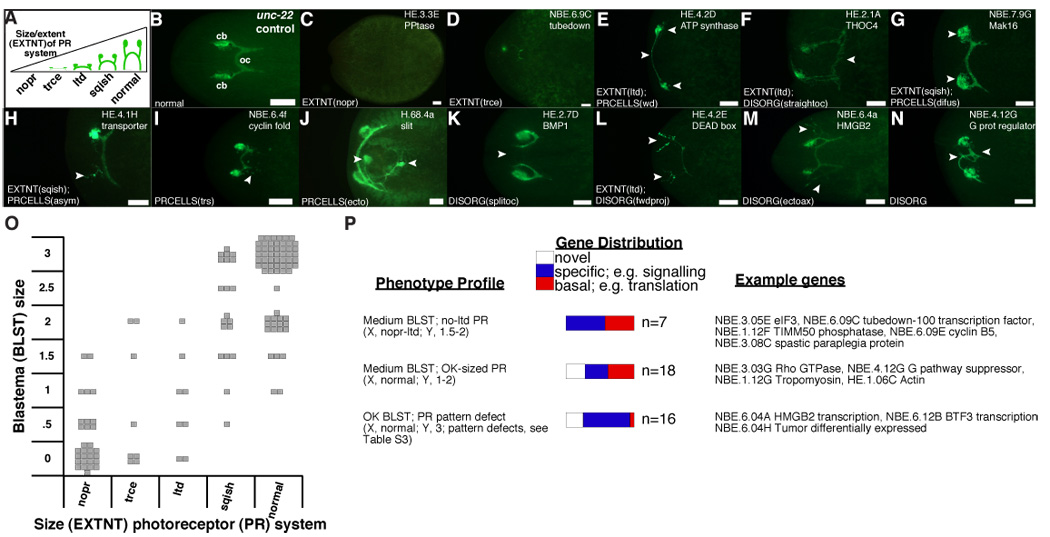
Analyses of blastema differentiation and pattern formation in animals with screen phenotypes. (A–N) Anterior, left. (A) Photoreceptor system defect terminology. EXTNT, photoreceptor regeneration extent abnormal; descriptors: nopr, no photoreceptors; trce, trace development; ltd, limited development; sqish, slightly underdeveloped. (B) Normal photoreceptors. oc, optic chiasmata. cb, cell bodies. (C–N) Representative defects. Bar, 0.1 mm. Arrowheads, abnormalities. PRCELLS, photoreceptor cell bodies abnormal. Descriptors: wd, photoreceptors wide; difus, diffuse clustering; asym, asymmetry; trs, tears, ectopic neurons posterior to cluster; ecto, ectopic photoreceptor. DISORG, axon disorganization. Descriptors: straightoc, oc straight; splitoc, axons fail to cross midline; fwdproj, cell body projections toward anterior tip; ectoax, extra projections. H.68.4A RNAi cephalic ganglia were also labeled with α-synaptotagmin. (O) Cellular defect categorization. Left, each square represents mean phenotype of animals with a single gene inhibited. Y, blastema sizes: "0" (none) and "3" (normal). (P) X, Y scatter-plot coordinates for "phenotype profiles" are listed. Genes categorized as in 3B. Complete listing of data is in Table S3.
Figure 3.
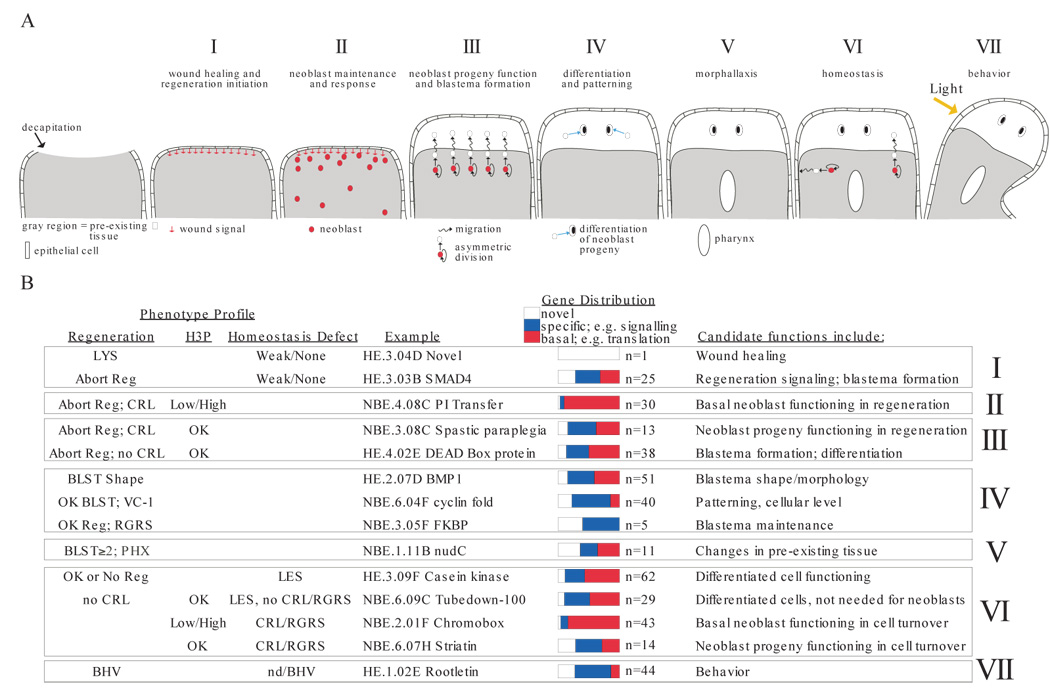
Identification of genes with candidate functions in planarian regeneration. (A) Planarian regeneration is divided into seven stages, “I” through “VII”. Anterior region of a decapitated planarian is shown, facing up. Wound healing involves epidermal cell spreading. The blastema is anterior and white. Stages correspond to numbered text sections in which phenotype categories are discussed. Neoblasts are depicted only when a process involving their function is described. V, pharynx formation occurs in pre-existing tissue of a fragment lacking original pharynx. (B) Gene groups sharing phenotype profiles are summarized. Profiles identify genes with predicted functions corresponding to regeneration stages in (A). Some genes are found in multiple categories. LYS, lysis. Reg, regeneration (blastema formation); “abort”, too small or no blastema. CRL, curling. BLST, blastema. VC-1, abnormal photoreceptors (see text, Table S3). PHX, pharynx regeneration in tail fragments. RGRS, tissue regression. BHV, behavior abnormal. H3P categorization as in Figure 4, Table S3. LES; lesions. Novel, no predicted function. Specific, if predicted to encode proteins involved in signal transduction, transcription, cell adhesion, neuronal functions, disease, RNA binding, channels/transporter function, cytoskeletal regulation. Basal, if predicted to encode proteins involved in translation, metabolism, RNA splicing, proteolysis, protein folding, vesicle trafficking, cell cycle, or cytoskeleton machinery.
85% of S. mediterranea genes associated with RNAi phenotypes are conserved
Of the 240 genes associated with RNAi phenotypes, 205 (85%) are predicted to encode proteins with significant homology (BLAST, E≤ 10−06) to those encoded in the genomes of other organisms (Tables 2, S1). This high frequency, coupled with the diverse set of predicted functions for these genes (Table 1), demonstrates the utility of studies of S. mediterranea for broadly informing general metazoan biology. For example, 38 of the genes associated with RNAi phenotypes are related to human disease genes (Tables 2, S2). These genes cause an array of phenotypes, ranging from aberrant regeneration following RNAi of a spastic paraplegia homolog (Casari et al., 1998) to aberrant photoreceptor regeneration and function following RNAi of an RGS9-like encoding gene, which is associated with bradyopsia (vision defects) in humans (Nishiguchi et al., 2004). Given that only eight of these 38 genes have a corresponding mouse knockout model, the S. mediterranea phenotypes provide new functional information and demonstrate the utility of S. mediterranea for the study of orthologs of human genes involved in genetic disorders. The remaining 35 genes associated with RNAi phenotypes, for which no obvious homologues were found in other phyla, may also be of medical relevance. These genes may be specific to the Platyhelminthes and required for the survival of related pathogenic platyhelminthes, the cestodes and trematodes (Tables 2, S1). Considering such pathogens are estimated to cause disease in nearly 300 million people throughout the world (www.who.int), these genes might make attractive drug targets.
Genes associated with similar and specific RNAi phenotypes may act together
We obtained a wide gamut of regeneration phenotypes from the RNAi screen. We categorized genes associated with these dsRNA-induced phenotypes into 11 groups as shown in Table 2. Table 2 also includes the homology of these genes (if any), and a code that describes the RNAi phenotype in detail (see Figure 1E, F as guides for phenotype terminology). RNAi-induced phenotypes and sequence homologies for some genes that are listed as “Other” in Table 2 can be found in Table S1.
We observed that RNAi of a number of different genes resulted in similar phenotypes, suggesting that such genes may be acting together. Sequence data supports this hypothesis. Specifically, genes predicted to encode proteins homologous to those known to act together in other organisms conferred similar phenotypes when perturbed independently. For instance, RNAi of two genes that encode different subunits of the ARP2/3 complex (HE.2.11E, HE.2.12A, Figure 2F), which is known to mediate actin filament nucleation (Weaver et al., 2003), caused early lysis; RNAi of two genes encoding components of TGF-β signalling (HE.2.07D BMP1, Figure 2C, HE.3.03B SMAD4) caused indented blastemas; and RNAi of α and β-tubulin-encoding genes (HE.1.01H, Figure 2G, HE.1.03G) caused uncoordinated behavior, blisters, and bloating (Tables 2, S1). These examples indicate that RNAi screening in S. mediterranea can readily generate specific phenotypes that allow identification of previously unknown functional associations. For instance, RNAi of NBE.3.07F or NBE.5.04A (Figure 2I) caused spots, blisters, and bloating. The first gene is similar to Drosophila hunchback, a gene known to regulate embryonic patterning (Irish et al., 1989), and the other encodes a POU domain protein (Table 2). Given the rarity of this phenotype, these two transcription factors may act together. Additionally, RNAi of only two genes, HE.1.08G and NBE.8.03C (Figure 2I), caused the “freckles” phenotype. HE.1.08G encodes an a-spectrin-like protein, a membrane cytoskeletal protein (Bennett and Baines, 2001), and NBE.8.03C encodes a protein with no known predicted function that may act with a-spectrin (Table 2). These examples are presented simply to illustrate that for the many phenotypic categories, including regeneration and neoblast abnormalities (see below), our data in Tables 2, S1, S3, S4, and Figure 2–Figure 6 identify shared properties that point to many candidate functional associations (see below for further examples).
Figure 6.
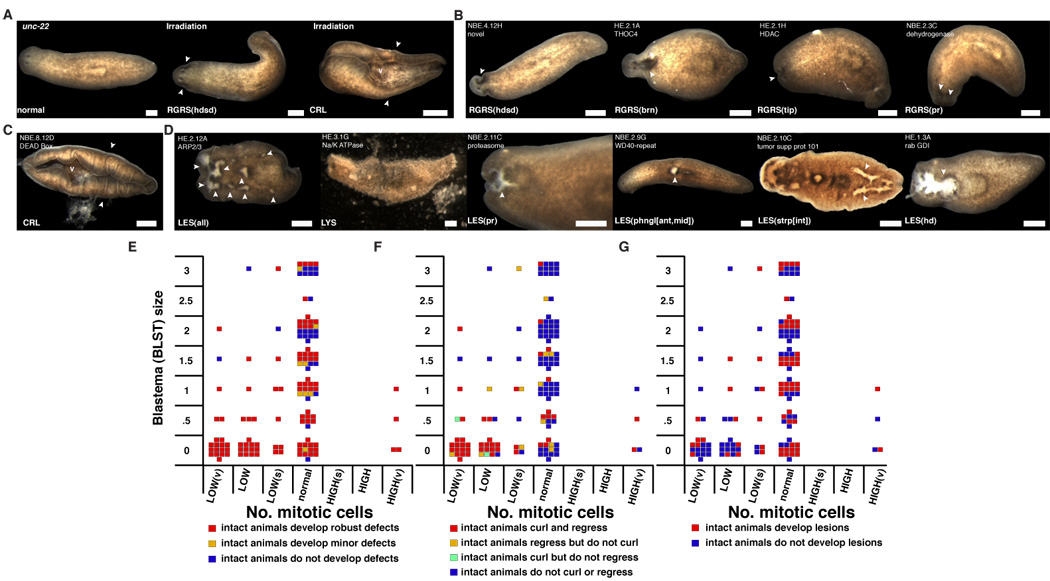
Homeostasis defects in dsRNA-fed animals. (A–D), Arrowheads, defects. v, ventral. Bar, 0.4 mm. Anatomy and nomenclature, Figure 1E, F. Additional terms: all, entire animal; ant, anterior half or the anterior end of a region; int, gastrovascular system. (A) unc-22 RNAi, negative control. Irradiation at 6000 rads caused tissue regression (8d) and curling (15d). (B) Regression. (C) Curling. (D) Lesions and lysis. (E–G), Each square represents mean phenotype with a single gene inhibited by RNAi. Square location for a given gene is the same in each panel. Y axis, blastema size with 3=normal and 0=no regeneration. X axis, number of cells labelled with αH3P (see Figure 4C). (E) Colors represent defects in intact RNAi animals. (F) Colors represent regression and curling defects in intact RNAi animals. (G) Colors represent lesion formation in intact RNAi animals.
Strategy for identifying genes that control distinct steps in regeneration
A series of stereotypical events following wounding produce a fully functional regenerated planarian (Figure 3A). I. Regeneration begins with the spreading of an epidermis over a wound surface followed by signaling that triggers the initiation of regeneration. II. Neoblasts are maintained in the parenchyma in appropriate numbers where they respond to wounds by proliferating. III. Neoblast progeny migrate and generate a blastema. IV. The cells within the regeneration blastema differentiate and organize to produce properly patterned structures. V. Changes occur in the pre-existing tissue of an amputated animal to generate new structures and a new animal with the proper proportions (morphallaxis). VI. Pre-existing tissue and the new tissue are maintained, involving the functioning of differentiated cells and the replacement of aged cells by neoblast progeny. VII. Finally, the regenerated animal restores the capacity to respond to its environment with appropriate behaviors. How can we identify the step of regeneration for which a given gene is needed? We performed additional experiments outlined below that, together with the regeneration data from the screen, allowed us to cluster genes into categories that correspond to the different phases of regeneration shown in Figure 3A.
I. Wound healing and regeneration initiation
In the absence of the ability to heal wounds, animals should lose tissue through the wound site and lyse. We observed that RNAi of at least nine genes caused lysis after wounding (Tables 2, S1). We reasoned that if a gene were needed specifically for wound healing, inhibition of that gene with dsRNA would not cause lysis in intact, non-amputated animals. We identified one gene, HE.3.04D, that fits these criteria (Figure 3B, Tables 2, S4, see homeostasis in Experimental procedures for details). HE.3.04D is predicted to encode a novel protein.
We reasoned that genes specifically involved in the initiation of regeneration following wound healing might be required for normal blastema formation, but not for the extensive cell turnover that occurs during normal adult planarian life (Newmark and Sánchez Alvarado, 2000). We inhibited 143 genes that were associated with dsRNA-induced regeneration defects in the screen and examined intact, non-amputated animals (Figure 1D, see Experimental procedures). We found that genes needed for regeneration also tend to be needed for homeostasis (P<0.005) (see below). However, RNAi of 35 out of 143 genes conferred no or only minor defects in intact animals (Table S4). 25 of these 35 genes were associated with smaller than normal blastemas in two separate RNAi experiments (Table S4, Figure 3B). One gene was important for the formation of caudal blastemas (HE.4.06F) and is predicted to encode a novel protein (Table S4). Four genes within this dataset, such as an FKBP-like immunophilin (NBE.3.05F), caused tissue regression following RNAi and regeneration (Tables 2, S4). Genes needed for complete regeneration but apparently not necessary for homeostasis include those predicted to encode proteins similar to chondrosarcoma-associated protein 2 (NBE.3.11F), nucleostemin (NBE.7.07H), a DEAD box RNA-binding protein (HE.1.06D), SMAD4 (HE.3.03B), Baf53a (HE.3.10F), and a WW-domain protein (HE.3.02A) (Table S4). Some of these genes could identify signaling mechanisms that specifically activate neoblasts following wounding or control other processes needed for blastema generation. One of these genes, SMAD4, stands apart as a gene necessary for any blastema formation but dispensable for neoblast function in homeostasis (Figure 3B). Since SMAD proteins mediate TGF-β signals (ten Dijke and Hill, 2004), this observation indicates that TGF-β signaling may control regeneration initiation in planarians.
II. Neoblast function: Comparison of phenotypes to defects in irradiated animals identifies candidate neoblast regulators
Irradiation of planarians is known to specifically kill the neoblasts, block regeneration, and result in lethality (Bardeen and Baetjer, 1904). We observed that amputated, irradiated (e.g., 6000rad) animals were incapable of regenerating (Figure 2A), curled their bodies around their ventral surface within 15 days (Figure 2A), and subsequently died by lysis. Genes for which RNAi causes defects similar to those of irradiated animals may be needed for neoblast function in regeneration. In total, 140 gene perturbations blocked, limited, or reduced regeneration (Tables 2, S1). RNAi of 48 of these genes caused curling (CRL), similar to that seen in irradiated animals (Tables 2, S1, Figure 2B). Lysis was the typical fate of these curled animals (Tables 2, S1). Although many of these genes may not have functions specific to neoblast regulation, we suggest that most if not all of these genes are required for neoblast function. These genes include basal cell machinery factors, RNA binding proteins (HB.14.6D, NBE.4.06D, NBE.7.07D, NBE.8.12D), signal transduction factors (NBE.4.08C, phosphatidyl inositol transfer protein; NBE.2.09G, WD40 repeat protein), chromatin regulators (e.g., HE.2.01H, histone deacetylase), and disease genes (e.g., NBE.3.08C, human spastic paraplegia protein) (Tables 2, S1).
II and III. Neoblast maintenance, proliferation, and progeny function
The genes for which RNAi caused defects similar to that caused by irradiation could be needed for neoblast maintenance and/or proliferation or the functions of neoblast progeny. We reasoned that direct observation of neoblast presence and proliferation in dsRNA-fed animals could help distinguish between these possibilities. We labeled dsRNA-fed animals with an antibody (αH3P, anti-phosphorylated histone H3 (Hendzel et al., 1997) that recognizes mitotic neoblasts (Newmark and Sánchez Alvarado, 2000). Numbers of mitotic nuclei were quantified and categorized as described in the Figure 4 legend. As a control, we observed no labeling of irradiated animals with αH3P, confirming αH3P specifically labeled mitotic neoblasts (Newmark and Sánchez Alvarado, 2000) (Figure 4A).
Figure 4.
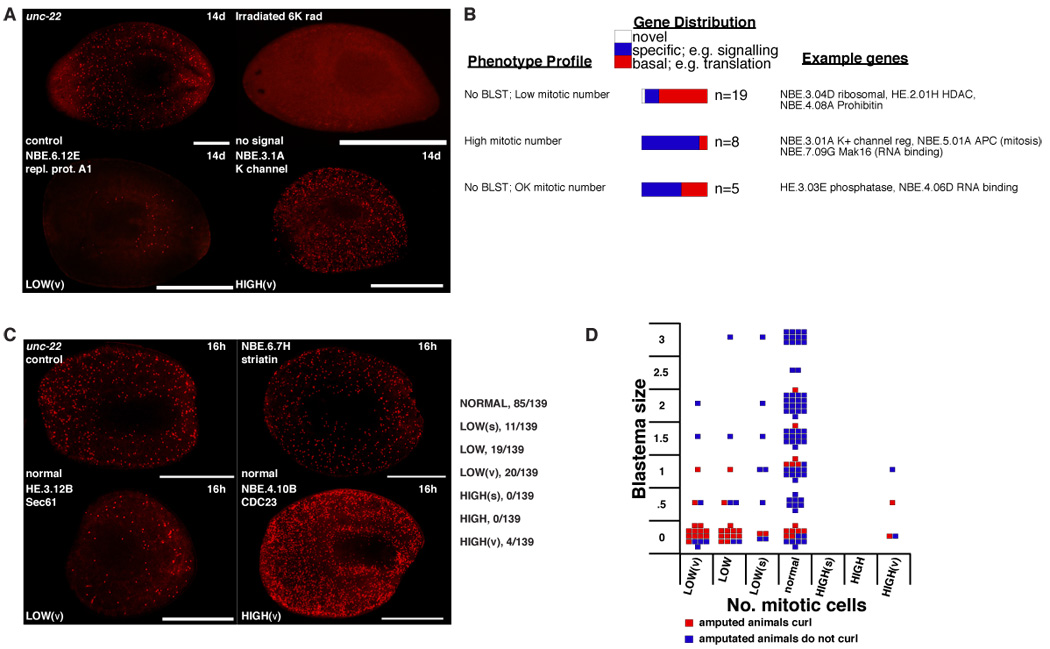
Representative mitotic defects in amputated animals. Anterior, left. (A) αH3P-labeling examples from the RNAi of 140 genes (see text). 14d, 14 days. Bar, 1 mm. Irradiated animals, 6000 rads. Control unc-22 RNAi animals had an average of 212±37 labeled cells/mm length (from photoreceptors to tail). Defects were categorized as LOW(v), LOW, LOW(s), normal, HIGH(s), HIGH, and HIGH(v) (“v”, very; “s”, slightly). LOW(s) threshold is set at control mean less 2× standard deviation (sd). This absolute value was divided into three equal ranges to set LOW and LOW(v). The same ranges added to the mean plus 2× sd set the high ranges. For those within 2× sd but visually abnormal, data were considered significant if P<0.01 (t-test). (B) Genes are characterized as in Figure 3B. (C) αH3P-labeling examples of RNAi animals fixed 16 or 24h, +/− feeding, after amputation (see text). Animals were fixed after the first or second amputation as appropriate. Control animals were fixed at 16h or 24h. Bar, 1 mm. Data categorized as in (A) above; numerator=number of genes in a particular category, 139=total number of genes analyzed. Complete table of results are in Table S4. (D) Each square represents mean phenotype of animals in which a single gene was inhibited by RNAi. Y axis, blastema size with 3=normal and 0=no regeneration. X axis, number of cells labelled with αH3P (see C). Colors represent whether RNAi of genes caused curling following amputation.
Two sets of animals were used: animals with visible phenotypes in the screen from the RNAi of 140 genes, fixed 14 days following amputation (“14dH3P;”; Figure 1C), and animals from the RNAi of 139 genes, which were fixed shortly following wounding to assess proliferation at the time of regeneration initiation (“24hH3P”; Figure 1D). The 139 genes in the 24hH3P dataset were selected because they were associated with a range of blastema-size phenotypes following RNAi and amputation (Figure 1D, see Experimental procedures). The genes associated with these two datasets (14dH3P and 24hH3P) only partially overlap, and the conclusions drawn from the data are similar. 14dH3P data are presented in Table S3. Data associated with overlapping genes in the 24hH3P and 14dH3P datasets are presented in Table S4 and grouped into four categories that incorporate homeostasis data (see below). Because the data can be grouped in multiple different and informative ways, we also present 24hH3P data in the form of scatter plots in Figure 4D, Figure 6E–G that allow visualization of how different aspects of phenotypes (regeneration, mitoses after wounding, and homeostasis) associate with one another following RNAi of individual genes.
We identified three main groups of mitotic numbers following the RNAi of genes in both datasets: too few mitoses, normal mitoses, and too many mitoses (Figure 4A–D). RNAi of 48 of 140 genes in the 14dH3P dataset and RNAi of 50 out of the 139 genes in the 24hH3P dataset led to low mitotic cell numbers. A large majority of animals with lower than normal numbers of mitotic cells also had defects in the production of normal sized blastemas (Tables S3, S4, Figure 4D). These genes might be important for neoblast maintenance or deployment. Such genes include those predicted to encode multiple components of the ribosome, cell cycle and chromatin regulators, and a phosphatidyl inositol transfer protein (Table S4). RNAi of eight of 140 genes in the 14dH3P dataset and of four genes in the 24hH3P dataset led to abnormally high numbers of mitotic neoblasts as compared to the control, indicating animals to be abnormal due to mitotic defects or misregulation of the neoblast population (Tables S3, S4, Figure 4A–D). Among these genes are two predicted to encode components of the proteasome, one predicted to encode gamma tubulin, and two predicted to encode anaphase promoting complex subunits (Tables S3, S4). Given the role of the anaphase-promoting complex and proteolysis in the progression of mitosis (Peters, 2002), the numerous candidate metaphase nuclei observed in these animals indicate possible defects in chromosome separation at mitosis. Genes for which RNAi caused curling after amputation were very likely to be required for regeneration (P<0.0001) and were often, but not always, associated with reduced mitoses following RNAi and amputation (Figure 4D). Therefore, genes for which RNAi caused curling, blocked regeneration, and caused low mitotic numbers may be needed for neoblast maintenance or mitoses.
RNAi of 84 of 140 genes in the 14dH3P dataset and RNAi of 85 of 139 in the 24hH3P dataset led to relatively normal numbers of mitotic cells (Tables S3, S4, Figure 4B, C, D). Many of these genes are needed for regeneration; for example RNAi of 38 of the 85 genes in the 24hH3P dataset allowed normal numbers of mitotic neoblasts after wounding but caused regeneration of very small blastemas and curling (BLST≤1.5, Figure 4C, D). Among these 38 genes are five predicted to encode RNA-binding proteins and five predicted to encode signal transduction proteins (Table S4). These genes may control regeneration initiation, or the ability of neoblast progeny to form differentiated cells or to organize into a blastema. RNAi of 13 genes did not reduce mitotic numbers, but, nonetheless, blocked regeneration and caused curling--suggesting they were involved in neoblast functions (Table S4, Figure 3B). These genes might be needed for the functioning of neoblast progeny rather than neoblasts per se. Examples of such genes include those encoding a striatin-like protein and an RNA-binding protein (Table S4).
IV. Differentiation and patterning of the regeneration blastema: morphological analyses
Following initial blastema formation, blastemal cells differentiate to produce missing structures. We identified a large number of genes needed for normal blastema morphology and patterning (Figure 3B). Defects observed include indented, pointed, and flat blastemas, as well as wide, faint, and no photoreceptors (Table 2, Figure 2C, D). The molecular identities of these blastema-patterning genes can be found in Tables 2 and S1. These phenotypes reveal unexpected aspects of planarian biology and identify at least some genes that govern how a collection of undifferentiated cells within a cephalic blastema becomes organized to produce a new, functional head. Below, we highlight several examples of the diversity and implications of the phenotypes within this category.
Wild-type planarians are bilaterally symmetric with no known asymmetry (Hyman, 1951); however, RNAi of five genes caused asymmetric regeneration of photoreceptors (Tables 2, S1, Figure 2D, Figure 5H). Given that we have not seen asymmetric effects of dsRNA treatment on gene expression and that asymmetric phenotypes are rare, these observations indicate active mechanisms may exist for maintaining symmetry in animal species that lack asymmetry. These genes include a Zn transporter (NBE.2.08E) and a Mak16-like protein (NBE.7.09G). 18 genes were associated with regression (RGRS) of blastemas following RNAi, possibly the result of defects in blastema maintenance (Table 2, Figure 2E, Figure 3B). Examples include HE.2.11C myosin II light chain and NBE.3.05F FKBP. RNAi of the candidate axon guidance regulator H.68.4A Slit resulted in the regeneration of ectopic midline neuronal tissue and ectopic axis formation (Tables 2, S3, Figure 5J). The formation of photoreceptors may thus be regulated by the spatial location of the brain. Finally, indented blastemas in HE.2.07D BMP1(RNAi) animals indicate BMP signalling, which regulates dorsal-ventral patterning and other morphogenic events (De Robertis and Kuroda, 2004), may control regeneration of midline tissues (Table 2, Figure 2C, Figure 5K). Although it was anticipated that rare and unusual phenotypes might be uncovered, what these unusual phenotypes would be and what they would indicate about planarian biology were entirely unknown. Defects such as these not only illuminate the genetic control of specific aspects of planarian biology, but also illustrate that undiscovered roles for known genes in understudied biological processes can be identified in planarians.
IV. Differentiation and patterning of the regeneration blastema: cellular analyses
Next, we utilized animals that regenerated abnormally in the screen from the RNAi of 140 genes, and assessed defects in patterning and differentiation using immunohistology (Figure 1C). Animals were fixed after 14 days of regeneration and labeled with an antiarrestin antibody (VC-1) that recognizes planarian photoreceptors (Sakai et al., 2000), a kind gift of K. Agata). These same animals were also scored for mitoses with αH3P (Figure 1C, see above). We chose the photoreceptor neurons for study because they exist in two well-defined clusters of ~24 cells and extend easily visualized posterior and ventral processes to the cephalic ganglia (Carpenter et al., 1974) (Figure 5B). The photoreceptors, therefore, serve as simple landmarks for pattern formation in cephalic blastemas.
A large variety of photoreceptor abnormalities were uncovered (Table S3, Figure 3B, Figure 5C–N). Phenotypes include limited regeneration of the photoreceptor system (Figure 5C–H), photoreceptor cell bodies dispersed posteriorly from the main neuron cluster (“tears” phenotype) and/or ectopic photoreceptors (Figure 5I, J), diffuse clusters of photoreceptor neurons (Figure 5G), asymmetric photoreceptor cell body clusters (Figure 5H), optic chiasmata defects (Figure 5F, K), axon abnormalities (Figure 5L, M), and general disorganization (Figure 5N). These defects revealed not only the various degrees of differentiation that are possible in abnormal blastemas, but also the cellular and patterning abnormalities associated with specific gene perturbations (Table S3, Figure 5). For example, RNAi of NBE.3.03D serum response factor resulted in diffuse pigment cups in the visible screen; dispersed photoreceptor cell bodies were uncovered in the VC-1 screen (tears, Table S3). In another example, RNAi of NBE.6.04A HMGB2 caused faint photoreceptors in the visible screen; severely disorganized axons were uncovered in the VC-1 screen (ectoax, Figure 5M). Homologies of other genes associated with RNAi-induced patterning defects can be found in Table S3.
A scatter plot depicting the correlation between blastema size and the degree of photoreceptor system formation in dsRNA-treated animals identifies several trends (Figure 5O, P). First, the vast majority of genes for which RNAi severely compromised cephalic regeneration were needed for detectable photoreceptor development (BLST(0–0.5), Figure 5O). By contrast, many medium-sized blastemas, BLST(1–2.5), can differentiate and organize reasonably well (Figure 5O). Defects within slightly small blastemas can thus be the result of specific defects in pattern formation rather than non-specific results of the blastema being smaller than normal (Figure 5P). The few genes for which RNAi allowed regeneration of a medium-sized blastema with severely disrupted differentiation include candidate specific factors (e.g., tubedown-100 transcription factor, Figure 5D, and a TIMM50 phosphatase). Our data suggests it should be possible to readily identify specific blastema patterning and differentiation defects such as those illustrated in Figure 5C–N.
Animals lacking a visible phenotype from the RNAi of 677 out of the total 1065 genes in the original RNAi screen were also labeled with antibodies. 13 genes associated with cellular phenotypes following RNAi were identified in this manner (Tables S1, S3). New phenotypes were therefore rare; i.e., about 1–2 % of genes that did not confer a visible defect had a cellular defect. These findings indicate that it should be possible to design a multitude of future screens, coupling our RNAi screening methodology to high-throughput whole-mount immunohistology, to identify genes controlling the specific cellular events of regeneration in planarians.
V. Morphallaxis: genes needed for changes in pre-existing tissue
In addition to the production of new tissues within blastemas, a major element of planarian regeneration involves changes in pre-existing tissues. For example, some organs such as the pharynx form within old tissues, and old tissues can change in length and width. These changes in the proportion and distribution of organs in the differentiated tissues of regenerating planarians was first recognized by T. H. Morgan in 1898 (Morgan, 1898), and he termed the process of such change morphallaxis. The cellular and molecular mechanisms underlying morphallaxis are nearly completely unknown. One of our screen assays allowed for an assessment of the production of new tissues in old tissues: tail fragments lack a pharynx (Figure 1B) and produce a new pharynx in pre-existing tissues. Most genes that were needed for blastema formation were needed for pharynx formation indicating that similar cellular events are involved in both processes (Tables 2, S1). However, RNAi of 11 genes, such as a nuclear migration nudC-like gene (NBE.1.11B), resulted in weak defects in blastema formation but perturbed pharynx regeneration (Table 2, Figure 3B).
VI. Homeostasis: The function and replacement of differentiated cells
Regenerated animals maintain differentiated tissues with the constant replacement of aged cells by neoblast progeny (Figure 3A). The functions in homeostasis of 143 genes associated with defects in the RNAi screen were assessed (see Experimental procedures). RNAi of 108 of 143 genes conferred robust defects that define the major planarian homeostasis phenotypes (Table S4, Figure 6B–D). By observing irradiated animals, i.e., animals lacking neoblasts, we defined a neoblast-defective homeostasis phenotype. Irradiated animals displayed tissue regression within eight days (Figure 6A), curling within 15 days (Figure 6A), and lysis thereafter. The tissue anterior to the photoreceptors, where regression is typically observed, is normally incapable of regeneration (Morgan, 1898) and is constantly replaced by neoblast progeny (Newmark and Sánchez Alvarado, 2000).
RNAi of many genes caused defects in intact animals similar to those observed in irradiated animals; these genes may be needed for neoblast function in homeostasis (Table S4, Figure 6B, C). Tissue regression and curling of intact animals are attributes that tend to appear together in RNAi experiments (48 out of 63 cases) as well as with lysis (40/48), suggesting a common underlying defect (Table S4, Figure 6F). Genes that cause regression and curling following RNAi in intact animals tend to be needed for regeneration (40 of 48 genes, BLST≤0.5, P<0.0005) indicating these genes may be required for all neoblast functions (Figure 6F). Decrease of αH3P-labeled cells following amputation correlates with curling and regression defects in intact animals (Figure 6F). Of the 66 genes in this homeostasis study that were needed for regeneration (BLST(0/0.5), RNAi of 46 caused intact animals to display tissue regression and RNAi of 42 caused intact animals to curl, indicating about 2/3 of the genes that are needed for regeneration may be needed for neoblast function in homeostasis. Among the 63 genes that caused curling and/or regression in intact animals following RNAi are 33 genes predicted to encode proteins involved in translation or metabolism, 2 in vesicle trafficking, 3 in cell cycle, 4 chromatin factors, 1 cytoskeletal protein, 4 RNA-binding factors, 1 similar to a disease protein, 3 in protein folding, 1 in protein transport, 2 in RNA splicing, 3 signal transduction proteins, and 6 with unknown function (Table S4). This gene set provides a profile of gene functions likely required for the homeostatic functions of neoblasts.
RNAi of some genes caused robust, inviable homeostasis defects but did not block blastema formation or affect neoblast mitoses following amputation (Figure 6E). Therefore, cellular events required for homeostasis need not be required for regeneration or always involve neoblast proliferation. A major category of homeostasis phenotypes involved the formation of a variety of types of lesions (Figure 6D). Genes for which RNAi caused lesions in intact animals did not have strong tendencies to be required for regeneration or neoblast proliferation (Figure 6G). Since irradiation of planarians does not result in lesions (Figure 6A), lesions may arise due to defects in differentiated cells. By contrast, RNAi of some genes caused lesions and did block regeneration. Of the 18 genes for which RNAi blocked regeneration but did not cause regression or curling in intact animals, RNAi of 16 caused lesions to develop in the intact animals (Table S4). There may therefore be two main categories of genes, albeit not mutually exclusive, needed for regeneration and viability in adult animals: one that regulates the functions of neoblasts and another that is needed for differentiated cells.
VII. Behavior of regenerated animals
After completing regeneration, new animals acquire the ability to respond to their environment with normal behaviors (Figure 3A). Planarians locomote via the beating of ventral cilia, can move their body to turn and respond to objects by use of their muscular system, and control their behavior with bicephalic ganglia, two ventral nerve tracts, a variety of sensory systems, and a submuscular nervous plexus (Hyman, 1951). RNAi of 44 genes conferred uncoordinated locomotion (36 robustly), with RNAi of two additional genes giving uncoordinated flipping (flp) (Tables 2, S1, Figure 3B). Following the RNAi of some genes, such as a proprotein convertase-encoding gene (HE.2.02B), which is known to regulate neuropeptides (Bergeron et al., 2000), animals became completely paralyzed (Table 2). Five genes conferred blistering (BLI) and bloating (BLT) as well as lack of coordination following RNAi, including those predicted to encode cytoskeletal proteins such as tubulins (HE.1.01H, HE.1.03G) and rootletin (HE.1.02E), a component of cilia (Yang et al., 2002) (Table 2, Figure 2G). Since ciliated cells are needed for both locomotion (ventral epidermis) and the excretory system (flame cells of the protonephridia), these genes may play a role in controlling the function of cilia (Hyman, 1951). RNAi of four genes caused animals to become uncoordinated and to adopt abnormal body postures, such as becoming flattened (flattened) following RNAi of a secretory granule neuroendocrine protein-encoding gene (HE.4.05F), or becoming narrower in the middle than at the ends (hourglass) following RNAi of a tropomyosin-encoding gene (NBE.1.12G) (Table 2, Figure 2H). RNAi of one gene, predicted to encode a protein similar to a hepatocellular-associated antigen (NBE.8.11C), caused animals to stick to a surface and stretch their bodies out to a very thin morphology (stick&stretch) (Table 2, Figure 2H). RNAi of one gene, predicted to encode an outer dense fiber of sperm tails-like protein (NBE.8.03E), caused animals to move sideways to the right (sidewinder) (Table 2). Other genes associated with abnormal behavior are predicted to encode proteins including G-protein factors, transcription factors, and 12 novel proteins (Tables 2, S1). These results assign behavioral functions to an assortment of genes and identify functions for previously uncharacterized genes. Model organism studies of animal behavior have increasingly become a powerful strategy for understanding how specific genes control neural functioning and circuitry development (Hobert, 2003). Studies of the genetic control of behavior in varied organisms can begin to address how proteins with similar biochemical functions are utilized to control the development of diverse nervous systems and behaviors.
Discussion
Planarians are a powerful molecular genetic system for studies of metazoan biology
Planarians can regenerate from a large array of fragment types (Morgan, 1898; Randolph, 1897). As such, planarians offer a robust setting to examine classic problems of regeneration (Reddien and Sánchez Alvarado, 2004). For example: how does an animal know what is missing? How does an animal regulate the extent of what is replaced? How does an animal regulate the scale and proportion of newly regenerated tissues? How do tissues that normally develop in an embryonic context now develop in the context of neighboring fully formed tissues? How are new tissues integrated functionally with old ones?
In humans, candidate stem cells function to replace cells in a number of tissues during adult homeostasis and following wounding, including the skin (Blanpain et al., 2004), intestine (Spradling et al., 2001), the hematopoietic system (Weissman et al., 2001), the nervous system (Uchida et al., 2000), the heart (Beltrami et al., 2003), and muscle (Zammit et al., 2004). In most cases the population dynamics of such candidate stem cells and their functions following wounding still requires careful elucidation. How stem cells are regulated in vivo to replace missing cells is fundamental to human health, yet difficult to study. Ideally, it would be possible to bring the power of genetic analyses in model systems to bear on the functions of stem cells in tissue replacement. The important roles neoblasts play in regulating regeneration and adult physiology make planarians well suited for in vivo investigation of the genetic control of stem cell function. However, extensive genetic studies of planarians have been previously impractical. Here we identified RNAi-induced phenotypes from 240 genes (greater than 20% of all genes tested), establishing the utility and feasibility of applying large-scale gene function studies to planarian regeneration and homeostasis.
A diversity of planarian phenotypes have been identified
Our screen in the planarian S. mediterranea involved 1,065 genes and 53,400 amputations. The defects associated with the RNAi of 240 genes define the major planarian regeneration and homeostasis phenotypic categories. Since 85% of these genes have homology to genes found in other organisms—such as 38 that are similar to human disease genes—planarian phenotypes stand to ascribe function for many genes in conserved metazoan biology.
Amputated planarians undergo a number of processes to generate a fully functional new animal (Figure 3A): wounds heal, neoblasts proliferate, and neoblast progeny differentiate into new tissues and organ systems within the blastema. Additionally, preexisting tissues change to restore the complete complement of organ systems in proper proportions. The regenerated animal maintains the form and function of differentiated tissues during homeostasis and interprets its environment with appropriate behavioral responses. We have identified genes that are candidates to be needed for processes occurring in each of these phases (Figure 3B). These genes are associated with numerous striking and diverse RNAi-induced phenotypes, involving, for example, failed regeneration, paralysis, sideways movement, lesions, lysis, growths, asymmetry, development of extra photoreceptors, abnormal posture, defective caudal blastema formation, and pigment spots. A searchable and complete listing of all data can be found in Table S5.
Many genes are needed for regeneration in planarians
Not surprisingly, considering regeneration involves cell proliferation, migration, pattern formation, and differentiation, perturbation of a large number of genes can disrupt blastema formation. How can we identify genes controlling specific aspects of planarian blastema formation? Our experiments allowed for the clustering of genes with similar dsRNA-induced phenotypes into candidate functional categories.
What did we learn from functional categorizations? We identified a novel gene, HE.3.04D, that appears to be involved in wound healing (Figure 3B). We identified multiple genes with functions largely restricted to blastema formation and not homeostasis. These genes are predicted to encode proteins including several novel and signaling proteins and may primarily be involved in regeneration initiation or some specific aspect of blastema formation (Figure 3B). For example, the RNAi of HE.3.03B SMAD4 completely blocked blastema formation following amputation but had no effect on neoblast function for homeostasis. Since SMAD4 proteins are known regulators of TGF-β signaling (ten Dijke and Hill, 2004), a TGF-β signaling pathway may be needed for blastema initiation in planarians.
We identified other genes that were likely needed for the function of neoblasts in regeneration. These genes have RNAi phenotypes resembling irradiated animals lacking neoblasts; i.e., inability to regenerate, curling, and lysis. Many genes associated with these RNAi-induced phenotype attributes, not surprisingly, are predicted to control basic cell functions (Figure 3B). Others, however, appear to be more specific and encode, for example, an argonaute-like protein, other RNA-binding proteins, signal transduction proteins such as a phosphatidyl inositol transfer protein, chromatin regulators, and counterparts of two human disease genes. These genes may be important for the function of stem cells in all animals. RNAi of some genes caused a block in regeneration, curling, and lysis and also caused low numbers of neoblast mitoses, indicating they probably are required for basal neoblast function; i.e., maintenance and ability to divide. The RNAi of other genes in this category did not grossly affect neoblast mitoses indicating they may be required for neoblast progeny but not needed for neoblast maintenance or capacity to proliferate (Figure 3B). Such genes are predicted to encode proteins including a DEAD box RNA-binding protein, a striatin-like protein (WD-repeat containing (Castets et al., 2000), and a spastic paraplegia-like protein.
The RNAi phenotypes for some genes needed for regeneration did not suggest a function in regulating neoblasts (Figure 3B). We suggest that these genes are not needed for the function of neoblasts, but rather, for the function of differentiated cells. RNAi of genes in this category, such as a tubedown-100 transcriptional regulator-encoding gene (Willis et al., 2002), did not cause curling or affect neoblast mitoses but did perturb regeneration and cause other tissue homeostasis defects such as lesion formation (Figure 3B). All genes critical for homeostasis were not needed for regeneration or neoblast proliferation, however, suggesting homeostasis involves both neoblast control of cell turnover as well as the regulated patterning and functioning of differentiated tissues (Figure 3B). This hypothesis is supported by the fact that adult planarians are constantly regulating the size and scale of their various organ systems (Oviedo et al., 2003) and by the observation that some homeostasis defects involved the formation of lesions in the shape of underlying organs (Figure 6D).
Our categorization of gene function in planarians has established a strategy for understanding how genes control regeneration and its attendant stem cell functions. Further characterizations of the genes and phenotypes identified in this manuscript will help refine how individual genes within phenotype categories function to regulate regeneration.
Conclusion
The RNAi screen reported here demonstrates the feasibility of utilizing RNAi to perform large-scale functional analyses of genes in non-standard genetic organisms, requiring primarily a characterized cDNA collection and appropriate animal culture and dsRNA delivery methods. Such studies are of major importance for the study of the evolution of genes and their functions, and for the exploration of understudied, conserved biological processes. Together, our results establish S. mediterranea as an effective organism for the in vivo study of genes involved in disease, stem cells, homeostasis, and regeneration.
Experimental Procedures
RNAi construction library
pDONRdT7 was generated from a PCR fragment of L4440 (Timmons et al., 2001) containing two T7 promoter sequences flanking the L4440 multiple cloning site, two class I T7 terminators, and StuI and AflII restriction sites. The fragment was cloned into pDONR221 (Invitrogen) at the AflII/EcoRV sites. An ApaI/EcoRV fragment from pDONR221 was then cloned into the ApaI/SmaI sites on the resultant plasmid. To generate RNAi library clones, cDNAs within a pBluescript vector from neoblast-enriched and head libraries (Sánchez Alvarado et al., 2002) were PCR amplified using primers containing attB recombination sequences. Products were individually cloned into pDONRdT7 using a BP reaction (Invitrogen) to create RNAi entry clones (Figure 1A). The clones were transformed into E. coli strain HT115 (Timmons et al., 2001). Identity of clones associated with RNAi phenotypes were confirmed by sequencing. Clones that do not have an “HE” or “NBE” name are from a pilot screen. HB.14.06D is from a head blastema library. Sequence of all genes associated with RNAi phenotypes are accessible at NCBI, accession #xx. Visit http://planaria.neuro.utah.edu/ for further information.
RNAi
Overnight (ON) cultures in 2×YT with Kanamycin and Tetracycline were diluted 1:10 in fresh media, grown to OD 0.4 at 37°C, and induced with 100mM IPTG for 2 hours (h). For 10 animals, 2.5 mL bacteria were collected, resuspended in 25 µL 1:1 homogenized liver : water, mixed with 9.4 µL 2% ultra-low gelling temperature agarose and 0.7 µL red food coloring, and allowed to solidify on ice in ~10 µL spots. Room temperature (RT) food was fed to planarians. After 4 days (d), animals were fed RNAi food again, and the heads and the tails removed 3.5 h later. After 9d regeneration, animals were fed and amputated again (Figure 1B). To assess tissue homeostasis, four feedings were performed. Some pilot screen genes were inhibited by injecting dsRNA 3×32nL, 3 times before regeneration and once after. Phenotypes were considered real if the majority displayed the defect, or if 1/3 displayed a defect never observed in the control. Asexual clonal CIW4 line of S. mediterranea was used and maintained as described (Newmark and Sánchez Alvarado, 2000).
Antibody labeling
Animals were killed and fixed as described (Sánchez Alvarado and Newmark, 1999). Following rehydration animals were blocked for 6 h at RT in PBT×B (PBT×+0.25% BSA) or PBT×BH (PBT×B+10% horse serum). Animals were maintained at RT, rocking and incubated ON with 1:5000 α-H3P (kind gift of Dr. C. A. Mizzen), 1:5000 VC-1 (kind gift of Dr. K. Agata), and/or 1:133 α-synaptotagmin (kind gift of Dr. K. Agata). Animals were rinsed 5 min in PBT×B, then 1× per h, 6×, and labeled ON in 1:400 goat α-mouse Alexa488 or in 1:100 goat α-rabbit-HRP (Molecular Probes). Animals were washed as before. Those labelled with α-mouse-488 were mounted in Vectashield (Vector). Those labelled with α-rabbit-HRP were incubated with 1:100 tyramide-Alexa568 in amplification buffer (Molecular Probes) for 1 h, followed by 5×, 5 min rinses in PBT×B, then 4× 30min. rinses in PBT×B. Animals were stored ON at 4°C then rinsed 6×, 1 h each at RT and mounted in Vectashield.
Homeostasis and 24h αH3P
We selected 143 genes for which inhibition caused a range of blastema-size and other phenotypes (Table S4) and inhibited them in 20 animals each. 8 animals were left intact, fed 5× over 4 weeks, and observed 3–4 ×/week for 10 weeks to assess homeostasis. 12 animals were amputated as per Figure 1B. Of these, 6 were fixed at 16 or 24h following amputation and labeled with αH3P; the rest were observed as an RNAi effectivity control (Figure 1D). Numbers of dividing cells were compared to those of control RNAi (C. elegans unc-22), amputated animals (see Figure 4 legend for details).
Acknowledgments
Adam Bermange and Kenneth Murfitt contributed equally to this work. We thank Sofia Robb for database and homology assistance. We thank Arash Bashirullah, Jason Pellettieri, Alessandro Rossi, and Carl Thummel for comments. We thank Néstor Oviedo and all other members of the Sánchez lab for discussions and support. We thank P. Newmark for discussions and help in isolating the cells used for the neoblast-enriched cDNA library. We thank Dr. Kiyo Agata for generous sharing of antibodies. P.W.R. is a fellow of the Helen Hay Whitney Foundation. This work was supported by NIH NIGMS RO-1 GM57260 to A.S.A.
References
- Adoutte A, Balavoine G, Lartillot N, Lespinet O, Prud'homme B, de Rosa R. The new animal phylogeny: reliability and implications. Proc Natl Acad Sci USA. 2000;97:4453–4456. doi: 10.1073/pnas.97.9.4453. [DOI] [PMC free article] [PubMed] [Google Scholar]
- Bardeen CR, Baetjer FH. The inhibitive action of the Roentgen rays on regeneration in planarians. J Exp Zool. 1904;1:191–195. [Google Scholar]
- Beltrami AP, Barlucchi L, Torella D, Baker M, Limana F, Chimenti S, Kasahara H, Rota M, Musso E, Urbanek K, et al. Adult cardiac stem cells are multipotent and support myocardial regeneration. Cell. 2003;114:763–776. doi: 10.1016/s0092-8674(03)00687-1. [DOI] [PubMed] [Google Scholar]
- Bennett V, Baines AJ. Spectrin and ankyrin-based pathways: metazoan inventions for integrating cells into tissues. Physiol Rev. 2001;81:1353–1392. doi: 10.1152/physrev.2001.81.3.1353. [DOI] [PubMed] [Google Scholar]
- Bergeron F, Leduc R, Day R. Subtilase-like pro-protein convertases: from molecular specificity to therapeutic applications. J Mol Endocrinol. 2000;24:1–22. doi: 10.1677/jme.0.0240001. [DOI] [PubMed] [Google Scholar]
- Blanpain C, Lowry WE, Geoghegan A, Polak L, Fuchs E. Self-renewal, multipotency, and the existence of two cell populations within an epithelial stem cell niche. Cell. 2004;118:635–648. doi: 10.1016/j.cell.2004.08.012. [DOI] [PubMed] [Google Scholar]
- Brenner S. The genetics of Caenorhabditis elegans. Genetics. 1974;77:71–94. doi: 10.1093/genetics/77.1.71. [DOI] [PMC free article] [PubMed] [Google Scholar]
- Carpenter K, Morita M, Best J. Ultrastructure of the photoreceptor of the planarian Dugesia dorotocephala I. Normal eye. Cell Tissue Res. 1974;148:143–158. doi: 10.1007/BF00224579. [DOI] [PubMed] [Google Scholar]
- Casari G, De Fusco M, Ciarmatori S, Zeviani M, Mora M, Fernandez P, De Michele G, Filla A, Cocozza S, Marconi R, et al. Spastic paraplegia and OXPHOS impairment caused by mutations in paraplegin, a nuclear-encoded mitochondrial metalloprotease. Cell. 1998;93:973–983. doi: 10.1016/s0092-8674(00)81203-9. [DOI] [PubMed] [Google Scholar]
- Castets F, Rakitina T, Gaillard S, Moqrich A, Mattei MG, Monneron A. Zinedin, SG2NA, and striatin are calmodulin-binding, WD repeat proteins principally expressed in the brain. J Biol Chem. 2000;275:19970–19977. doi: 10.1074/jbc.M909782199. [DOI] [PubMed] [Google Scholar]
- De Robertis EM, Kuroda H. Dorsal-ventral patterning and neural induction in Xenopus embryos. Annu Rev Cell Dev Biol. 2004;20:285–308. doi: 10.1146/annurev.cellbio.20.011403.154124. [DOI] [PMC free article] [PubMed] [Google Scholar]
- Driever W, Solnica-Krezel L, Schier AF, Neuhauss SC, Malicki J, Stemple DL, Stainier DY, Zwartkruis F, Abdelilah S, Rangini Z, et al. A genetic screen for mutations affecting embryogenesis in zebrafish. Development. 1996;123:37–46. doi: 10.1242/dev.123.1.37. [DOI] [PubMed] [Google Scholar]
- Fire A, Xu S, Montgomery MK, Kostas SA, Driver SE, Mello CC. Potent and specific genetic interference by double-standed RNA in Caenorhabditis elegans. Nature. 1998;391:806–811. doi: 10.1038/35888. [DOI] [PubMed] [Google Scholar]
- Fraser AG, Kamath RS, Zipperlen P, Martinez-Campos M, Sohrmann M, Ahringer J. Functional genomic analysis of C. elegans chromosome I by systematic RNA interference. Nature. 2000;408:325–330. doi: 10.1038/35042517. [DOI] [PubMed] [Google Scholar]
- Gonczy P, Echeverri C, Oegema K, Coulson A, Jones SJ, Copley RR, Duperon J, Oegema J, Brehm M, Cassin E, et al. Functional genomic analysis of cell division in C. elegans using RNAi of genes on chromosome III. Nature. 2000;408:331–336. doi: 10.1038/35042526. [DOI] [PubMed] [Google Scholar]
- Haffter P, Granato M, Brand M, Mullins MC, Hammerschmidt M, Kane DA, Odenthal J, van Eeden FJ, Jiang YJ, Heisenberg CP, et al. The identification of genes with unique and essential functions in the development of the zebrafish, Danio rerio. Development. 1996;123:1–36. doi: 10.1242/dev.123.1.1. [DOI] [PubMed] [Google Scholar]
- Hendzel MJ, Wei Y, Mancini MA, Van Hooser A, Ranalli T, Brinkley BR, Bazett-Jones DP, Allis CD. Mitosis-specific phosphorylation of histone H3 initiates primarily within pericentromeric heterochromatin during G2 and spreads in an ordered fashion coincident with mitotic chromosome condensation. Chromosoma. 1997;106:348–360. doi: 10.1007/s004120050256. [DOI] [PubMed] [Google Scholar]
- Hobert O. Behavioral plasticity in C. elegans: paradigms, circuits, genes. J Neurobiol. 2003;54:203–223. doi: 10.1002/neu.10168. [DOI] [PubMed] [Google Scholar]
- Hyman LH. The Invertebrates: Platyhelminthes and Rhynchocoela The acoelomate bilateia. Vol. II New York: McGraw-Hill Book Company Inc.; 1951. [Google Scholar]
- Irish V, Lehmann R, Akam M. The Drosophila posterior-group gene nanos functions by repressing hunchback activity. Nature. 1989;338:646–648. doi: 10.1038/338646a0. [DOI] [PubMed] [Google Scholar]
- Morgan TH. Experimental studies of the regeneration of Planaria maculata. Arch Entw Mech Org. 1898;7:364–397. [Google Scholar]
- Newmark P, Sánchez Alvarado A. Bromodeoxyuridine specifically labels the regenerative stem cells of planarians. Dev Biol. 2000;220:142–153. doi: 10.1006/dbio.2000.9645. [DOI] [PubMed] [Google Scholar]
- Newmark PA, Reddien PW, Cebria F, Sánchez Alvarado A. Ingestion of bacterially expressed double-stranded RNA inhibits gene expression in planarians. Proc Natl Acad Sci. 2003;100:11861–11865. doi: 10.1073/pnas.1834205100. [DOI] [PMC free article] [PubMed] [Google Scholar]
- Nishiguchi KM, Sandberg MA, Kooijman AC, Martemyanov KA, Pott JW, Hagstrom SA, Arshavsky VY, Berson EL, Dryja TP. Defects in RGS9 or its anchor protein R9AP in patients with slow photoreceptor deactivation. Nature. 2004;427:75–78. doi: 10.1038/nature02170. [DOI] [PubMed] [Google Scholar]
- Nusslein-Volhard C, Wieschaus E. Mutations affecting segment number and polarity in Drosophila. Nature. 1980;287:795–801. doi: 10.1038/287795a0. [DOI] [PubMed] [Google Scholar]
- Oviedo NJ, Newmark PA, Sánchez Alvarado A. Allometric scaling and proportion regulation in the freshwater planarian Schmidtea mediterranea. Dev Dyn. 2003;226:326–333. doi: 10.1002/dvdy.10228. [DOI] [PubMed] [Google Scholar]
- Peters JM. The anaphase-promoting complex: proteolysis in mitosis and beyond. Mol Cell. 2002;9:931–943. doi: 10.1016/s1097-2765(02)00540-3. [DOI] [PubMed] [Google Scholar]
- Randolph H. Observations and experiments on regeneration in planarians. Arch Entw Mech Org. 1897;5:352–372. [Google Scholar]
- Reddien PW, Sánchez Alvarado A. Fundamentals of planarian regeneration. Ann Rev Cell Dev Bio. 2004;20:725–757. doi: 10.1146/annurev.cellbio.20.010403.095114. [DOI] [PubMed] [Google Scholar]
- Sakai F, Agata K, Orii H, Watanabe K. Organization and regeneration ability of spontaneous supernumerary eyes in planarians-eye regeneration field and pathway selection by optic nerves. Zool Sci. 2000;17:375–381. doi: 10.2108/jsz.17.375. [DOI] [PubMed] [Google Scholar]
- Sánchez Alvarado A, Newmark PA. Double-stranded RNA specifically disrupts gene expression during planarian regeneration. Proc Natl Acad Sci. 1999;96:5049–5054. doi: 10.1073/pnas.96.9.5049. [DOI] [PMC free article] [PubMed] [Google Scholar]
- Sánchez Alvarado A, Newmark PA, Robb SM, Juste R. The Schmidtea mediterranea database as a molecular resource for studying platyhelminthes, stem cells and regeneration. Development. 2002;129:5659–5665. doi: 10.1242/dev.00167. [DOI] [PubMed] [Google Scholar]
- Spradling A, Drummond-Barbosa D, Kai T. Stem cells find their niche. Nature. 2001;414:98–104. doi: 10.1038/35102160. [DOI] [PubMed] [Google Scholar]
- ten Dijke P, Hill CS. New insights into TGF-beta-Smad signalling. Trends Biochem Sci. 2004;29:265–273. doi: 10.1016/j.tibs.2004.03.008. [DOI] [PubMed] [Google Scholar]
- Timmons L, Court DL, Fire A. Ingestion of bacterially expressed dsRNAs can produce specific and potent genetic interference in Caenorhabditis elegans. Gene. 2001;263:103–112. doi: 10.1016/s0378-1119(00)00579-5. [DOI] [PubMed] [Google Scholar]
- Uchida N, Buck DW, He D, Reitsma MJ, Masek M, Phan TV, Tsukamoto AS, Gage FH, Weissman IL. Direct isolation of human central nervous system stem cells. Proc Natl Acad Sci U S A. 2000;97:14720–14725. doi: 10.1073/pnas.97.26.14720. [DOI] [PMC free article] [PubMed] [Google Scholar]
- Weaver AM, Young ME, Lee WL, Cooper JA. Integration of signals to the Arp2/3 complex. Curr Opin Cell Biol. 2003;15:23–30. doi: 10.1016/s0955-0674(02)00015-7. [DOI] [PubMed] [Google Scholar]
- Weissman IL. Stem cells: units of development, units of regeneration, and units in evolution. Cell. 2000;100:157–168. doi: 10.1016/s0092-8674(00)81692-x. [DOI] [PubMed] [Google Scholar]
- Weissman IL, Anderson DJ, Gage F. Stem and progenitor cells: origins, phenotypes, lineage commitments, and transdifferentiations. Annu Rev Cell Dev Biol. 2001;17:387–403. doi: 10.1146/annurev.cellbio.17.1.387. [DOI] [PubMed] [Google Scholar]
- Willis DM, Loewy AP, Charlton-Kachigian N, Shao JS, Ornitz DM, Towler DA. Regulation of osteocalcin gene expression by a novel Ku antigen transcription factor complex. J Biol Chem. 2002;277:37280–37291. doi: 10.1074/jbc.M206482200. [DOI] [PubMed] [Google Scholar]
- Yang J, Liu X, Yue G, Adamian M, Bulgakov O, Li T. Rootletin, a novel coiled-coil protein, is a structural component of the ciliary rootlet. J Cell Biol. 2002;159:431–440. doi: 10.1083/jcb.200207153. [DOI] [PMC free article] [PubMed] [Google Scholar]
- Zammit PS, Golding JP, Nagata Y, Hudon V, Partridge TA, Beauchamp JR. Muscle satellite cells adopt divergent fates: a mechanism for self-renewal? J Cell Biol. 2004;166:347–357. doi: 10.1083/jcb.200312007. [DOI] [PMC free article] [PubMed] [Google Scholar]