

Abstract
Intravascular photoacoustic (IVPA) imaging is based on the detection of laser-induced acoustic waves generated within the arterial tissue under pulsed laser irradiation. Generally, laser radiant energy levels are kept low (20 mJ/cm2) during photoacoustic imaging to conform to general standards for safe use of lasers on biological tissues. However, safety standards in intravascular photoacoustic imaging are not yet fully established. Consequently, monitoring spatio-temporal temperature changes associated with laser-tissue interaction is important to address thermal safety of IVPA imaging. In this study we utilize the IVUS based strain measurements to estimate the laser induced temperature increase. Temporal changes in temperature were estimated in a phantom modeling a vessel with an inclusion. A cross-correlation based time delay estimator was used to assess temperature induced strains produced by different laser radiant energies. The IVUS based remote measurements revealed temperature increases of 0.7±0.3°C, 2.9±0.2 °C and 5.0±0.2 °C, for the laser radiant energies of 30 mJ/cm2, 60 mJ/cm2 and 85 mJ/cm2 respectively. The technique was then used in imaging of ex vivo samples of a normal rabbit aorta. For arterial tissues, a temperature elevation of 1.1°C was observed for a laser fluence of 60 mJ/cm2 and lesser than 1°C for lower energy levels normally associated with IVPA imaging. Therefore, the developed ultrasound technique can be used to monitor temperature during IVPA imaging. Furthermore, the analysis based on the Arrhenius thermal damage model indicates no thermal injury in the arterial tissue; suggesting the safety of IVPA imaging
Keywords: Atherosclerosis, photoacoustic imaging, laser, vulnerable plaque, coronary artery, intravascular ultrasound, optoacoustic imaging, thermoacoustic imaging, temperature, Arrhenius thermal damage model
I. Introduction
Photoacoustic or optoacoustic effect (Bell 1880) is a result of an opto-thermal process where, under laser irradiation conditions of thermal and stress confinement, the absorption of light produces acoustic waves. The acoustic transients detected using an ultrasonic detector are used to form photoacoustic images depicting the spatial distribution of optical absorbers (Beard and Mills 1997; Emelianov et al. 2004; Oraevsky and Karabutov 2003; Wang et al. 2003). Photoacoustic imaging can be performed using an intravascular ultrasound (IVUS) imaging catheter and has the potential to image the composition and functional properties of the arterial wall (Sethuraman et al. 2005). The imaging technique was shown to be applicable for intraluminal imaging (Sethuraman et al. 2006). Further, the synergistic combination of intravascular photoacoustic (IVPA) imaging with IVUS is expected to play an important role in detecting and differentiating vulnerable atherosclerotic plaques (Sethuraman et al. 2006; Sethuraman et al. 2007). Indeed, the difference in the optical absorption coefficient between various components of the heterogeneous plaque (lipids, calcium, macrophages, blood, and collagen) could provide the contrast in IVPA imaging.
In photoacoustic imaging, the tissue is subjected to sub-ablation threshold laser pulses of short, 5-10 ns, time duration. A short laser pulse minimizes the conduction of heat and pressure away from the incident region. Furthermore, during photoacoustic imaging we maintain low energy fluence of optical irradiation to conform to laser safety standards for biological applications (ANSI 2000). However, the maximum permissible exposure for intravascular photoacoustic imaging is not yet established. Therefore, a need exists to remotely and accurately monitor the temperature dynamics following laser excitation and to investigate any possible clinical concerns regarding thermal safety of intravascular photoacoustic imaging.
The extent of thermal tissue damage depends on the characteristics of the laser irradiation including but not limited to the magnitude, duration and the spatial incidence of the optical energy. However, the amount of heat deposited depends to a large extent on the optical absorption and scattering properties of the tissue. Typically, light distribution can be modeled using the radiative transport equation, Monte Carlo method, the diffusion approximation or Beer's law which generally describe an exponential distribution of photons in the tissue (Anvari et al. 1994; Flock et al. 1989; Jacques and Wang 1995; Keijzer et al. 1989; Prahl 1995; Roider and Birngruber 1995; Sagi et al. 1992). Subsequent change in the temperature distribution over time can be explained by thermal diffusion of the absorbed energy and modeled using finite difference or finite element techniques (Roider and Birngruber 1995). The distribution of thermal energy and its spatio-temporal variation would be a major determinant of tissue damage. Several optical-thermal models for estimating the increase in temperature have been previously suggested and discussed (Welch 1984). A commonly used parameter for estimating the thermal damage is the thermal relaxation time - the time required for the peak temperature rise to decrease to 37% of the total rise (Choi and Welch 2001). Generally, if the laser pulse duration is substantially shorter than the thermal relaxation time (as is the case with photoacoustic imaging), thermal damage to the surrounding tissue structure is minimized. However, in certain cases high temperatures could cause localized damage even after the thermal relaxation time has elapsed.
Ultrasound has been used as a means to determine temperature changes in biological tissues. Several parameters have been investigated to utilize ultrasound for temperature estimation including measurement of change in speed of sound (Bowen et al. 1979; Nasoni and Bowen 1989; Rajagopalan et al. 1979), attenuation coefficient (Bush et al. 1993; Damianou et al. 1997; Ribault et al. 1998; Varghese et al. 2002), ultrasound echo-shift (Maass-Moreno and Damianou 1996; Seip et al. 1996; Shi et al. 2005b; Varghese et al. 2002; Zohdy et al. 2006) and backscatter energy (Straube and Arthur 1994). In this work, we utilize the ultrasound-based strain estimates of temperature change as a method to determine thermal effects during photoacoustic imaging. The increase in temperature of the sample results in a shift in the ultrasound echoes. The apparent shift in the echoes is caused by the change in speed of sound and thermal expansion of the material (Bamber and Hill 1979; Seip and Ebbini 1995; Simon et al. 1998; Sun and Ying 1999). However, for the relatively low (5-10 °C) temperature increases, the displacements produced by the thermal expansion in the tissue are negligible and the relative shift of the echo signals is determined primarily by the temperature changes in the speed of sound (Maass-Moreno and Damianou 1996; Seip and Ebbini 1995). In IVPA imaging, the pulsed laser excitation is expected to cause a very small increase in the temperature of the sample. The differential displacement or strain observed in the sample is a function of the speed of sound change associated with temperature, and the thermal change can be monitored using ultrasound. Indeed, using IVUS imaging, the temperature induced strain can be measured and related to the actual temperature increase.
Clinically, the successful implementation of IVPA imaging is depends on multiple factors (Sethuraman et al. 2006). One important criterion is the amount of laser fluence required to generate photoacoustic images with acceptable signal to noise ratio. Therefore, it is utmost important to control the laser energy and maximize the photoacoustic signal while maintaining safety standards. Although the radiant energy of the laser can be controlled externally, the temperature generated at the site of laser incidence is unknown. In this study we attempt to establish the safety of IVPA imaging on arterial tissues by measuring the temperature increase following laser incidence. During the detection of atherosclerosis, IVPA imaging is generally performed along with IVUS imaging to obtain the optical absorption map of the vessel with respect to the structural content of the arterial wall. Therefore the ultrasound based temperature estimation was performed using an IVUS imaging transducer. Initially, we conducted phantom studies to test the ability of the system to obtain temporal variation in laser induced temperature change. The temperature increase in photoacoustic imaging depends on the radiant energy incident on a sample. Therefore, the changes in laser-induced temperature over time were compared for different levels of laser energy fluence. Finally, we performed two dimensional spatio-temporal estimation of temperature increase on an excised sample of an arterial tissue.
II. Materials And Methods
A. Arterial vessel samples
The method of remotely estimating temperature using intravascular ultrasound was initially tested on vessel phantoms made out of polyvinyl alcohol. Several materials were investigated for the preparation of the phantoms. Polyvinyl alcohol (PVA) was chosen since PVA phantoms are resilient and can be stored for a long time (Hassan and Peppas 2000). Further, the ultrasonic (Surry et al. 2004), optical (Kharine et al. 2003), mechanical (Fromageau et al. 2003) and thermal (Sundararajan 1999) properties of polyvinyl alcohol are well characterized and the material is suitable for multi-modal imaging studies. Generally, the composite vascular phantoms in our studies contained an inclusion embedded into an otherwise homogeneous vessel wall. The inclusion was prepared by mixing 8% (by weight) PVA granules in hot water. To elevate the optical absorption needed for photoacoustic contrast, 0.08%, 30 μm diameter graphite flakes were added. The graphite flakes also act as acoustic scatterers in ultrasound imaging. The viscous solution was poured into a mold and subjected to 3-4 freeze-thaw cycles (each cycle consisted of freezing for 12 hours and thawing for 12 hours) to produce a 1 mm diameter cylindrical inclusion. The vessel wall was built using 8% PVA solution mixed with 15 μm diameter silica particles acting as optical and ultrasonic scatterers. This solution was subsequently poured into an 8 mm diameter cylindrical mold where a 2 mm diameter rod was placed in the center of the mold to create the lumen, and the solidified inclusion was embedded into the 3 mm thick vessel wall. The composite intravascular arterial phantom underwent 2-3 freeze-thaw cycles necessary to crosslink the background PVA solution. A photograph of the cylindrical phantom is shown in Fig. 1(a).
Figure 1.
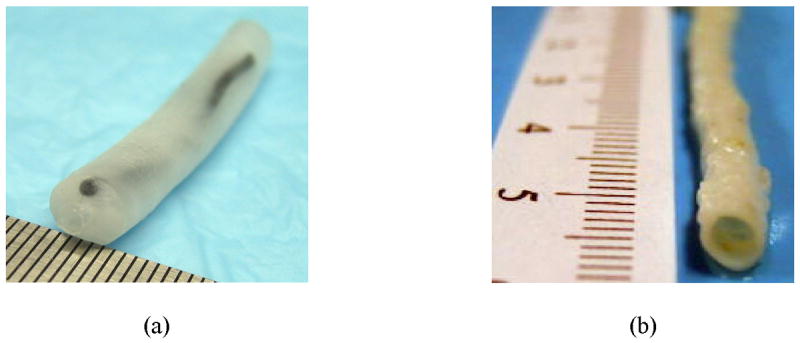
Samples used in the intravascular ultrasound-based temperature monitoring studies: (a) arterial tissue mimicking phantom, (b) sample of an excised rabbit artery.
In addition, remote temperature measurement studies following IVPA imaging were performed on excised samples of a rabbit artery. The arterial sample was obtained from a rabbit used in an on-going collaborative study approved by the Animal Welfare Committee at The University of Texas Health Science Center at Houston. The tissue samples from a healthy rabbit were stored in saline for 4 hours prior to the experiment. The size of the artery was approximately 5 mm in diameter (Fig. 1(b)).
B. Intravascular imaging system
The block diagram of the experimental setup for temperature estimation during intravascular photoacoustic (IVPA) imaging is illustrated in Fig. 2. The vessel phantom or arterial sample was immersed in a water tank for acoustic coupling. A Q-switched pulsed Nd:YAG laser operating at a second harmonic wavelength (λ=532 nm) delivered short laser pulses (up to 24 mJ per pulse) subsequently heating the sample and producing photoacoustic waves. An ultrasonic pulser/receiver was interfaced with the laser and IVUS catheter to receive the IVPA signals and perform IVUS pulse-echo imaging. Both the photoacoustic response and the ultrasound backscattered echoes were detected using a single element, high frequency (40 MHz) intravascular ultrasound imaging catheter (Boston Scientific Atlantis™ SR PLUS coronary imaging catheter) inserted in the lumen of the modeled vessel or arterial sample.
Figure 2.
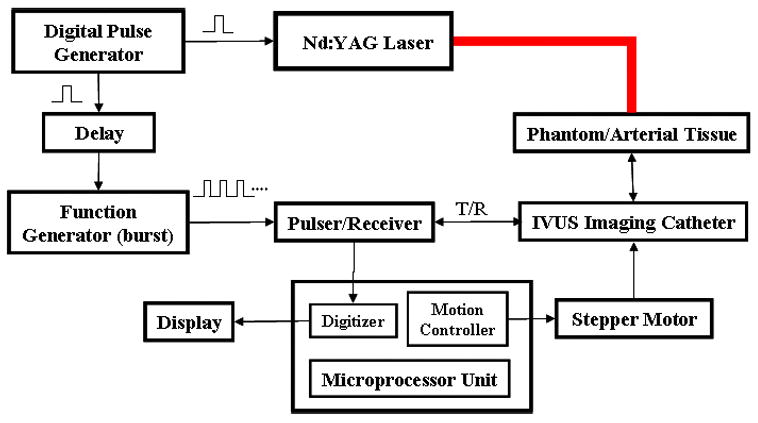
Block diagram of the experimental setup for remote, ultrasound-based estimation of temperature during intravascular photoacoustic (IVPA) imaging.
In addition to performing IVUS and IVPA imaging, a sequence of ultrasound signals (Fig. 3) was captured to obtain the time varying temperature distribution maps. The radiofrequency (RF) signals were acquired using a data acquisition system operating at 200 MHz sampling frequency. A digital pulse generator controlled the acquisition sequence to collect the IVUS and IVPA beams. The trigger signal from the pulse generator was utilized to control the firing of the laser pulse. The same trigger signal controlled a function generator after a user-specified delay. The function generator operating in the pulse-burst mode triggered the ultrasonic pulser and initiated multiple pulse-echo IVUS signals (reference and tracking beams) interrogating the same location of the sample. Indeed, the multiple IVUS A-lines are required for measuring the strain and, therefore, for monitoring the temporal changes in the temperature. Once the baseline IVUS signal (reference beam) was captured, the optical pulse for IVPA imaging was generated after 200 μs delay. Then, the sequence of IVUS pulse-echo A-lines (tracking beams) was initiated and captured. The tracking beams were delayed such that the photoacoustic response was obtained between the reference beam and first tracking beam. Therefore, a single acquisition (Fig. 3) consisted of the reference IVUS beam, IVPA response and tracking IVUS beams. Since the ultrasonic pulses were generated at 10 kHz pulse repetition frequency (PRF), a temporal resolution of 100 μs was achieved to allow monitoring of rapid changes in temperature.
Figure 3.
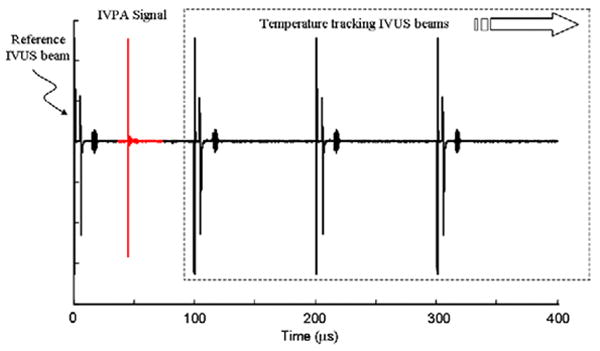
Data acquisition sequence illustrating the reference beam, photoacoustic response, and multiple tracking beams. The IVUS tracking beams were obtained at 10 kHz pulse repetition frequency.
C. Temperature monitoring in the arterial phantom
Laser produced depositions of heat were studied at different (30 mJ/cm2, 60 mJ/cm2, and 85 mJ/cm2) levels of energy fluence. Specifically, temporal behavior of temperature after a laser pulse was monitored along a single radial line intersecting the inclusion. The experiments were performed at room temperature. Prior to measurements, the transducer in the IVUS imaging catheter was aligned with the laser beam. Then, a single IVUS pulse-echo reference beam was captured. Subsequently, a single laser pulse irradiated the sample, and multiple IVUS beams were acquired immediately following the single laser pulse. Approximately 1000 beams were acquired covering a total time period of 100 ms. The experimental setup was undisturbed and sufficient time was allowed for the phantom to return to the room temperature before repeating the measurements at different energy levels. Thermally induced strain was measured using a 1-D cross-correlation based delay estimator (Lubinski et al. 1999). The spatial location producing the maximum strain was used to estimate the highest temperature attained after laser excitation. A high order polynomial fit was used for the calculation of the standard deviation of the measured temperature.
D. Spatio-temporal monitoring of temperature change in arterial tissue
To estimate the maximum temperature increase in the tissue subjected to laser incidence during IVUS/IVPA imaging, two dimensional temperature monitoring studies were performed using an excised sample of a rabbit artery. Furthermore, we analyzed the spatio-temporal behavior of temperature at the spot of laser incidence on the tissue to confirm thermal safety in IVPA imaging.
The ends of an excised arterial tissue sample were fastened to the rotational assembly and the IVUS imaging catheter inserted into the lumen. The 532 nm wavelength laser beam with 60 mJ/cm2 laser energy fluence and an approximate beam diameter of 4 mm irradiated a segment of the arterial wall from the outside. The reference IVUS beam, IVPA signal and 300 tracking IVUS beams were acquired at a single azimuthal (or angular) location in the tissue. The IVUS transducer was then rotated incrementally to obtain subsequent A-lines and 250 such acquisitions were performed to image the entire vessel. A time delay of 10 seconds was introduced between acquisitions so that there was no residual temperature when the subsequent measurements were performed.
The reference and tracking IVUS images were formed retrospectively by parsing and re-arranging the captured IVUS reference and tracking beams. In addition, an image of the photoacoustic response was generated from the captured data. For display purpose, the signals were bandpass filtered, envelope detected and scan converted to obtain the IVUS and IVPA images. To estimate the thermally induced displacements and strains in arterial tissue, a two-dimensional cross-correlation technique (Lubinski et al. 1999) was implemented in polar system of coordinates using complex basebanded IVUS frames. A hanning-weighted correlation kernel measuring 110 μm radially and 5° angularly was used to obtain the normalized cross-correlation coefficients. To improve the signal to noise ratio in the displacement estimates, a correlation hanning filter measuring 440 μm by 18° was applied. Derivatives of the displacement in the radial direction were calculated to obtain the thermal strain images. The strain artifacts occurring in the vicinity of the IVUS catheter due to transducer ring down were filtered using a median filter. Further, a third order polynomial fit was employed in the temporal data to reduce temporal variation of thermal strain. Typically, 300 temperature maps were obtained at 100 μs increments covering a total time period of 30 ms.
E. Temperature calibration and noise analysis
The shift in the IVUS echoes during IVPA imaging arises from the change in speed of sound and thermal expansion of the material. To quantify the relationship between the externally induced temperature change and the observed thermal induced strain in the PVA phantom and arterial tissue sample, the calibration experiments were needed. Others have previously demonstrated water-bath experiments to generate a calibration curve for liver, muscle, kidney and prostate tissues (Techavipoo et al. 2002; Varghese and Daniels 2004; Varghese et al. 2002). We performed similar calibration for polyvinyl alcohol and the arterial tissue. Although for small temperature increases the major contribution to the echo-shifts and apparent strain is the change in the speed of sound, our calibration experiments take into account both the change in speed of sound and negligibly small mechanical strain. The temperature-strain calibration was performed on 5 similar PVA phantoms and 3 sections of an aorta excised from a healthy rabbit. Further, the heating was repeated twice after allowing sufficient time for the temperature to return to the baseline room temperature. The calibration and temperature measurement experiments were performed on the same spatial location in the sample leading to an accurate estimate of relationship between temperature and thermal strain. A single pulse-echo IVUS signal was acquired at the baseline temperature (21°C) to obtain the reference beam. Then, the temperature of the water and, therefore, the sample was steadily increased by an influx of preheated water. During the heating process, the true temperature was measured using an external digital thermometer placed close to the IVUS imaging catheter in the lumen of the arterial sample. Simultaneously, IVUS pulse-echo measurements were performed at a constant beam sampling rate of 1 Hz to obtain the tracking beams. The IVUS beam number was synchronized with the elapsed time to match each beam with the associated temperature increase. Finally, cross-correlation based displacement estimation algorithm was used to track the displacements in the IVUS signals and to determine the temperature induced strain as a function of the temperature increase.
Figure 4 presents the temperature-strain dependence measured in the phantom with an optically absorbing inclusion (Fig. 4a) and an arterial tissue (Fig. 4b). Both the phantom and the arterial tissue are primarily water-based; therefore the speed of sound increases with the rise in temperature (up to 50°C). We observed thermal strains of −0.075 and −0.175 percent per degree centigrade in the phantom and the tissue respectively. For a few degrees in the increase in temperature from the baseline room temperature, the observed thermal strain has a near-linear increase. The rate of heating was constant and slow to make sure that the entire sample underwent a uniform increase in temperature.
Figure 4.
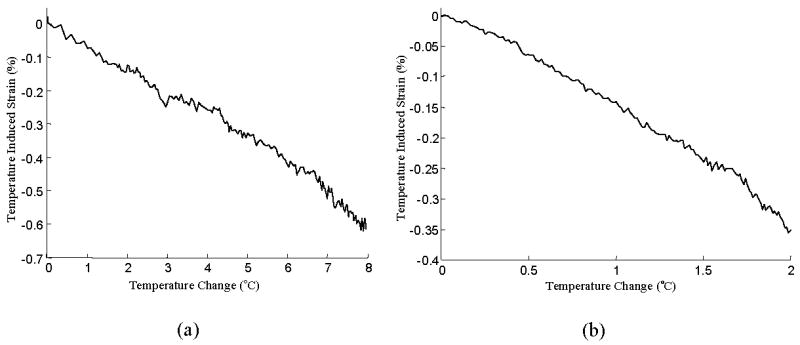
Calibration curves for (a) PVA phantom, and (b) arterial tissue. The temperature induced strain is almost linearly proportional to temperature.
Noise in the temperature monitoring system was analyzed by acquiring IVUS signals at a constant room temperature over a 10 second period of time. Additionally, we recorded the temperature using a high precision (traceable to NIST standards) digital thermometer with an accuracy of ±0.1°C. The analysis of strain variance suggests that the temperature monitoring was unreliable at low thermal strain values of approximately ±0.02% corresponding to temperature values of ±0.3°C.
III. Results
The results of the temperature monitoring in the phantom are presented in Fig. 5. The M-mode representation of the temporal variation in temperature monitored along a single radial line passing through the inclusion is shown in Fig. 5(a), 5(c) and 5(e) for laser radiant energies of 30 mJ/cm2, 60 mJ/cm2 and 85 mJ/cm2, respectively. The horizontal axis in these plots represents a total time of 100 ms and the vertical axis is the depth (4 mm) measured from the IVUS transducer element in the catheter. The M-mode images are presented such that the IVUS transducer element is at the top and the laser excitation site is at the bottom since the laser irradiation was applied from the external surface of the phantom. The inclusion of graphite particles is approximately centered at a distance 3.75 mm away from the catheter and is close to the outer edge of the vessel phantom. Clearly, the increase in temperature due to light absorption is predominant in the inclusion containing graphite particles, and there is a negligible increase in temperature outside of the inclusion. The maximum temperature and temperature dynamics following a single laser pulse are shown quantitatively in Figs. 5(b), 5(d) and 5(f). The temperature was measured in the small region within the inclusion located near the edge of the inclusion facing the laser irradiation. Given the geometry of the phantom, inclusion and laser beam, this region should correspond to the location of maximum temperature increase. The maximum temperatures measured after the laser pulse for radiant energies of 30 mJ/cm2, 60 mJ/cm2 and 85 mJ/cm2 are (0.7±0.3) °C, (2.9±0.2) °C and (5.0±0.2) °C, respectively. The temperature induced in the sample is expected to have a linear dependence on laser fluence. However, the observed deviation could be attributed to the approximate measurement of optical energy. Subsequently, an exponential decrease in temperature due to thermal diffusion was observed. The thermal relaxation time measured by the time required for the temperature to decrease exponentially to 1/e (or 37%) of the maximum value was approximately 5 ms for the above radiant energy conditions. Over time, the temperature does not stabilize at the baseline temperature due to the heat diffusion from the areas adjacent to the imaged A-line.
Figure 5.

Spatio-temporal IVUS estimation of temperature in arterial phantom following laser excitation. The M-mode image representation and the 1-D maximum temperature profile through the inclusion at laser energies (a-b) 30 mJ/cm2, (c-d) 60 mJ/cm2, (e-f) 85 mJ/cm2 monitored for 100 ms following laser excitation shows an exponential decay. The thermal relaxation time was estimated to be approximately 5 ms.
Spatio-temporal monitoring of temperature was performed in tissue sample. The B-Scan IVUS image of the normal rabbit artery before IVPA imaging, and therefore, before laser deposition of the heat is presented in Fig. 6(a). The laser beam irradiated a segment of the arterial wall located between 12 o'clock and 1 o'clock as shown pictorially in Fig. 6(a). The IVPA image in Fig. 6(b) further outlines the site of laser-tissue interaction. Indeed, the photoacoustic signals occur only in the region illuminated by the laser beam. The temperature distribution following laser irradiation is overlaid on the IVPA response in Fig. 6(c) and the spatial extent confirms that the localized temperature increase is limited to a very small region corresponding to the area of high intensity in the laser beam profile. The rest of the tissue exposed to laser irradiation produces photoacoustic signals with negligible increase in temperature.
Figure 6.
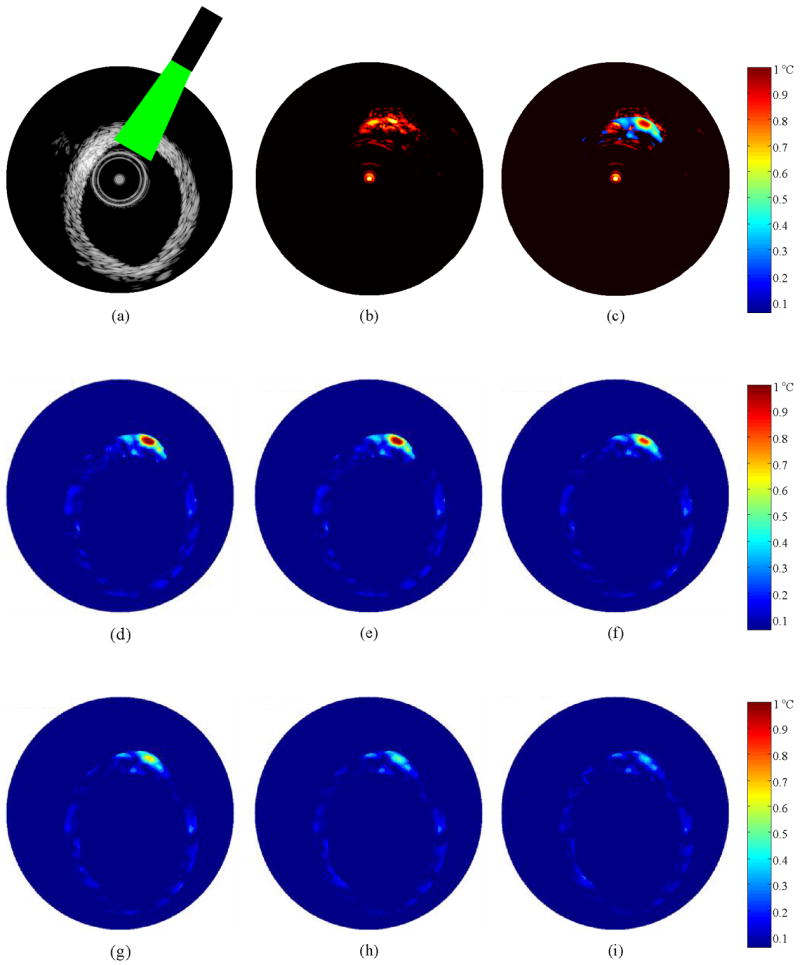
(a) IVUS B-Scan image of a normal arterial tissue with the laser illumination in the 12 o'clock to 1 o'clock region, (b) Image of the photoacoustic response from the region of laser incidence, (c) Image displaying the temperature increase immediately following the laser excitation overlaid on the photoacoustic response, (d-i) Temperature maps obtained from the arterial tissue at 0.1, 1, 5, 10, 15 and 20 ms following IVPA imaging. The maximum temperature observed at 0.1 ms after laser incidence is 1.1°C. The region of the arterial tissue was subject to a laser radiant exposure of 60 mJ/cm2.
The temperature maps showing the spatial distribution of temperature in the arterial tissue following IVPA imaging at a laser radiant energy of 60 mJ/cm2 are presented in Fig. 6(d-i). These images were acquired 0.1 ms, 1 ms, 5 ms, 10 ms, 15 ms and 20 ms after pulsed laser excitation. The temperature increase in the 12-1 o'clock region is consistent with the region containing photoacoustic signals in the IVPA image. As expected, the rest of the tissue does not show any increase in the temperature. The maximum temperature increase obtained 0.1 ms after the laser pulse was 1.1°C; this suggests negligible temperature rise associated with photoacoustic imaging. Subsequently, there is an exponential decrease of temperature due to thermal diffusion. Here the temperature reaches the baseline in approximately 20 ms following the laser pulse.
IV. Discussion
Temperature measurements were performed on sections of a normal artery. The magnitude of the temperature observed in the normal artery is a true worst-case scenario of the temperature increase that will be observed during IVPA imaging. Generally, vulnerable atherosclerotic plaques contain lipids that have lower optical absorption coefficient compared to the normal tissues (van Veen et al. 2005). Consequently, the presence of the plaque will only lower the maximum temperature in the wall of the arteries. Further, convection effects on the arterial wall due to the flow of luminal blood will mitigate the thermal effects caused by laser incidence (Diamantopoulos et al. 2003; Stefanadis et al. 2003). Hence, our measurements further suggest the thermal safety of in-vivo IVPA imaging.
Although the intensity of the short, 5 ns duration laser pulse incident on the arterial tissue during our photoacoustic imaging experiments was very high, the maximum temperature change was on the order of 1°C (Fig. 6). Indeed, the measurements were performed at a laser radiant energy of 60 mJ/cm2, which is much higher than the energies needed in IVPA imaging. Thermal measurements were also performed at energy fluence levels of less than 20 mJ/cm2. However, the temperature change was lower than 0.3°C and could not be reliably detected using our experimental system. These results again argue favorably that IVPA imaging is safe and the laser energy incident on the walls of the arterial tissue will not cause any thermal damage.
A potential source of damage to the tissues during laser-tissue interaction is the heat generation and subsequent diffusion of heat. Thermal damage, quantified using the Arrhenius damage coefficient analysis, depends on both the maximum temperature attained and the time of exposure (Henriques and Moritz 1947; Pearce and Thomsen 1995). The Arrhenius rate process equation describing unimolecular kinetics can be expressed as
| (1) |
where Ω is a dimensionless thermal damage coefficient, C is the concentration of molecules in the native state, t is the exposure time (s), T is the temperature (K), R is the universal gas constant (8.3134 J/mol/K), Ea is the activation energy needed for cell denaturation (J/mole) and A is the frequency factor which is a measure of molecular collisions (s-1). As follows from equation (1), the damage coefficient is a function of the ratio of the initial concentration of tissue components to the final concentration after the damage has occurred. A damage coefficient value of 1.0 is the threshold for tissue necrosis with 63% of the tissue undergoing denaturation. The damage analysis was performed for the arterial tissue with the initial temperature distribution taken from the temperature map (Fig. 6) at time t =0.1 ms, and the rate process coefficients for arterial tissue (A = 5.6·1063, Ea = 430 KJ/mol) obtained from the literature (Agah et al. 1994). The accumulated damage coefficient for the temperature distribution observed after approximately 5 thermal relaxation times (25 ms) is 6.4·10-11 which suggest that the temperature increase and the exposure time are small and do not cause any significant thermal change in the artery tissue following IVPA imaging.
A limitation of our technique is the inability to determine temperature change for low radiant energy exposures encountered in IVPA imaging. The strain based temperature estimation has a noise of ±0.3°C and, therefore, cannot be used as an accurate estimation of the temperature changes produced by the low laser energy fluence. A major factor contributing to the noise is the finite signal to noise ratio in the cross-correlation based tracking algorithm for measurements of low magnitude displacements and strains. However, the low energy fluence and therefore the low temperature increase are not expected to cause any thermal degradation of the aorta.
A potential concern is the accumulation of heat with the application of multiple laser pulses at a high repetition rate. Multiple laser pulses could lead to superposition effects of temperature. In such a scenario, thermal relaxation of the tissue could be several times longer than that for a single pulse (Choi and Welch 2001). A reason for this effect could be the presence of residual temperature when the next laser pulse is incident on the sample. However, this effect would not be too pronounced in the IVPA imaging of arterial tissue in vivo. First, the radiant energy could be limited to 20 mJ/cm2, which according to our experiments is sufficient to generate photoacoustic signals within physiologically acceptable levels of thermal buildup. Second, the blood flow in the arteries will increase the rate of thermal diffusion and cause the temperature to decrease faster (Stefanadis et al. 2003).
A calibration was required only to obtain the exact magnitude of temperature distribution. However, in the clinical setting, this technique can be applied to set a threshold of laser energy levels in the combined IVUS/IVPA imaging. Indeed, in this scenario, it would suffice to use an approximate calibration curve and no other additional calibration will be required. Although the present study was not focused at continuous and accurate monitoring of temperature in vivo, a potential intravascular application would be to differentiate plaque components based on thermal heterogeneity. Indeed, feasibility studies using thermal strain imaging have demonstrated the promise of the technique for intravascular plaque detection (Shi et al. 2005a; Shi et al. 2005b).
Another application of the developed ultrasound technique is the ability to obtain the optical properties of the tissue while performing combined IVUS/IVPA imaging of the arterial vessel. Indeed, the observed exponential distribution of the thermally induced apparent strain is a function of the optical energy deposition. Therefore, we can utilize the temporal thermal strain distribution to extract the absorption and effective scattering coefficients of tissue components.
V. Summary
The results of our study outline the ability of IVUS imaging to measure and monitor temperature during intravascular photoacoustic imaging. Remote temperature monitoring using an ultrasound based approach does not require any additional system and can be performed simultaneously during the IVUS/IVPA imaging of the arterial cross-section. The magnitude of temperature increase observed following laser excitation of arterial tissues indicates that IVPA imaging is thermally safe.
Acknowledgments
This work was partially supported by the American Heart Association under grant 0655033Y and National Institutes of Health under grants EB004963 and HL084076. Shriram Sethuraman was partially supported by The University of Texas Continuing Fellowship award. The authors would like to thank Boston Scientific, Inc. for their technical support and Mr. James Amirian for providing the excised samples of rabbit aorta used in the tissue experiments.
Footnotes
Publisher's Disclaimer: This is a PDF file of an unedited manuscript that has been accepted for publication. As a service to our customers we are providing this early version of the manuscript. The manuscript will undergo copyediting, typesetting, and review of the resulting proof before it is published in its final citable form. Please note that during the production process errors may be discovered which could affect the content, and all legal disclaimers that apply to the journal pertain.
References
- Agah R, Pearce JA, Welch AJ, Motamedi M. Rate process model for arterial tissue thermal damage: implications on vessel photocoagulation. Lasers Surg Med. 1994;15(2):176–84. doi: 10.1002/lsm.1900150205. [DOI] [PubMed] [Google Scholar]
- ANSI. American National Standard for Safe Use of Lasers, ANSI Z136.1. Laser Institute of America; Orlando: 2000. [Google Scholar]
- Anvari B, Rastegar S, Motamedi M. Modeling of intraluminal heating of biological tissue: implications for treatment of benign prostatic hyperplasia. IEEE Trans Biomed Eng. 1994;41(9):854–64. doi: 10.1109/10.312093. [DOI] [PubMed] [Google Scholar]
- Bamber JC, Hill CR. Ultrasound attenuation and propagation speed in mammalian tissues as a function of temperature. Ultrasound Med Biol. 1979;5(2):149–157. doi: 10.1016/0301-5629(79)90083-8. [DOI] [PubMed] [Google Scholar]
- Beard PC, Mills TN. Characterization of post mortem arterial tissue using time-resolved photoacoustic spectroscopy at 436, 461 and 532 nm. Phys Med Biol. 1997;42(1):177–98. doi: 10.1088/0031-9155/42/1/012. [DOI] [PubMed] [Google Scholar]
- Bell AG. art. XXXIV on the production and reproduction of sound by light. Am J Sci. 1880;20:305–324. [Google Scholar]
- Bowen T, Connor WG, Nasoni RL, Pifer AE, Sholes RR. Measurement of the temperature dependence of the velocity of ultrasound in soft tissues. Ultrasonic Tissue Characterization II. 1979;525:57–61. Spec Publ. [Google Scholar]
- Bush NL, Rivens I, ter Haar GR, Bamber JC. Acoustic properties of lesions generated with an ultrasound therapy system. Ultrasound Med Biol. 1993;19(9):789–801. doi: 10.1016/0301-5629(93)90095-6. [DOI] [PubMed] [Google Scholar]
- Choi B, Welch AJ. Analysis of thermal relaxation during laser irradiation of tissue. Lasers Surg Med. 2001;29(4):351–9. doi: 10.1002/lsm.1128. [DOI] [PubMed] [Google Scholar]
- Damianou CA, Sanghvi NT, Fry FJ, Maass-Moreno R. Dependence of ultrasonic attenuation and absorption in dog soft tissues on temperature and thermal dose. J Acoust Soc Am. 1997;102(1):628–34. doi: 10.1121/1.419737. [DOI] [PubMed] [Google Scholar]
- Diamantopoulos L, Liu X, De Scheerder I, Krams R, Li S, Van Cleemput J, Desmet W, Serruys PW. The effect of reduced blood-flow on the coronary wall temperature. Are significant lesions suitable for intravascular thermography? Eur Heart J. 2003;24(19):1788–95. doi: 10.1016/s0195-668x(03)00440-8. [DOI] [PubMed] [Google Scholar]
- Emelianov SY, Aglyamov SR, Shah J, Sethuraman S, Scott WG, Schmitt R, Motamedi M, Karpiouk A, Oraevsky A. Combined ultrasound, optoacoustic and elasticity imaging. Proceedings of the 2004 SPIE Photonics West Symposium: Photons Plus Ultrasound: Imaging and Sensing. 2004;5320:101–112. [Google Scholar]
- Flock ST, Patterson MS, Wilson BC, Wyman DR. Monte Carlo modeling of light propagation in highly scattering tissue--I: Model predictions and comparison with diffusion theory. IEEE Trans Biomed Eng. 1989;36(12):1162–8. doi: 10.1109/tbme.1989.1173624. [DOI] [PubMed] [Google Scholar]
- Fromageau J, Brusseau E, Vray D, Gimenez G, Delachartre P. Characterization of PVA cryogel for intravascular ultrasound elasticity imaging. IEEE Trans Ultrason Ferroelectr Freq Control. 2003;50(10):1318–24. doi: 10.1109/tuffc.2003.1244748. [DOI] [PubMed] [Google Scholar]
- Hassan CM, Peppas NA. Structure and applications of poly(vinyl alcohol) hydrogels produced by conventional crosslinking or by freezing/thawing methods. Advances in polymer science. 2000;153:37–65. [Google Scholar]
- Henriques FC, Moritz AR. Studies in thermal injury I. The conduction of heat to and through skin and the temperature attained therein. A theroretical and an experimental investigation. Am J Pathol. 1947;23:531–549. [PMC free article] [PubMed] [Google Scholar]
- Jacques SL, Wang LV. Monte Carlo modelling of light transport in tissues. In: Welch AJ, van Gemert MJ, editors. Optical-Thermal Response of Laser-Irradiated Tissue. Plenum; Newyork: 1995. pp. 73–100. [Google Scholar]
- Keijzer M, Jacques SL, Prahl SA, Welch AJ. Light distributions in artery tissue: Monte Carlo simulations for finite-diameter laser beams. Lasers Surg Med. 1989;9(2):148–54. doi: 10.1002/lsm.1900090210. [DOI] [PubMed] [Google Scholar]
- Kharine A, Manohar S, Seeton R, Kolkman RG, Bolt RA, Steenbergen W, de Mul FF. Poly(vinyl alcohol) gels for use as tissue phantoms in photoacoustic mammography. Phys Med Biol. 2003;48(3):357–70. doi: 10.1088/0031-9155/48/3/306. [DOI] [PubMed] [Google Scholar]
- Lubinski MA, Emelianov SY, O'Donnell M. Cross-correlation speckle tracking techniques for ultrasound elasticity imaging. IEEE Transactions on Ultrasonics, Ferroelectrics and Frequency Control. 1999;46:82–96. doi: 10.1109/58.741427. [DOI] [PubMed] [Google Scholar]
- Maass-Moreno R, Damianou CA. Noninvasive temperature estimation in tissue via ultrasound echo-shifts. Part 1. Analytical Model. J Acoust Soc Amer. 1996;100:2514–2521. doi: 10.1121/1.417359. [DOI] [PubMed] [Google Scholar]
- Nasoni RL, Bowen T. Ultrasound speed as a parameter for noninvasive thermometry. Noninvasive temperature measurement. 1989:95–107. [Google Scholar]
- Oraevsky AA, Karabutov AA. Optoacoustic Tomography. In: Vo-Dinh T, editor. Biomedical Photonics Handbook. CRC Press; 2003. pp. 34-1–34-34. [Google Scholar]
- Pearce J, Thomsen S. Rate process analysis of thermal damage. In: Welch AJ, van Gemert MJ, editors. Optical-thermal response of laser-irradiated tissue. Plenum Press; New York: 1995. [Google Scholar]
- Prahl SA. The diffusion approximation in three dimensions. In: Welch AJ, van Gemert MJ, editors. Optical-Thermal Response of Laser-Irradiated Tissue. Plenum; Newyork: 1995. pp. 207–231. [Google Scholar]
- Rajagopalan B, Greenleaf JF, Thomas PJ, Johnson SA, Bahn RC. Variation of acoustic speed with temperature in various excised human tissues studied by ultrasound computerized tomography. Ultrasonic tissue characterization II. 1979;525:227–233. Spec Publ. [Google Scholar]
- Ribault M, Chapelon JY, Cathignol D, Gelet A. Differential attenuation imaging for the characterization of high intensity focused ultrasound lesions. Ultrason Imaging. 1998;20(3):160–77. doi: 10.1177/016173469802000302. [DOI] [PubMed] [Google Scholar]
- Roider J, Birngruber B. Solution of the heat conduction equation. In: Welch AJ, van Gemert MJ, editors. Optical-Thermal Response of Laser-Irradiated Tissue. Plenum; New York: 1995. [Google Scholar]
- Sagi A, Shitzer A, Katzir A, Akselrod S. Heating of biological tissue by laser irradiation: Theoretical model. Opt Eng. 1992;31(7):1417–1424. [Google Scholar]
- Seip R, Ebbini ES. Noninvasive estimation of tissue temperature response to heating fields using diagnostic ultrasound. IEEE Trans Biomed Eng. 1995;42:828–839. doi: 10.1109/10.398644. [DOI] [PubMed] [Google Scholar]
- Seip R, VanBaren P, Cain C, Ebbini ES. Noninvasive spatio-temporal temperature change estimation using diagnostic ultrasound. IEEE Trans Ultrason Ferroelectr Freq Control. 1996;43:1068–1078. [Google Scholar]
- Sethuraman S, Aglyamov SR, Amirian JH, Smalling RW, Emelianov SY. Intravascular photoacoustic imaging to detect and differentiate atherosclerotic plaques. Proceedings of the 2005 IEEE International Ultrasonics Symposium. 2005:133–136. [Google Scholar]
- Sethuraman S, Aglyamov SR, Amirian JH, Smalling RW, Emelianov SY. Development of a combined intravascular ultrasound and photoacoustic imaging system. Proceedings of the 2006 SPIE Photonics West Symposium: Photons Plus Ultrasound: Imaging and Sensing. 2006;6086:F1–F10. [Google Scholar]
- Sethuraman S, Aglyamov SR, Amirian JH, Smalling RW, Emelianov SY. Intravascular photoacoustic imaging using an IVUS imaging catheter. IEEE Trans Ultrason Ferroelec Freq Control. 2007;54(5):978–986. doi: 10.1109/tuffc.2007.343. [DOI] [PubMed] [Google Scholar]
- Shi Y, deAna FJ, Chetcuti S, O'Donnell M. Motion artifact reduction for IVUS-based thermal strain imaging. IEEE Trans Ultrason Ferroelectr Freq Control. 2005a;52(8):1312–1319. doi: 10.1109/tuffc.2005.1509789. [DOI] [PubMed] [Google Scholar]
- Shi Y, Witte RS, O'Donnell M. Identification of vulnerable atherosclerotic plaque using IVUS-based thermal strain imaging. IEEE Trans Ultrason Ferroelectr Freq Control. 2005b;52(5):844–50. doi: 10.1109/tuffc.2005.1503971. [DOI] [PubMed] [Google Scholar]
- Simon C, vanBaren P, Ebbini ES. Two-dimensional temperature estimation using diagnostic ultrasound. IEEE Trans Ultrason Ferroelectr Freq Control. 1998;45(4):1088–1099. doi: 10.1109/58.710592. [DOI] [PubMed] [Google Scholar]
- Stefanadis C, Toutouzas K, Tsiamis E, Mitropoulos I, Tsioufis C, Kallikazaros I, Pitsavos C, Toutouzas P. Thermal heterogeneity in stable human coronary atherosclerotic plaques is underestimated in vivo: the ”cooling effect“ of blood flow. J Am Coll Cardiol. 2003;41(3):403–8. doi: 10.1016/s0735-1097(02)02817-6. [DOI] [PubMed] [Google Scholar]
- Straube WL, Arthur RM. Theoretical estimation of the temperature dependence of backscattered ultrasonic power for noninvasive thermometry. Ultrasound Med Biol. 1994;20(9):915–22. doi: 10.1016/0301-5629(94)90051-5. [DOI] [PubMed] [Google Scholar]
- Sun Z, Ying H. A multi-gate time-of-flight technique for estimation of temperature distribution in heated tissue: theory and computer simulation. Ultrasonics. 1999;37(2):107–22. doi: 10.1016/s0041-624x(98)00055-9. [DOI] [PubMed] [Google Scholar]
- Sundararajan PR. Poly(vinyl alcohol) In: Mark JE, editor. Polymer data handbook. Oxford University Press Inc.; New York: 1999. pp. 891–892. [Google Scholar]
- Surry KJ, Austin HJ, Fenster A, Peters TM. Poly(vinyl alcohol) cryogel phantoms for use in ultrasound and MR imaging. Phys Med Biol. 2004;49(24):5529–46. doi: 10.1088/0031-9155/49/24/009. [DOI] [PubMed] [Google Scholar]
- Techavipoo U, Varghese T, Zagzebski JA, Stiles T, Frank G. Temperature dependence of ultrasonic propagation speed and attenuation in canine tissue. Ultrason Imaging. 2002;24(4):246–60. doi: 10.1177/016173460202400404. [DOI] [PubMed] [Google Scholar]
- van Veen RLP, S HJCM, Pifferi A, Torricelli A, Cubeddu R. Determination of visible near-IR absorption coefficients of mammalian fat using time- and spatially resolved diffuse reflectance and transmission spectroscopy. Journal of Biomedical Optics. 2005;10(5):0540041–0540046. doi: 10.1117/1.2085149. [DOI] [PubMed] [Google Scholar]
- Varghese T, Daniels MJ. Real-time calibration of temperature estimates during radiofrequency ablation. Ultrason Imaging. 2004;26(3):185–200. doi: 10.1177/016173460402600305. [DOI] [PubMed] [Google Scholar]
- Varghese T, Zagzebski JA, Chen Q, Techavipoo U, Frank G, Johnson C, Wright A, Lee FT., Jr Ultrasound monitoring of temperature change during radiofrequency ablation: preliminary in-vivo results. Ultrasound Med Biol. 2002;28(3):321–9. doi: 10.1016/s0301-5629(01)00519-1. [DOI] [PubMed] [Google Scholar]
- Wang X, Pang Y, Ku G, Xie X, Stoica G, Wang LV. Noninvasive laser-induced photoacoustic tomography for structural and functional in vivo imaging of the brain. Nat Biotechnol. 2003;21(7):803–6. doi: 10.1038/nbt839. [DOI] [PubMed] [Google Scholar]
- Welch AJ. The thermal response of laser irradiated tissue. IEEE J Quantum Electronics. 1984;QE-20(12):1471–1481. [Google Scholar]
- Zohdy MJ, Tse C, Ye J, O'Donnell M. Acoustic estimation of thermal distribution in the vicinity of femtosecond laser-induced optical breakdown. IEEE Trans on Biomedical Engineering. 2006;53(11):2347–2355. doi: 10.1109/TBME.2006.877111. [DOI] [PubMed] [Google Scholar]