

Abstract
Background
Differential protein targeting by HIV-specific CD8 T cells is associated with disparate plasma viral loads; however, it is unclear if the quality of these responses differs depending upon the specificity of the targeted epitopes.
Methods
We examined HIV-specific CD8 T-cell responses in HIV-infected adolescents carrying either an HLA class I allele associated with a favorable prognosis (HLA-B*57) or an allele associated with usual disease progression (HLA-B*35 or HLA-B*53) using interferon-γ ELISpot and ICS assays.
Results
In an interferon-γ ELISpot assay, p24 was the dominant protein targeted by B*57 carriers while responses to Nef dominated in B*35 or B*53 positive carriers. This differential protein targeting did not change during 4 years of follow-up. In these chronically infected adolescents, there were no significant differences in the quality of the immunodominant T-cell responses between the B*57 and B*35/B*53 carriers as measured by peptide avidity, degranulation, and immune memory markers. There was a trend towards higher expression of interleukin-2 from B*57-KF11 restricted CD8 T cells although this difference was not significant. Nevertheless both B*57 and B*35/53-restricted responses were relatively potent as reflected by the propensity of CD8 T cells to escape in p24 and Nef, respectively.
Conclusions
Differential protein targeting rather than the quality of T-cell responses appears to be a major distinguishing feature of HIV-specific CD8 T cells induced in B*57 carriers. These data suggest that viral fitness costs associated with CD8 T-cell pressure is an important factor determining differences in the viral load among HIV-infected patients.
Keywords: adolescents, CD8 T-cells, Gag, HIV-1, HLA-Class I, Nef
Introduction
Although HIV-1 infection invariably results in progression to AIDS in the vast majority of patients, host genetic factors impact the relative rates of disease progression. Among HLA class I alleles, HLA-B*57 and B*27 have consistently been associated with slower rates of disease progression, while HLA-B*35 and B*53 have been associated with more rapid development of AIDS [1–6]. The absolute necessity of the HLA class I system for elicitation of CD8 T-cell responses combined with the importance of the latter responses in the control of HIV replication [7] strongly support the hypothesis that the quality of CD8 T-cell responses differ depending on the specificity of epitope targeting and/or HLA class I restriction.
The targeting of the Gag protein by CD8 T cells has been shown to correlate with favorable makers of disease progression [8–14]. More recent work has shown that the lower viral loads associated with HLA-B*57 and other favorable HLA class I carriers is due in part to targeting of the Gag protein [15]. Only a few studies have been able to demonstrate qualitative differences among CD8 T cells restricted by distinct HLA class I alleles even when the cytotoxic T lymphocytes (CTL) target identical epitopes [16]. HIV vaccination in seronegative vaccinees carrying HLA-B*57 or B*27 was found to have greater antigen specific CD8 T-cell responses when compared to those without such alleles [17]. In addition, Migueles and colleagues demonstrated that HIV-infected long-term nonprogressors (LTNP; mainly HLA-B*57 carriers) had HIV-specific CD8 T cells that were able to proliferate more efficiently compared with the usual progressors [18]. HIV-specific polyfunctional CD8 T cells were also shown to be associated with lower plasma viral loads and found to be independent of HLA-B*57 carriage [19].
We hypothesized that the relative lack of immune control in HLA-B*35/B*53 positive patients is due to targeting outside of the Gag protein by a functionally distinct phenotype of T cells when compared to HLA-B*57. Using multiple assays to analyze the quality of these immune responses in subjects selected from an adolescent cohort, we found that the quality of the epitope specific responses did not differ depending upon HLA class I restriction. Rather the preferential targeting of Gag versus Nef proteins in patients with HLA class I alleles associated with favorable and poor prognosis, respectively was the only discernable feature.
Materials and methods
Study subjects
T-cell responses to the entire HIV-1 expressed genome were measured in HIV-1 clade B infected adolescents from the REACH cohort of US Adolescent Medicine HIV-1/AIDS Research Network (AMHARN) [20]. Selected subjects from the REACH cohort with HLA class I alleles B*35 (n = 23), B*53 (n = 31) and B*57 (n = 15) were then enrolled and followed longitudinally for an additional 2 years in a new study (Adolescent Medicine Trials Network for HIV/AIDS Interventions that is ATN 026). For all 69 subjects who enrolled into ATN 026, peripheral blood mononuclear cells (PBMC) and clinical data including viral load, CD4 cell counts, and treatment history were obtained every 6 months. To evaluate the T-cell responses and analyze the sequence changes, PBMC from the REACH and ATN026 studies were utilized allowing for a longitudinal follow-up period of approximately 4 years. Eighteen patients (7 B*57, 5 B*35, and six B*53 carriers) were off antiretroviral therapy (ART) for at least two time points during this 4-year follow up with available PBMC for comprehensive interferon (INF)-γ ELISpot T-cell mapping. All subjects consented to participate in this study with Institutional Review Board approval obtained at each of the participating sites.
Quantitative immunophenotyping of CD4 T-cells and HIV-1 plasma RNA viral load were measured by standard assays as described previously [21]. HLA class I alleles were typed to two- or four-digit specificity by PCR amplification using sequence-specific primers (Pel-Freez Clinical Systems, Brown Deer, Wisconsin, USA) as described before [21].
Entropy
Entropy Year 2003 genome and by-protein alignments in the Los Alamos HIV Database (www.hiv.lanl.gov) were used to obtain a Shannon entropy score for each position in the protein alignment. Entropy is a measure of the amino-acid variability at a given position that takes into account both the number of possible amino acids allowed and their frequency [22]. In each patient, an entropy score of every positive T-cell response was calculated. The entropy score of a specific peptide was calculated as an average of entropy scores of each amino acid included in the peptide.
Peptides
HIV-1 peptides used in this study were obtained through the NIH AIDS Research and Reference Reagent Program, Division of AIDS, NIAID, NIH. The peptides used in this study were 15-mers overlapping by 11 encompassing Gag (#5107), Pol (#6208), Env (#6451), Nef (#5189) and Accessory proteins of HIV-1 (# 5138, 6444, 6445, 6446, 6447). Each peptide was used at was 2 μg/ml. All HLA-B*57 and B*35/B*53-restricted epitopes (9–11-mers) described in the Los Alamos database were synthesized (Polymx, Huntsville, Alabama, USA) and tested in an IFN-γ ELISpot assay.
IFN-γ ELISpot assay
An IFN-γ ELISpot assay was performed as described in prior studies [20,23]. In brief, Millipore plates (MAHAN# 4550) were coated overnight with anti-IFN-γ mAb (Mabtech #1DIK). The following day, the cells were plated at 1 × 10⁵ cells/well and incubated with peptide pools and optimized peptides for 20–24 h. For spot detection, biotinylated anti-IFN-γ (Mabtech #7B61) followed by streptavidin-AP and BCIP substrate (Southern Biotech #s 7100-04 and 3032-01 respectively) were used. Spots were counted using a CTL ‘Immunospot’ plate reader and expressed as SFC (spot forming cells)/106 PBMC. In this study, breadth of response is defined by the total number of peptides pools/peptides recognized. Magnitude is defined as the reactivity either to the sum total of all the peptides in a pool or to a single peptide.
HIV-1 sequencing
Genomic DNA was extracted from the PBMC of HIV-positive patients using QIAamp DNA Blood mini kit (Qiagen, Valencia, California, USA). HIV-1 genomic sequence was amplified using FAST Start High Fidelity PCR System (Roche, Nutley, New Jersey, USA) kit. The Outer PCR primers used in this study to amplify full-length Nef sequences (8329–9548 on pNL4.3) were: Nef-For: 5′–AATAGAGTTAGGCAGGGATAC–3′ and Nef-Rev: 5′–TGGTCTAACCAGAGAGAC–3′. The inner Nef primers were: For: 5′–TAAGACAGGGCTTGGAAAGG–3′ and Rev 5′–AAAGTCCCCAGCGGAAAGTC–3′. The PCR primer pair for the amplification of the full-length gag sequences (664–2509 on pNL4,3) were Gag-outer-For: 5′–AAGTAAGACCAGAGGAGATCTCTCGAC–3′; Gag-outer-Rev: 5′–CC AATTATGTTGACAGGTGTAGGTCCTAC–3′ and Gag-inner-For: 5′–TTTGACTAGCGGAGGCTAGAAGGA–3′; Gag-inner-Rev: 5′–GTATCATCTGCTCCTGTGTCTAAGAGAGC–3′. The selected primers amplified the entire gag and nef regions for sequencing. All PCR products were purified either by QIAquik PCR Purification kit or QIAquik gel Extraction kit (Qiagen) and sequenced using the Big-Dye chemistry (Applied Biosystems, Foster City, California, USA).
Polychromatic flow cytometry
Co-stimulatory monoclonal antibodies (anti-CD28 and anti-CD49d; each at 1 μg/ml) and CD107–FITC (a/b) (Becton Dickinson, San Jose, California, USA) were added to 1 × 10⁶ PBMC. Cells were pulsed with the appropriate peptide (10 μM) for 1 h before Monensin (10 μg/ml) was added, followed by a 5h incubation at 37°C in the presence of 5% CO2. For a positive control, Staphylococcus enterotoxin B at 1 μg/ml (Sigma–Aldrich, St Louis, Missouri, USA) was used. The cells were washed twice in phosphate-buffered saline and permeabilized with the Cytofix/cytoperm reagent (Becton Dickinson) for 20 min. at room temperature in the dark. The permeabilized cells were washed twice with the perm/wash buffer. The cells were labeled in a single step with the surface and intracellular antibodies. For the surface phenotype, the samples were stained with anti-CD3-Pacific Blue and anti-CD8–PercpCy5.5 (Becton Dickinson). The fluorochromes used for the intracellular cytokine staining were anti-interleukin (IL)2–APC, anti-tumor necrosis factor (TNF)α–PE Cy7, and anti-IFN-γ Alexa Fluor 700 conjugated antibodies (Becton Dickinson). For data analysis, at least 100 000 CD3 events were acquired on an LSR II flow cytometer (Becton Dickinson). Data was analyzed using FlowJo Version 8.1.1 software (TreeStar, San Carlos, California, USA). Lymphocytes were gated using forward scatter (FSC) and side scatter (SSC) and cytokine production was quantified using data gated on CD3 cells. CD127 and CD107 expression were analyzed on CD3CD8 T cells. Four functions (IFN-γ, IL-2, TNF-α and/or CD107) analysis of CD3CD8 T-cells was performed using Boolean gating. A positive response was defined as ≥3 standard deviations of the media (unstimulated) control and a value that was at least twice the media control in the individual assay.
Statistical analyses
Differences in the immune responses among the patients with selected HLA class I types were compared using the nonparametric Mann–Whitney U test. Plasma viral load and absolute CD4 T-cell counts changes over time were compared using the Wilcoxon signed rank test.
Results
Significant differences in epitope targeting by HLA B*57 and B*35/B*53 carriers in a cross-sectional study
Our initial analysis drew upon a population of young, predominantly African–American females described previously [20]. We compared the IFN-γ ELISpot responses to the entirety of the expressed HIV-1 genome, mapped down to individual 20-mers, and separated the results based on HLA class I allele carriage. T-cell responses in 23 subjects with HLA-B*57 (n = 7), HLA-B*35 (n = 7) or HLA-B*53 (n = 9) were compared with 29 subjects with other HLA class I alleles (total n =52). The clinical parameters of these study subjects including the number of subjects on ART is given in Table 1. We analyzed B*35/53 carriers jointly since they have nearly identical predicted HLA class I binding motifs, have been shown to bind identical HIV-1 optimized epitopes [23], have both been repeatedly associated with disease progression [2], and showed similar patterns of peptide recognition in this study. We did not sort the subjects into the B*35-Px and B*35-PY groups [24] due to the fact that studies in this US adolescent [21], or other populations [25] did not support clinical differences when comparing these two HLA-I alleles.
Table 1.
Clinical and laboratory characteristics of the study participants.
| N | Racea n/N (%) | CD4b | VLc | ART (%) | |
|---|---|---|---|---|---|
| HLA-B*57 | 7 | 6/7 (86) | 634 | 2 | 3 (43) |
| HLA-B*35/53 | 16 | 13/16 (81) | 629 | 3.3 | 10 (63) |
| Other HLA | 29 | 18/29 (62) | 558 | 3.6 | 23 (79) |
African–American;
absolute CD4 cell count (×106/l);
log10 viral load (RNA copies/ml).
B*57 carriers had a lower magnitude of CD8 T-cell responses when compared to B*35/53 carriers or to the rest of the cohort (P ≤ 0.02). This finding also extended to the breadth of responses since B*57 carriers recognized fewer individual peptides (mean, 2.7) when compared with B*35/53 carriers (mean, 7.3; P ≤ 0.03). B*57 carriers predominantly targeted p24 while B*35/53 carriers targeted Nef (P = 0.005 and 0.03, respectively; Fig. 1). We also calculated the entropy score of each HIV-1 protein [22] and compared it to the percentage of total T-cell response. The entropy of the individual targeted peptides were also the lowest (most conserved) in B*57 carriers compared with either the B*35/53 carriers or the rest of the cohort (data not shown).
Fig. 1. Comparison of T-cell responses with amino acid variability.
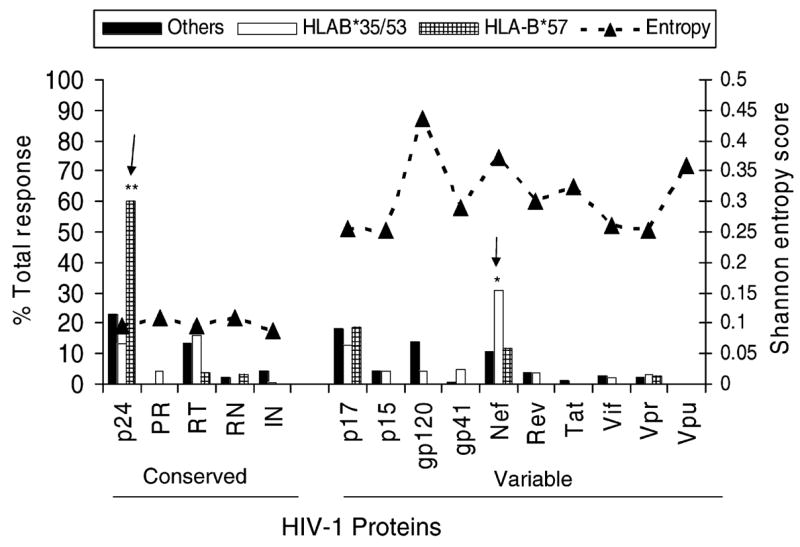
REACH subjects were sorted into three groups on the basis of HLA class I, i.e. HLA B*57, B*35 and B*53 and others alleles. The average percentage of the total response to each protein in the three patient groups is shown in relation to the average entropy for each protein. All the T-cell responses at the 15–20-mer peptide level were pooled to represent each protein:**B*57 response compared with B*35/53 (P =0.005) or others (P =0.02); *B*35/53 compared with B*57 (P =0.03) or others (P =0.001) using Mann-Whitney U test.
B*57 and B*35/B*53 carriers persistently targeted p24 and Nef respectively during longitudinal follow-up
In order to look in more detail at the potential changes and quality of CD8 T-cell responses, we enrolled 69 participants into protocol ATN 026 who carried HLA-B*35, B*53, and/or B*57. In the 45 participants who were off ART for at least one time point, the median plasma viral load (VL) was significantly different in B*35/B*53 (n =34) compared with B*57 (n = 11) carriers; VL, 10 310 versus 222 copies/ml respectively, (P <0.0001). We analyzed immune responses in 18 patients over a 4-year period who remained off ART or whose plasma VL did not decrease despite ART initiation (seven HLA-carriers and 11 B*35/53 carriers). The absolute CD4 cell counts remained stable over this period of time for both groups of patients; however, the VL significantly increased in the B*35/53 carriers (13793 to 23907; P =0.01), whereas it remained unchanged (170–222 RNA copies/ml) in the B*57 patients. Only four of 18 patients (all B*53 carriers) initiated ART during the longitudinal follow-up, and the plasma VL did not change with ART in any of them. In the B*57 group, >40% of the T-cell response was directed against Gag at baseline and this specificity was maintained (Fig. 2a). The mean breadth of the peptide recognition increased from 2.6 (baseline) to 3.3 (year 4) when 12 B*57 restricted epitopes were tested in an IFN-γ ELISpot assay (data not shown). During follow-up, only the immunodominant B*57 restricted Gag-KF11 responses increased in magnitude (median 180 to 750 SFC/106 PBMC; Fig. 2b). Median responses towards other HLA-B*57 restricted Gag and Nef epitopes declined or remained unchanged over time.
Fig. 2. Longitudinal analysis of T-cell responses in B*57 and B*35/53 subjects.

IFN-γ ELISpot T-cell responses in HLA-B*57 (n =7) and HLA-B*35/B*53 (n =11) subjects over a 4-year period are shown. The average percentage of the total response is shown for each targeted HIV-1 protein in (a) B*57 and (c) B*35/B*53. The median magnitude of response (SFC/106 PBMC) to all the optimized HLA-B*57 restricted HIV-1 Gag and Nef epitopes (9-11-mer) is shown in (b). The B*57 restricted peptides tested were: Gag 162–172: KAFSPEVIPMF (KF 11); Gag 240–250: TSTLQEQIGWF (TF 11); Gag 147–155: ISPRTLNAW (IW 9); Gag 241–249: STLQEQIGW (SW 9); Gag 308–316: QASQEVKNW (QW 9); Nef 116–125: HTQGYFPDWQ (HQ 10) and Nef 120–128: YFPDWQNYT (YT 9). (d) B*35/B*53 restricted peptides that were tested: Nef 135–143: YPLTFGWCY (YY 9); Nef 74–81: VPLRPMTY (VY 8); Gag 36–44: WASRELERF (WF 9); Gag 124–142: NSSKVSQNY (NY 9); Gag 254–262: PPIPVGDIY (PY 9); Gag 327–334: NPDCKTIL (NL 8); Gag 180–188: TPQDLNTML; Gag 308–316: QASQEVKNW (QW 9) and Gag 203–212: DTINEEAAEW (DW10).
In the B*35/B*53 group, nearly 40% of the T-cell response targeted Nef and this responder frequency persisted (Fig. 2c). There was also an increase in Nef specific T-cell responses largely targeting the HLA B*35/B*53-restricted YY9 epitope (median 150–500 SFC/106 PBMC; Fig. 2d). The median magnitude of other B*35/B*53 restricted Gag and Nef epitope responses remained unchanged. Of the 17 B*35/B*53 restricted peptides tested, the mean breadth of the response increased from 2.1 to 4.4 peptides over the 4-year time period (data not shown). Responses towards other HIV specific responses for both B*57 and B*35/B*53 responses were either negative or low in magnitude (data not shown).
The quality of the immunodominant CD8 T-cell responses were similar among B*57 and B*35/B*53 carriers
Using PBMC from four (B*57) and six (B*35/B*53) carriers and serial-fold peptide titrations in an IFN-γ ELISpot assay, we measured ’peptide avidity’ or the lowest concentration of peptide needed to stimulate a CD8 T-cell response. The mean YY9 peptide avidity was about one log higher when compared to KF11 (data not shown). Next, we analyzed cytokine production (IFN-γ, IL-2 and TNF-α), degranulation (CD107a/b) and memory marker (CD127) in T-cells in response to the Gag pool and KF11 (n = 10) B*57 subjects; Nef pool and YY9 peptides (n = 8) B*35/B*53 subjects in an ICS assay. A representative example is shown in Fig. 3. There were no significant differences in median responses between the groups in terms of either cytokine(s) production, degranulation or memory phenotype from either the protein pools or the single peptide.
Fig. 3. Cytokine production, degranulation and memory phenotype of B*57–KF11 and B*35/B*53-YY9 restricted CD8 T-cell responses.

PMBC were stimulated with peptides encompassing the KF11 peptide (B*57 subjects) or YY9 peptide (B*35/B*53 subjects) or SEB in an ICS assay as described. The production of IFN-γ, IL-2 and TNF-α by CD8 T-cells and the upregulation of CD127 and CD107 by CD3CD8 are shown. The top panel shows representative CD8 IFN-γ data from three subjects in each group. The bottom three panels show a representative data for CD8-IL2, CD8CD127 IFN-γ and CD8CD107 IFN-γ. The gates were drawn based upon density plots (not shown) using FlowJo software where a clear distinction was observed between CD8 positive and negative populations.
Boolean gating was performed to evaluate the percentage of CD8 T-cells responding with 1–4 functions (IFN-γ, IL-2, TNF-α and/or CD107). The responses to both the YY9 and the KF11 epitope were predominantly monofunctional (mean magnitude of 0.28 and 0.13 for KF11 and YY9, respectively). A much smaller percentage of responses to either epitope were bi-functional (mean magnitude of 0.04 and 0.02; KF11 and YY9, respectively), and 3% of the KF11-specific CD8 T cells secreted three cytokines including IFN-γ, IL-2 and TNF-α (mean magnitude 0.01) (Fig. 4a and 4b). While the bi-functional cells produced CD107 and IFN-γ (0.02 for KF11 and YY9), monofunctional cells were largely CD107-positive followed by IFN-γ-positive and/or IL-2-positive (Fig. 4c and 4d). There was a trend for KF11 specific CD8 T cells to produce more IL-2 than YY9 specific CD8 T-cells (P = 0.056). The one-four function responses were also evaluated for the sub-dominant Gag (B*57) and sub-dominant Nef (B*35/B*53) responses. The poly-functionality of these sub-dominant responses was similar in quality to the immunodominant KF11(B*57) or the YY9 (B*35/B*53) specific responses (data not shown). Therefore, while some differences did exist between KF11 and YY9 CD8 T cells in the quality of their responses, overall these differences were extremely small.
Fig. 4. Functional response patterns for KF11 and YY9 specific CD8 T-cells.

T-cell responses specific for B*57-KF11 (a) or B*35/B*53-YY9 (b) expressed as a mean of the CD8 T-cell response in polychromatic flow cytometry are shown in a pie chart based on their functional capacity (single, dual, triple, and quadruple function). Boolean gating was performed to determine the contributions of one to four functions measured from CD3CD8 cells that produced IFN-γ, IL-2, TNF-α and/or CD107. The responder frequency (% mean) of each of the 15 functional subpopulations is shown for B*57-KF11 (c) and B*35/B*53-YY9 (d).
CTL escape in p24 Gag and Nef is a common feature in B*57 and B*35/B*53 carriers, respectively
To determine if CTL escape was playing a role in the differences noted in viral control, we sequenced Gag and Nef from four B*57 and seven B*35/B*53 longitudinal pairs. In three of the B*57 subjects, CTL escape was observed in the Gag-IW9 [26] and Gag-TW10 [27] epitopes (Table 2). Two subjects had an escape mutation in the B*57 restricted Nef-HQ10 and Nef-KF9 epitopes [28–30] (Table 2). Among the B*35/B*53 carriers, very few mutations were observed in Gag; the E to D change in QW9 epitope has been described as a common variant and not a selection driven escape mutation [6]. In contrast, several mutations (Table 2) were observed in Nef, of which the Y81F has been shown to be an escape mutation [31]. Mutations in the YY9 epitope were observed in five subjects: Y135F in subjects 5 and 6, F139L in subject 7, and T138C in subjects 9 and 11. Peptides corresponding to the sequence changes in YY9 epitope at amino acids 138 and 139 were synthesized, tested in a peptide titration ELISpot assay and their poor recognition indicated CTL escape (data not shown).
Table 2.
Sequence changes in key HIV-1 epitopes targeted in B*57 and B*35/B*53 expressing patients.
| (aa 14–23) | (aa 30–40) | (aa 108–118) | (aa 176–184) | |||||||||||||||||||||||||||||||||||||||||||||||||||
|---|---|---|---|---|---|---|---|---|---|---|---|---|---|---|---|---|---|---|---|---|---|---|---|---|---|---|---|---|---|---|---|---|---|---|---|---|---|---|---|---|---|---|---|---|---|---|---|---|---|---|---|---|---|---|
| B*57 Gag | Patient | A | I | S | P | R | T | L | N | A | W | K | A | F | S | P | E | V | I | P | M | F | T | S | T | L | Q | E | Q | I | G | W | M | Q | A | S | Q | E | V | K | N | W | ||||||||||||
| 1Aa | – | – | – | – | – | – | – | – | – | – | – | – | – | – | – | – | – | – | – | – | – | – | – | – | – | – | – | – | – | – | – | – | – | – | – | – | – | – | – | – | – | |||||||||||||
| 1Ba | – | – | – | – | – | – | – | – | – | – | – | – | – | – | – | – | – | – | – | – | – | – | – | – | – | – | – | – | – | – | – | – | – | – | – | – | – | – | – | – | – | |||||||||||||
| 2A | P | L | – | – | – | – | – | – | – | – | – | – | – | – | – | – | – | – | – | – | – | – | – | N | – | – | – | – | – | – | – | – | – | – | – | – | – | – | – | – | – | |||||||||||||
| 2B | P | L | – | – | – | – | – | – | – | – | – | – | – | – | – | – | – | – | – | – | – | – | – | N | – | – | – | – | – | A | – | – | – | – | – | – | D | – | – | – | – | |||||||||||||
| 3A | – | – | – | – | – | – | – | – | – | – | – | – | – | – | – | – | – | – | – | – | – | – | – | – | – | – | – | – | – | – | – | – | – | – | – | – | D | – | – | – | – | |||||||||||||
| 3B | P | – | – | – | – | – | – | – | – | – | – | – | – | – | – | – | – | – | – | – | – | – | – | – | P | – | – | – | – | A | – | – | – | – | – | – | D | – | – | – | – | |||||||||||||
| 4A | – | L | – | – | – | – | – | – | – | – | – | – | – | – | – | – | – | – | – | – | – | – | – | N | – | – | – | – | – | T | – | – | – | – | – | – | D | – | – | – | – | |||||||||||||
| 4B | P | – | – | – | – | – | – | – | – | – | – | – | – | – | – | – | – | – | – | – | – | – | – | N | – | – | – | – | – | T | – | – | – | – | – | – | D | – | – | – | – | |||||||||||||
| (aa 82–90) | (aa 116–125) | (aa 120–128) | ||||||||||||||||||||||||||||||||||||||||||||||||||||
|
| ||||||||||||||||||||||||||||||||||||||||||||||||||||||
| B*57 Nef | Patient | K | A | A | V | D | L | S | H | F | H | T | Q | G | Y | F | P | D | W | Q | Y | F | P | D | W | Q | N | Y | T | |||||||||||||||||||||||||
|
| ||||||||||||||||||||||||||||||||||||||||||||||||||||||
| 1A | – | – | – | – | – | I | – | – | – | – | – | – | – | – | – | – | – | – | – | – | – | – | – | – | – | – | – | – | ||||||||||||||||||||||||||
| 1B | – | – | – | – | – | I | – | – | – | – | – | – | – | – | – | – | – | – | – | – | – | – | – | – | – | – | – | – | ||||||||||||||||||||||||||
| 2A | – | – | – | – | N | – | – | – | – | – | – | – | – | – | – | – | – | – | – | – | – | – | – | – | – | – | – | – | ||||||||||||||||||||||||||
| 2B | – | – | – | – | – | – | – | – | – | – | – | – | – | – | – | – | – | – | – | – | – | – | – | – | – | – | – | – | ||||||||||||||||||||||||||
| 3A | – | – | – | – | – | I | – | – | – | – | – | – | – | – | – | – | – | – | – | – | – | – | – | – | – | – | – | – | ||||||||||||||||||||||||||
| 3B | – | G | – | L | – | – | – | – | – | N | – | – | – | – | – | – | – | – | – | – | – | – | – | – | – | – | – | – | ||||||||||||||||||||||||||
| 4A | – | G | – | L | – | – | – | – | – | N | – | – | – | – | – | – | – | – | – | – | – | – | – | – | – | – | – | – | ||||||||||||||||||||||||||
| 4B | – | G | – | L | – | – | – | – | – | N | – | – | – | – | – | – | – | – | – | – | – | – | – | – | – | – | – | – | ||||||||||||||||||||||||||
| (aa 48–56) | (aa 71–80) | (aa 122–130) | (aa 176–184) | (aa 195–202) | ||||||||||||||||||||||||||||||||||||||||||||||||||
|
| ||||||||||||||||||||||||||||||||||||||||||||||||||||||
| B*35/53 Gag | Patient | T | P | Q | D | L | N | T | M | L | E | T | I | N | E | E | A | A | E | W | P | P | I | P | V | G | E | I | Y | Q | A | S | Q | E | V | K | N | W | N | P | D | C | K | T | I | L | ||||||||
|
| ||||||||||||||||||||||||||||||||||||||||||||||||||||||
| 5Aa | – | – | – | – | – | – | – | – | – | – | – | – | – | – | – | – | – | – | – | – | – | – | – | – | – | – | – | – | – | – | – | – | – | – | – | – | – | – | – | – | – | – | – | – | – | |||||||||
| 5Ba | – | – | – | – | – | – | – | – | – | – | – | – | – | – | – | – | – | – | – | – | – | – | – | – | – | – | – | – | – | – | – | – | D | – | – | – | – | – | – | – | – | – | – | – | – | |||||||||
| 6A | – | – | – | – | – | – | – | – | – | – | – | – | – | – | – | – | – | – | – | – | – | – | – | – | – | – | – | – | – | – | – | – | – | – | – | – | – | – | – | – | – | – | – | – | – | |||||||||
| 6B | – | – | – | – | – | – | – | – | – | – | – | – | – | – | – | – | – | – | – | – | – | – | – | – | – | – | – | – | – | – | – | – | – | – | – | – | – | – | – | – | – | – | – | – | – | |||||||||
| 7A | – | – | – | – | – | – | – | – | – | – | – | – | – | – | – | – | – | – | – | – | – | – | – | – | – | – | – | – | – | – | T | – | – | – | – | – | – | – | – | – | – | – | – | – | – | |||||||||
| 7B | – | – | H | – | – | – | – | – | – | – | – | – | – | – | – | – | – | – | – | – | – | – | – | – | – | – | – | – | – | – | T | – | – | – | – | – | – | – | – | – | – | – | – | – | – | |||||||||
| 8A | – | – | – | – | – | – | – | – | – | – | – | – | – | – | – | – | – | – | – | – | – | – | – | – | – | – | – | – | – | – | – | – | – | – | – | – | – | – | – | – | – | – | – | – | – | |||||||||
| 8B | – | – | – | – | – | – | – | – | – | – | – | – | – | – | – | – | – | – | – | – | – | – | – | – | – | – | – | – | – | – | – | – | – | – | – | – | – | – | – | – | – | – | – | – | – | |||||||||
| 9A | – | – | – | – | – | – | – | – | – | – | – | – | – | D | – | – | – | – | – | – | – | – | – | – | – | – | – | – | – | – | – | – | D | – | – | – | – | – | – | – | – | – | – | – | – | |||||||||
| 9B | – | – | – | – | – | – | – | – | – | – | – | – | – | – | – | – | – | – | – | – | – | – | – | – | – | – | – | – | – | – | – | – | – | – | – | – | – | – | – | – | – | – | – | – | – | |||||||||
| 10A | – | – | – | – | – | – | – | – | – | – | – | – | – | – | – | – | – | – | – | – | – | – | – | – | – | – | – | – | – | – | – | – | – | – | – | – | – | – | – | – | – | – | – | – | – | |||||||||
| 10B | – | – | – | – | – | – | – | – | – | – | – | – | – | – | – | – | – | – | – | – | – | – | – | – | – | – | – | – | – | – | T | – | – | – | – | – | – | – | – | – | – | – | – | – | – | |||||||||
| 11A | – | – | – | – | – | – | – | – | – | – | – | – | – | – | – | – | – | – | – | – | – | – | – | – | – | – | – | – | – | – | – | – | D | – | – | S | – | – | – | – | – | – | – | – | – | |||||||||
| 11B | – | – | – | – | – | – | – | – | – | – | – | – | – | – | – | – | – | – | – | – | – | – | – | – | – | – | – | – | – | – | – | – | D | – | – | S | – | – | – | – | – | – | – | – | – | |||||||||
| (aa 68–76) | (aa 71–81) | (aa 127–137) | (aa 135–143) | (aa 166–177) | ||||||||||||||||||||||||||||||||||||||||||||||||||
|
| ||||||||||||||||||||||||||||||||||||||||||||||||||||||
| B*35/53 Nef | Patient | F | P | V | R | P | Q | V | P | L | R | P | Q | V | P | L | R | P | M | T | Y | T | P | G | P | G | I | R | Y | P | L | Y | P | L | T | F | G | W | C | F | H | P | M | S | L | H | G | M | D | D | P | E | ||
|
| ||||||||||||||||||||||||||||||||||||||||||||||||||||||
| 5A | – | – | – | – | – | – | – | – | – | – | – | – | – | – | – | – | – | – | – | – | – | – | – | – | – | T | – | F | – | – | F | – | – | – | – | – | – | – | – | – | – | V | C | Q | – | – | – | – | – | – | – | |||
| 5B | – | – | – | – | – | – | – | – | – | – | – | – | – | – | – | – | – | – | – | – | – | – | – | – | – | T | – | – | – | – | – | – | – | – | – | – | – | – | – | – | – | V | C | Q | – | – | – | – | – | – | – | |||
| 6A | – | – | – | – | – | – | – | – | – | – | – | – | – | – | – | – | – | I | – | – | – | – | – | – | – | – | – | – | – | – | – | – | – | – | – | – | – | – | – | – | – | – | – | Q | – | – | – | – | – | – | – | |||
| 6B | – | – | – | – | – | – | – | – | – | – | – | – | – | – | – | – | – | – | N | – | – | – | – | – | – | T | – | F | – | – | F | – | – | – | – | – | – | – | – | N | – | – | – | – | – | – | – | – | – | – | – | |||
| 7A | – | – | – | – | – | – | – | – | – | – | – | – | – | – | – | – | – | – | – | T | – | – | – | – | – | T | – | – | – | – | – | – | – | – | L | – | – | – | – | – | – | L | – | Q | – | – | – | – | – | – | – | |||
| 7B | – | – | – | – | – | – | – | – | – | – | – | – | – | – | – | – | – | – | – | T | – | – | – | – | – | T | – | – | – | – | – | – | – | – | L | – | – | – | – | – | – | L | – | Q | – | – | – | – | – | – | – | |||
| 8A | – | – | – | K | – | – | L | – | – | K | – | – | L | – | – | – | – | – | – | – | – | – | – | – | – | P | – | – | – | – | – | – | – | – | – | – | – | – | – | – | – | – | – | Q | – | – | – | – | – | L | – | |||
| 8B | – | – | – | K | – | – | – | – | – | K | – | – | – | – | – | – | – | – | – | F | – | – | – | – | – | P | – | – | – | – | – | – | – | – | – | – | – | – | – | – | – | – | – | Q | – | – | – | – | – | L | – | |||
| 9A | – | – | – | – | – | – | – | – | – | – | – | – | – | – | – | – | – | – | – | – | – | K | – | – | – | – | – | – | – | – | – | – | – | C | – | – | – | – | – | – | – | A | – | – | – | – | – | – | – | – | – | |||
| 9B | – | – | – | – | – | – | – | – | – | – | – | – | – | – | – | – | – | – | – | – | – | K | – | – | – | – | – | – | – | – | – | – | – | C | – | – | – | – | – | – | – | A | – | – | – | – | – | – | – | – | – | |||
| 10A | – | – | – | – | – | – | – | – | – | – | – | – | – | – | – | – | – | – | – | – | – | – | – | – | – | V | – | – | – | – | – | – | – | – | – | – | – | – | – | – | – | – | – | – | – | – | – | – | – | S | – | |||
| 10B | – | – | – | – | – | – | – | – | – | – | – | – | – | – | – | – | – | I | – | – | – | – | – | – | – | – | – | – | – | – | – | – | – | – | – | – | – | – | – | – | – | – | – | – | – | – | – | – | – | – | – | |||
| 11A | – | – | – | – | – | – | – | – | – | – | – | – | – | – | – | – | – | – | – | – | – | – | – | – | – | I | – | – | – | – | – | – | – | – | – | – | – | – | – | – | – | V | – | – | – | – | – | E | – | S | – | |||
| 11B | – | – | – | – | – | – | – | – | – | – | – | – | – | – | – | – | – | – | – | – | – | – | – | – | – | – | – | – | – | – | – | – | – | C | – | – | – | – | – | Q | – | E | – | – | – | – | – | E | – | S | – | |||
A and B are sequences at baseline and longitudinal follow-up (mean, 47 and 30 months) for B*57 and B*35/B*53 patients respectively. Amino-acid changes from HXB-2 sequence are shown.
Discussion
Our prior findings led us to the hypothesis that the viral control seen in HLA-B*57 carriers is associated with CD8 T-cell targeting of Gag [8]. A corollary to this hypothesis would predict that HLA class I alleles not associated with improved viral control would mediate CD8 T-cell responses skewed away from this protein. As anticipated, the current study demonstrated that HIV-specific CD8 T cells in B*57 carriers were focused on lower entropy epitopes in p24 while B*35/53 targeted higher entropy epitopes in Nef. These findings are consistent with the recent demonstration that viral control in HLA-B*5703 carriers was associated with targeting of Gag [15], whereas targeting of envelope and accessory proteins was associated with poor viral control. One possible explanation for the observed differences in protein targeting would be that the peptides with the capacity to bind different HLA class I molecules are unevenly distributed throughout the HIV-1 genome. If that were the case, B*57 would preferentially target p24 because this protein coincidentally contained more B*57 epitopes. However, the ’Motif Scan’ program for predicting HLA class I bound peptides (Los Alamos National Laboratory), identified 49 HLA-B*5301 restricted Gag epitopes and only 15 B*57 restricted ones (data not shown).
Despite the fact that numerous studies have demonstrated the importance of Gag-specific CD8 T-cell responses, the mechanism underlying this viral control benefit remains elusive. We hypothesized that B*57 restricted responses might be qualitatively superior to those restricted by other alleles. In that case, B*57 restricted CD8 T cells would respond to lower concentrations of peptides; however, the opposite was observed as B*35/53-restricted YY9 CD8 T cells tended to respond to a lower peptide concentration. Another recently suggested possibility is that LTNP exert better control of HIV because their CD8 T cells were able to secrete multiple cytokines and degranulate [19]. We therefore determined if these polyfunctional CD8 T cells were seen more commonly in our cohort of HLA-B*57 carriers. Although a small fraction (3%) of the B*57 restricted CD8 T cells were polyfunctional, it is important to note that that this marginal increase in polyfunctional response may not be responsible for effective viral control. Rather, it is possible that effective HIV control results in a polyfunctional response.
We also reasoned that the targeting of low entropy epitopes as seen in B*57 carriers would make it more difficult for the virus to escape away from these responses. However, three of the four B*57 carriers had escape mutations present in p24 epitopes. While escape from these epitopes is clearly associated with decreased viral control [26], it is not an absolute association as several LTNP showed evidence of escape mutations in B*57-restricted epitopes [6]. We also noted numerous escape mutations in the Nef epitopes of B*35/53 carriers. In view of the fact that not all CD8 T-cell responses select for escape variants [32], our data indicate that even the B*35/53 responses are relatively superior in quality. This statement is supported by the fact that we were not able to demonstrate significant differences in the quality of B*57 and B*35/53 responses indicating that any variances may be quite subtle.
In total, we demonstrate that B*57 restricted responses induced viral escape mutations in Gag and Nef, while B*35/53 restricted responses were only able to induce escape mutations in Nef. These data are consistent with the hypothesis that mutations in Gag incur a high fitness cost to the virus [27,33–37] while those in Nef incur very little fitness cost [30,38]. Interestingly, we have also recently demonstrated that recipients of certain HLA class I associated p24 mutations are associated with a lower plasma viral load set point in newly infected individuals while Nef mutations were not associated with a decreased VL set point (P.A. Goepfert, et al., unpublished data).
Taken together, these findings demonstrate an important mechanism whereby carriers of certain HLA class I alleles may experience significantly different disease outcomes. Since many of the current HIV vaccine strategies aim at protecting more against disease progression than against HIV infection [39–41], it would be important to include Gag in any of thesevaccines. This recommendation is based not only on the fact that Gag mutations induce aviral fitness cost but also because the targeting of Gag may occur very early [42] even prior to the Nef-induced down-modulation of MHC class I expression [43,44]. Although our findings as well as those of other groups do not demonstrate viral control benefits with CD8 T-cell targeting of Nef in chronic infection [13,15], it should not be concluded that these types of responses would be deleterious in a preventive vaccine. Including immunogens like Nef that can be targeted relatively early by the immune system may well be beneficial [45]. A better understanding of immune correlates of protection is needed for the optimal design of a preventive HIV vaccine.
Acknowledgments
We acknowledge the contribution of the investigators and staff at the following ATN sites that participated in this study: Children’s Diagnostic and Treatment Center (A. Puga, E. Leonard, F. Howard); Children’s Hospital of Los Angeles (M. Belzer, C. Salata, D. Tucker); Children’s National Medical Center (L. D’Angelo, C. Trexler); Cook County Hospital/University of Chicago (L. Henry-Reid, K. Bojan, R. Jackson); Montefiore Medical Center (D. Futterman, E. Enriquez-Bruce, A. Myerson); Mt. Sinai Medical Center (L. Levin, M. Geiger, A. Lee); University of Maryland (L. Peralta, L. Flores, B. Griffin); University of Miami (L. Friedman, D. Maturo, H. Major-Wilson), University of Pennsylvania and the Children’s Hospital of Philadelphia (B. Rudy, M. Tanney, M. Moran); and Tulane Medical Center (S.E. Abdalian, L. Kozina, L. Wenthold). Four of these sites utilized their General Clinical Research Center (GCRC)/Pediatric Clinical Research Center (PCRC) for this study. These centers were supported by grants from the General Clinical Research Center Program of the National Center for Research Resources, National Institutes of Health, Department of Health and Human Services as follows: Children’s National Medical Center, M01-RR13297; University of Maryland, M01 RR165001; University of Pennsylvania/Children’s Hospital of Philadelphia, M01 RR00240; and Tulane Medical Center, M01 RR 05096-10.
The study was scientifically reviewed by the ATN’s Therapeutic Leadership Group. Network scientific and logistical support was provided by the ATN Coordinating Center (C. Wilson, C. Partlow) at University of Alabama at Birmingham. Network operations and analytic support was provided by the ATN Data and Operations Center at Westat, Inc. (J. Ellenberg, K. Joyce). The investigators are grateful to the members of the Community Advisory Board for their insight and counsel and are particularly indebted to the youth who participated in this study.
Finally, we appreciate the helpful suggestions of Dr Steffanie Sabbaj and would also like to thank Dr Philip J. Goulder for critiquing this manuscript. We also wish to acknowledge Marion Spell for flow cytometric acquistion and Christopher Perkins for excellent technical assistance.
Sponsorship: Supported by grants AI49126, A1073103-01 and A1064060 (PAG); AI41951 (RAK) and from the National Institutes of Allergy and Infectious Diseases (NIAID) and Grand challenges in Global Health Initiative, Bill and Melinda Gates foundation grant. The REACH study was initially funded by grant U01 HD32830 from the National Institute of Child Health and Human Development (NICHD), with additional funding from the National Institute on Drug Abuse, NIAID, and National Institute of Mental Health. The Adolescent Trials Network for HIV/AIDS Interventions (ATN) is currently funded by grant no. U01 HD40533 from the National Institutes of Health through the National Institute of Child Health and Human Development (A. Rogers, R. Nugent, L. Serchuck), with supplemental funding from the National Institutes on Drug Abuse (N. Borek), Mental Health (A. Forsyth, P. Brouwers), and Alcohol Abuse and Alcoholism (K. Bryant).
References
- 1.Altfeld M, Addo MM, Rosenberg ES, Hecht FM, Lee PK, Vogel M. Influence of HLA-B57 on clinical presentation and viral control during acute HIV-1 infection. Aids. 2003;17:2581–2591. doi: 10.1097/00002030-200312050-00005. [DOI] [PubMed] [Google Scholar]
- 2.Carrington M, Nelson GW, Martin MP, Kissner T, Vlahov D, Goedert JJ. HLA and HIV-1: heterozygote advantage and B*35-Cw*04 disadvantage. Science. 1999;283:1748–1752. doi: 10.1126/science.283.5408.1748. [DOI] [PubMed] [Google Scholar]
- 3.Hendel H, Caillat-Zucman S, Lebuanec H, Carrington M, O’Brien FS, Andrieu JM. New class I and II HLA alleles strongly associated with opposite patterns of progression to AIDS. J Immunol. 1999;162:6942–6946. [PubMed] [Google Scholar]
- 4.Migueles SA, Sabbaghian MS, Shupert WL, Bettinotti MP, Marincola FML, Martino L. HLA B*5701 is highly associated with restriction of virus replication in a subgroup of HIV-infected long term nonprogressors. Proc Natl Acad Sci USA. 2000;97:2709–2714. doi: 10.1073/pnas.050567397. [DOI] [PMC free article] [PubMed] [Google Scholar]
- 5.Kaslow RA, Carrington M, Apple R, Park L, Muñoz A, Saah AJ. Influence of combinations of human major histocompatibility complex genes on the course of HIV-1 infection. Nat Med. 1996;2:405–411. doi: 10.1038/nm0496-405. [DOI] [PubMed] [Google Scholar]
- 6.Migueles SA, Laborico AC, Imamichi H, Shupert WL, Royce C, McLaughlin FM. The differential ability of HLA B*5701+long-term nonprogressors and progressors to restrict human immunodeficiency virus replication is not caused by loss of recognition of autologous viral gag sequences. J Virol. 2003;77:6889–6898. doi: 10.1128/JVI.77.12.6889-6898.2003. [DOI] [PMC free article] [PubMed] [Google Scholar]
- 7.Musey L, Hughes J, Schacker T, Shea T, Corey L, McElrath MJ. Cytotoxic-T-cell responses, viral load, and disease progression in early human immunodeficiency virus type 1 infection. N Engl J Med. 1997;337:1267–1274. doi: 10.1056/NEJM199710303371803. [DOI] [PubMed] [Google Scholar]
- 8.Edwards BH, Bansal A, Sabbaj S, Bakari J, Mulligan MJ, Goepfert PA. Magnitude of functional CD8(+) T-cell responses to the gag protein of human immunodeficiency virus type 1 correlates inversely with viral load in plasma. J Virol. 2002;76:2298–2305. doi: 10.1128/jvi.76.5.2298-2305.2002. [DOI] [PMC free article] [PubMed] [Google Scholar]
- 9.Klein MR, van Baalen CA, Holwerda AM, Kerkhof Garde SR, Bende RJ, Keet IP. Kinetics of Gag-specific cytotoxic T lymphocyte responses during the clinical course of HIV-1 infection: a longitudinal analysis of rapid progressors and long-term asymptomatics. J Exp Med. 1995;181:1365–1372. doi: 10.1084/jem.181.4.1365. [DOI] [PMC free article] [PubMed] [Google Scholar]
- 10.Riviere Y, McChesney MB, Porrot F, Tanneau-Salvadori F, Sansonetti P, Lopez O. Gag-specific cytotoxic responses to HIV type 1 are associated with a decreased risk of progression to AIDS-related complex or AIDS. AIDS Res Hum Retroviruses. 1995;11:903–907. doi: 10.1089/aid.1995.11.903. [DOI] [PubMed] [Google Scholar]
- 11.Ogg GS, Jin X, Bonhoeffer S, Nowak MA, Monrad S, Segal JP. Quantitation of HIV-1-specific cytotoxic T lymphocytes and plasma load of viral RNA. Science. 1998;279:2103–2106. doi: 10.1126/science.279.5359.2103. [DOI] [PubMed] [Google Scholar]
- 12.Novitsky V, Gilbert P, Peter T, McLane MF, Gaolekwe S, Rybak N. Association between virus-specific T-cell responses and plasma viral load in human immunodeficiency virus type 1 subtype C infection. J Virol. 2003;77:882–890. doi: 10.1128/JVI.77.2.882-890.2003. [DOI] [PMC free article] [PubMed] [Google Scholar]
- 13.Masemola A, Mashishi T, Khoury G, Mohube P, Mokgotho P, Vardas E. Hierarchical targeting of subtype C human immunodeficiency virus type 1 proteins by CD8+ T cells: correlation with viral load. J Virol. 2004;78:3233–3243. doi: 10.1128/JVI.78.7.3233-3243.2004. [DOI] [PMC free article] [PubMed] [Google Scholar]
- 14.Zuniga R, Lucchetti A, Galvan P, Sanchez S, Sanchez C, Hernandez A. Relative dominance of Gag p24-specific cytotoxic T lymphocytes is associated with human immunodeficiency virus control. J Virol. 2006;80:3122–3125. doi: 10.1128/JVI.80.6.3122-3125.2006. [DOI] [PMC free article] [PubMed] [Google Scholar]
- 15.Kiepiela P, Ngumbela K, Thobakgale C, Ramduth D, Honeyborne I, Moodley E. CD8+ T-cell responses to different HIV proteins have discordant associations with viral load. Nat Med. 2007;13:46–53. doi: 10.1038/nm1520. [DOI] [PubMed] [Google Scholar]
- 16.Leslie A, Price DA, Mkhize P, Bishop K, Rathod A, Day C. Differential selection pressure exerted on HIV by CTL targeting identical epitopes but restricted by distinct HLA alleles from the same HLA supertype. J Immunol. 2006;177:4699–4708. doi: 10.4049/jimmunol.177.7.4699. [DOI] [PubMed] [Google Scholar]
- 17.Kaslow RA, Rivers C, Tang J, Bender TJ, Goepfert PA, Habib R. Polymorphisms in HLA class I genes associated with both favorable prognosis of human immunodeficiency virus (HIV) type 1 infection and positive cytotoxic T-lymphocyte responses to ALVAC-HIV recombinant canarypox vaccines. J Virol. 2001;75:8681–8689. doi: 10.1128/JVI.75.18.8681-8689.2001. [DOI] [PMC free article] [PubMed] [Google Scholar]
- 18.Migueles SA, Laborico AC, Shupert WL, Sabbaghian MS, Rabin R, Hallahan CW. HIV-specific CD8+ T cell proliferation is coupled to perforin expression and is maintained in nonprogressors. Nat Immunol. 2002;3:1061–1068. doi: 10.1038/ni845. [DOI] [PubMed] [Google Scholar]
- 19.Betts MR, Nason MC, West SM, De Rosa SC, Migueles SA, Abraham J. HIV nonprogressors preferentially maintain highly functional HIV-specific CD8+ T cells. Blood. 2006;107:4781–4789. doi: 10.1182/blood-2005-12-4818. [DOI] [PMC free article] [PubMed] [Google Scholar]
- 20.Bansal A, Sabbaj S, Edwards BH, Ritter D, Perkins C, Tang J, et al. T cell responses in HIV Type 1-infected adolescent minorities share similar epitope specificities with whites despite significant differences in HLA class I alleles. AIDS Res Hum Retroviruses. 2003;19:1017–1026. doi: 10.1089/088922203322588378. [DOI] [PubMed] [Google Scholar]
- 21.Tang J, Wilson CM, Meleth S, Myracle A, Lobashevsky E, Mulligan M. Host genetic profiles predict virological and immunological control of HIV-1 infection in adolescents. AIDS. 2002;16:2275–2284. doi: 10.1097/00002030-200211220-00007. [DOI] [PubMed] [Google Scholar]
- 22.Yusim K, Kesmir C, Gaschen B, Addo MM, Altfeld MM, Brunak S. Clustering patterns of cytotoxic T-lymphocyte epitopes in human immunodeficiency virus type 1 (HIV-1) proteins reveal imprints of immune evasion on HIV-1 global variation. J Virol. 2002;76:8757–8768. doi: 10.1128/JVI.76.17.8757-8768.2002. [DOI] [PMC free article] [PubMed] [Google Scholar]
- 23.Sabbaj S, Bansal A, Ritter GD, Perkins C, Edwards BH, Gough E. Cross-Reactive CD8+ T Cell Epitopes Identified in US Adolescent Minorities. J Acquir Immune Defic Syndr. 2003;33:426–438. doi: 10.1097/00126334-200308010-00003. [DOI] [PubMed] [Google Scholar]
- 24.Gao X, Nelson GW, Karacki P, Martin MP, Phair J, Kaslow R. Effect of a single amino acid change in MHC class I molecules on the rate of progression to AIDS. N Engl J Med. 2001;344:1668–1675. doi: 10.1056/NEJM200105313442203. [DOI] [PubMed] [Google Scholar]
- 25.Tang J, Tang S, Lobashevsky E, Myracle AD, Fideli U, Aldrovandi G. Favorable and unfavorable HLA class I alleles and haplotypes in Zambians predominantly infected with clade C human immunodeficiency virus type 1. J Virol. 2002;76:8276–8284. doi: 10.1128/JVI.76.16.8276-8284.2002. [DOI] [PMC free article] [PubMed] [Google Scholar]
- 26.Draenert R, Le Gall S, Pfafferott KJ, Leslie AJ, Chetty P, Brander C. Immune selection for altered antigen processing leads to cytotoxic T lymphocyte escape in chronic HIV-1 infection. J Exp Med. 2004;199:905–915. doi: 10.1084/jem.20031982. [DOI] [PMC free article] [PubMed] [Google Scholar]
- 27.Leslie AJ, Pfafferott KJ, Chetty P, Draenert R, Addo MM, Feeney M. HIV evolution: CTL escape mutation and reversion after transmission. Nat Med. 2004;10:282–289. doi: 10.1038/nm992. [DOI] [PubMed] [Google Scholar]
- 28.Pillay T, Zhang HT, Drijfhout JW, Robinson N, Brown H, Khan M. Unique acquisition of cytotoxic T-lymphocyte escape mutants in infant human immunodeficiency virus type 1 infection. J Virol. 2005;79:12100–12105. doi: 10.1128/JVI.79.18.12100-12105.2005. [DOI] [PMC free article] [PubMed] [Google Scholar]
- 29.Feeney ME, Tang Y, Pfafferott K, Roosewelt KA, Draenert R, Trocha A. HIV-1 viral escape in infancy followed by emergence of a variant-specific CTL response. J Immunol. 2005;174:7524–7530. doi: 10.4049/jimmunol.174.12.7524. [DOI] [PubMed] [Google Scholar]
- 30.Leslie A, Kavanagh D, Honeyborne I, Pfafferott K, Edwards C, Pillay T. Transmission and accumulation of CTL escape variants drive negative associations between HIV polymorphisms and HLA. J Exp Med. 2005;201:891–902. doi: 10.1084/jem.20041455. [DOI] [PMC free article] [PubMed] [Google Scholar]
- 31.Bansal A, Gough E, Sabbaj S, Ritter D, Yusim K, Sfakianos G. CD8 T-cell responses in early HIV-1 infection are skewed towards high entropy peptides. AIDS. 2005;19:241–250. [PubMed] [Google Scholar]
- 32.Draenert R, Verrill CL, Tang Y, Allen TM, Wurcel AG, Boczanowski M. Persistent recognition of autologous virus by high-avidity CD8 T cells in chronic, progressive human immunodeficiency virus type 1 infection. J Virol. 2004;78:630–641. doi: 10.1128/JVI.78.2.630-641.2004. [DOI] [PMC free article] [PubMed] [Google Scholar]
- 33.Friedrich TC, Dodds EJ, Yant LJ, Vojnov L, Rudersdorf R, Cullen C. Reversion of CTL escape-variant immunodeficiency viruses in vivo. Nat Med. 2004;10:275–281. doi: 10.1038/nm998. [DOI] [PubMed] [Google Scholar]
- 34.Kobayashi M, Igarashi H, Takeda A, Kato M, Matano T. Reversion in vivo after inoculation of a molecular proviral DNA clone of simian immunodeficiency virus with a cytotoxic-T-lymphocyte escape mutation. J Virol. 2005;79:11529–11532. doi: 10.1128/JVI.79.17.11529-11532.2005. [DOI] [PMC free article] [PubMed] [Google Scholar]
- 35.Matano T, Kobayashi M, Igarashi H, Takeda A, Nakamura H, Kano M. Cytotoxic T lymphocyte-based control of simian immunodeficiency virus replication in a preclinical AIDS vaccine trial. J Exp Med. 2004;199:1709–1718. doi: 10.1084/jem.20040432. [DOI] [PMC free article] [PubMed] [Google Scholar]
- 36.Martinez-Picado J, Prado JG, Fry EE, Walsh K, Dale CJ, Smith M. Fitness cost of escape mutations in p24 Gag in association with control of human immunodeficiency virus type 1. J Virol. 2006;80:3617–3623. doi: 10.1128/JVI.80.7.3617-3623.2006. [DOI] [PMC free article] [PubMed] [Google Scholar]
- 37.Fernandez CS, Stratov I, De Rose R, Walsh K, Dale CJ, Smith MZ. Rapid viral escape at an immunodominant simian-human immunodeficiency virus cytotoxic T-lymphocyte epitope exacts a dramatic fitness cost. J Virol. 2005;79:5721–5731. doi: 10.1128/JVI.79.9.5721-5731.2005. [DOI] [PMC free article] [PubMed] [Google Scholar]
- 38.Deacon NJ, Tsykin A, Solomon A, Smith K, Ludford-Menting M, Hooker D. Genomic structure of an attenuated quasi species of HIV-1 from a blood transfusion donor and recipients. Science. 1995;270:988–991. doi: 10.1126/science.270.5238.988. [DOI] [PubMed] [Google Scholar]
- 39.Amara RR, Villinger F, Altman JD, Lydy SL, O’Neil SP, Staprans SI. Control of a mucosal challenge and prevention of AIDS by a multiprotein DNA/MVA vaccine. Science. 2001;292:69–74. doi: 10.1126/science.1058915. [DOI] [PubMed] [Google Scholar]
- 40.Shiver JW, Fu TM, Chen L, Casimiro DL, Davies ME, Evans RK. Replication-incompetent adenoviral vaccine vector elicits effective antiimmunodeficiency-virus immunity. Nature. 2002;415:331–335. doi: 10.1038/415331a. [DOI] [PubMed] [Google Scholar]
- 41.Barouch DH, Santra S, Schmitz JE, Kuroda MJ, Fu TM, Wagner W. Control of viremia and prevention of clinical AIDS in rhesus monkeys by cytokine-augmented DNA vaccination. Science. 2000;290:486–492. doi: 10.1126/science.290.5491.486. [DOI] [PubMed] [Google Scholar]
- 42.Loffredo JT, Burwitz BJ, Rakasz EG, Spencer SP, Stephany JJ, Vela JP. The antiviral efficacy of simian immunodeficiency virus-specific CD8+ T cells is unrelated to epitope specificity and is abrogated by viral escape. J Virol. 2007;81:2624–2634. doi: 10.1128/JVI.01912-06. [DOI] [PMC free article] [PubMed] [Google Scholar]
- 43.Schmitz JE, Kuroda MJ, Santra S, Sasseville VG, Simon MA, Lifton MA. Control of viremia in simian immunodeficiency virus infection by CD8+ lymphocytes. Science. 1999;283:857–860. doi: 10.1126/science.283.5403.857. [DOI] [PubMed] [Google Scholar]
- 44.Collins KL, Chen BK, Kalams SA, Walker BD, Baltimore D. HIV-1 Nef protein protects infected primary cells against killing by cytotoxic T lymphocytes. Nature. 1998;391:397–401. doi: 10.1038/34929. [DOI] [PubMed] [Google Scholar]
- 45.Wilson NA, Reed J, Napoe GS, Piaskowski S, Szymanski A, Furlott J. Vaccine-induced cellular immune responses reduce plasma viral concentrations after repeated low-dose challenge with pathogenic simian immunodeficiency virus SIVmac239. J Virol. 2006;80:5875–5885. doi: 10.1128/JVI.00171-06. [DOI] [PMC free article] [PubMed] [Google Scholar]