

Abstract
A neuroprotected state can be acquired by preconditioning brain with a stimulus that is subthreshold for damage (tolerance). Acquisition of tolerance involves coordinate, bi-directional changes to gene expression levels and the re-programmed phenotype is determined by the preconditioning stimulus. While best studied in ischemic brain there is evidence brief seizures can confer tolerance against prolonged seizures (status epilepticus). Presently, we developed a model of epileptic preconditioning in mice and used microarrays to gain insight into the transcriptional phenotype within the target hippocampus at the time tolerance had been acquired. Epileptic tolerance was induced by an episode of non-damaging seizures in adult C57Bl/6 mice using a systemic injection of kainic acid. Neuron and DNA damage-positive cell counts 24 h after status epilepticus induced by intraamygdala microinjection of kainic acid revealed preconditioning given 24 h prior reduced CA3 neuronal death by ~45% compared with non-tolerant seizure mice. Microarray analysis of over 39,000 transcripts (Affymetrix 430 2.0 chip) from microdissected CA3 subfields was undertaken at the point at which tolerance was acquired. Results revealed a unique profile of small numbers of equivalently up- and down-regulated genes with biological functions that included transport and localization, ubiquitin metabolism, apoptosis and cell cycle control. Select microarray findings were validated post hoc by real-time polymerase chain reaction and Western blotting. The present study defines a paradigm for inducing epileptic preconditioning in mice and first insight into the global transcriptome of the seizure-damage refractory brain.
Keywords: epilepsy, transcriptome, kainic acid, tolerance, neuroprotection, apoptosis
Stressful and potentially noxious insults that are subthreshold for damage are capable of rendering brain refractory to damage incurred by a subsequent, prolonged and otherwise harmful stressor (Dirnagl et al., 2003). This process, termed preconditioning, is a highly conserved endogenous mechanism by which brain can protect itself (tolerance) (Chen and Simon, 1997). The molecular mechanisms underlying this process may yield novel and potent neuroprotective strategies to mitigate the harmful effects of neurological insults such as ischemia, traumatic brain injury and prolonged seizures (status epilepticus) (Gidday, 2006).
Tolerance in brain was originally identified as a gene synthesis-dependent process that took 1–3 days to be acquired in vivo (Kitagawa et al., 1991; Simon et al., 1993; Chen et al., 1996). The process is highly conserved, being readily elicited in numerous rat and mouse models of ischemic brain injury (Dirnagl et al., 2003; Gidday, 2006; Stenzel-Poore et al., 2007). It may also have clinical relevance as evinced by more favorable outcomes in patients experiencing transient ischemic attacks prior to a large stroke (Weih et al., 1999). Preconditioning can also be induced by other brain insults including seizure (Sasahira et al., 1995; Najm et al., 1998; El Bahh et al., 2001; Borges et al., 2007) and certain chemicals/drugs (Rosenzweig et al., 2004), and cross-tolerance whereby ischemic and other paradigms are combined has also been reported in rodents (Plamondon et al., 1999; Towfighi et al., 1999).
Microarray technology has enabled large-scale understanding of global gene expression changes during complex, multi-factorial pathophysiological processes to be identified in a comprehensive and unbiased manner (Lockhart and Barlow, 2001). Microarray analysis has been applied to better understand the molecular mechanisms underlying the damage-refractory phenotype of the ischemia-preconditioned rodent brain (Stenzel-Poore et al., 2003, 2004, 2007). Preconditioning reprograms the brain’s response to ischemia in a stimulus-specific manner via induction of novel pathways not previously implicated in neuroprotection (Stenzel-Poore et al., 2007). The major phenotype of the ischemia-preconditioned brain after prolonged ischemia is down-regulation of genes involved in heavily energy-dependent metabolic processes (Stenzel-Poore et al., 2007). Transcriptome commonalities are shared with organisms that hibernate, where prolonged periods of oxygen deprivation are tolerated (Frerichs et al., 1994; Lee and Hallenbeck, 2006).
Microarrays have been used to profile the transcriptome of seizure-damaged rat brain (Hunsberger et al., 2005), and rat brain during epileptogenesis (Elliott et al., 2003; Lukasiuk et al., 2003; Gorter et al., 2006). More recently, the transcriptome of epileptic preconditioning was reported in the major hippocampal subfields in a rat model (Borges et al., 2007) and microarrays have profiled hippocampus after electroshock seizure in rodents (French et al., 2001; Newton et al., 2003; Ploski et al., 2006); a potential preconditioning stimulus. Clinically, hippocampal levels of cell death-regulatory genes from patients with intractable temporal lobe epilepsy may share commonalities with expression profiles elicited by tolerance-conferring seizure paradigms (Shinoda et al., 2004b).
We recently developed a model of status epilepticus-induced CA3-dominant hippocampal injury in mice (Shinoda et al., 2004a). Presently, we sought to determine if seizure-preconditioning can generate a tolerant phenotype in this model, and then profile the transcriptome of the target CA3 at the time tolerance had been acquired.
EXPERIMENTAL PROCEDURES
Mouse model of epileptic preconditioning
Animal experiments were carried out in accordance with the National Institutes of Health Guide for the Care and Use of Laboratory Animals and European Communities Council Directive (86/609/EEC) and were reviewed and approved by the Research Ethics Committee of the Royal College of Surgeons in Ireland, under license from the Department of Health, Dublin, Ireland. All efforts were made to minimize the number of animals used and their suffering.
Mice (9–10 weeks old, C57Bl/6 male, between 20 and 25 g) were obtained from Harlan UK Ltd. (Shaw’s Farm, Bicester, Oxon, UK). Seizure preconditioning was produced by i.p. injection of kainic acid (KA) (7.5 or 15 mg/kg in 0.2 mL volume) (Ocean Produce International, Shelburne, Nova Scotia, Canada). Mice were behaviorally observed to verify mild seizure-related behavior had occurred. Control, littermate mice received i.p. injection of saline but were otherwise treated the same.
Induction of focally-evoked limbic status epilepticus by intraamygdala KA
Injurious seizures were produced by intraamygdala KA as previously described with modifications (Araki et al., 2002; Shinoda et al., 2004a). Briefly, 24 h following i.p. injection of KA or saline, mice were anesthetized using isoflurane (3–5%) and maintained normothermic by means of a feedback-controlled heat blanket (Harvard Apparatus, Edenbridge, Kent, UK). A catheter was inserted into the femoral vein for administration of anticonvulsant. Mice were next placed in a stereotaxic frame and following a midline scalp incision three partial craniectomies were performed and mice were affixed with cortical electrodes to record surface electroencephalogram (EEG). Electrodes were placed above dorsal hippocampus and a third across the forebrain area. EEG was recorded using a Grass Comet digital EEG (Medivent Ltd., Lucan, Ireland) with continuous Panorama® digital video. A guide cannula was affixed (coordinates from Bregma: AP=−0.94; L=−2.85 mm) (Franklin and Paxinos, 1997), anesthesia was discontinued and mice were placed in a clear Perspex recording chamber. Video-EEG recordings were commenced and then an injection cannula was lowered 8.7 mm below the dura for injection of KA (1 μg in 0.2 μL volume) into the basolateral amygdala nucleus. Non-seizure control mice received the same volume of intraamygdala vehicle. The duration of high amplitude, high frequency paroxysmal discharges (HAHFDs), which are responsible for damage in this model, was calculated for all groups as previously described (Shinoda et al., 2004a).
Mice were killed 24 h after preconditioning or prolonged seizures by pentobarbital overdose and perfused with saline to remove intravascular blood components. Brains for histology were flash-frozen in 2-methylbutane at −30 °C or microdissected on wet ice for isolation of hippocampal CA3 followed by processing as described below.
Histopathology
Brains were sectioned at 12 μm on a cryostat and stored at −80 °C until further use. Sections at the level of the dorsal hippocampus (−1.7 mm) (Franklin and Paxinos, 1997) were post-fixed (10% formalin), permeabilized, blocked in 5% goat serum and incubated with antibodies against neuronal nuclear protein (NeuN) (Chemicon, Temecula, CA, USA). Sections were washed in phosphate buffer and then incubated in rhodamine-conjugated goat anti-mouse secondary antibodies (Jackson Immunoresearch, Plymouth, PA, USA). Sections were washed again and then processed for detection of double-stranded DNA fragmentation using terminal deoxynucleotidyl dUTP nick end labeling (TUNEL) as previously described (Shinoda et al., 2004b) (Roche Molecular Biochemicals, Indianapolis, IN, USA). Sections were washed again and mounted in 4′,6-diamidino-2-phenylindole (DAPI) –containing medium (Vector Laboratories Ltd., Peterborough, UK) and examined under 60× oil immersion using a Hamamatsu Orca 285 camera attached to a Nikon 2000s epifluorescence microscope (Micro-optica, Ireland) under Ex/Em wavelengths of 330–380/420 nm (blue), 472/520 nm (green) and 540–580/600–660 nm (red). Pseudocolor transforms from monochromatic Hamamatsu Orca 285 images were undertaken using Adobe® Photoshop® 6.0.
Sections were all scored by an observer blinded to experimental treatment. Surviving neurons were counted if retaining normal morphological appearance. Shrunken and condensed NeuN-positive hippocampal neurons were not included. Hippocampal CA3 NeuN and TUNEL counts were the mean of two adjacent sections as previously described (Shinoda et al., 2004a,b).
Hippocampal microdissection
RNA for microarray studies was obtained from the CA3-enriched portion of the hippocampus using a previously described microdissection procedure (Lein et al., 2004). Briefly, under RNase-free conditions the brain was immediately immersed in ice cold RNA later (Ambion Inc., Austin, TX, USA), the cerebellum was dissected away and the two hemispheres were separated. Under a dissecting microscope the hippocampus was separated en bloc from the cortex followed by dissection of the different subfields of the hippocampus. The boundaries between the CA1, DG and CA3 boundary were identified and were separated from each other intact. The CA3-enriched tissue portion was transferred to a tube and immersed in RNA later and place on ice. RNA from both hippocampi from the same control or preconditioned animal was pooled to yield ~5–10 ng RNA. Polymerase chain reaction (PCR) was routinely performed to ensure CA3 samples had minimal contamination of other hippocampal subfields. The marker for the CA3 was Bcl-2-related ovarian killer protein (Bok) mRNA and the marker for non-CA3 contamination was the dentate gyrus-enriched Desmoplakin mRNA (Lein et al., 2004). Primers for both genes were designed following the conditions below.
Extraction of RNA and microarray analysis
Microarray sample preparation and analysis was undertaken as described with modifications (Stenzel-Poore et al., 2003). Total RNA was extracted using Trizol (Invitrogen Corporation, Carlsbad, CA, USA). Samples were sent to the Affymetrix Microarray Core of the Oregon Health & Sciences University Gene Microarray Shared Resource for quality control (Agilent bioanalyzer) and 2 μg was subject to one-round amplification and then labeled target cRNA for nine samples (five control, four preconditioned) was hybridized to Mouse Genome 430 2.0 Genechip arrays which detect over 39,000 transcripts. Image processing and expression analysis were performed using Affymetrix GCOS v1.2 software. Image data from each chip were normalized to an average target intensity of 350. Only genes called present on each chip based on Affymetrix detection P-value for the presence of each gene on each chip were included. Data were normalized to median, log transformed and a threshold for significant regulation was set at 1.8-fold to retain genes exhibiting a biologically meaningful level of regulation, while not excluding certain genes that, because of high constitutive expression may show lower degrees of change. A t-test was then performed to detect regulated genes between control and tolerance and an absolute P value obtained. Further statistical analysis was performed using Benjamini and Hochberg correction (FDR, or false discovery rate) to yield the adjusted P value. Gene ontology and function assignments were performed using Genesifter® (VizX Laboratories, Seattle, WA, USA) and interrogation of Kyoto Encyclopedia of Genes and Genomes (KEGG), AmiGO and GeneCards® in addition to traditional literature review. Z scores, a statistical measure of how over- or underrepresented a particular gene is in relation to the number of overall transcripts present on the chip for that classification were calculated using Genesifter® software.
Validation of microarray results
Principal validation of microarray results was undertaken using real-time quantitative polymerase chain reaction (rtPCR) (see Table 2). Primers were designed using Primer3 software (http://frodo.wi.mit.edu/cgi-bin/primer3_www.cgi) and verified by BLAST (http://www.ncbi.nlm.nih.gov/BLAST/). Two micrograms total RNA from control or preconditioned CA3 was used to generate cDNA by reverse transcription using Superscript II Reverse Transcriptase enzyme (Invitrogen). rtPCR was performed using a LightCycler 1.5 (Roche Diagnostics, Indianapolis, IN, USA) in combination with QuantiTech SYBR Green PCR kit (Qiagen Ltd., Crawley, UK) as per manufacturer’s protocol and 25 pmol of primer pair concentration in 40 μL volume. Data were analyzed using the LightCycler Software 1.5 with all samples normalized to glyceraldehyde-3-phosphate dehydrogenase (GAPDH).
Table 2.
Validation by rtPCR of genes showing differential expression in tolerance compared to control by microarray
| Gene | Primers | Array | rtPCR | Gene | Primers | Array | rtPCR |
|---|---|---|---|---|---|---|---|
| Arid4b | ctgttgagggccacatcttt/gcttgaggaaaagcagttcg | ↑ | ↑ | Top2b | tttacggaaggaatggcttg/gcttctttccacgctttcac | ↑ | n.c. |
| Stard4 | tccctttccttcgtttggtt/tttgatcccttccttcatgc | ↑ | ↑ | Itsn1 | agtgccacatcaccaagaca/gatctctgtccgacccaaaa | ↓ | ↓ |
| Uty | tcaccctcttcagccattc/cctgcacgctttcagaactt | ↑ | ↑ | Bbs4 | accaattcaggcagcaaatc/tcctcggtttttcctgtttg | ↓ | n.c. |
| Kif1a | tgatggggaaacaggagaag/ttgttcttggggttcaggag | ↑ | ↑ | Klf4 | atggtcaagttcccagcaag/tttgtaagtccgggcatgtt | ↓ | n.c. |
| Mapk8ip1 | cctcggcatgaagatgaact/aatccagtcgctgtttttgg | ↑ | n.c. | Rbl2 | caaatgcctggtatcccatc/gaggcaactgggatgaaaaa | ↓ | n.c. |
| Dnm1 | atctgaagctgcgtgatgtg/catcgagtgcatgaagctgt | ↑ | ↑ | Hist2h2be | aagggttccaagaaggctgt/ttgctatgcgctcaaagatg | ↓ | ↓ |
Quantitative rtPCR confirmation on a selection of genes identified by microarray as significantly regulated in preconditioned brain compared to control (n=4 per group). Key: ↑ and ↓ indicate direction of change where significant (P<0.05 versus control) by microarray (array) and rtPCR; n.c. indicates gene expression was not changed compared to control.
Western blotting was used to verify gene changes at a protein level. For this, additional mice were treated with 15 mg/kg KA (i.p., preconditioning) or given vehicle, killed 24 h later and the CA3 subfields microdissected and processed as previously described (Shinoda et al., 2004b). Protein concentration was determined using Bradford reagent spectrophotometrically at A595nm and 20 μg samples were boiled in gel-loading buffer and separated on 6 –10% SDS-PAGE gels. Proteins were transferred to nitrocellulose membranes (BioRad, Hercules, PA, USA) and then incubated with antibodies against kinesin family member 1a (Kif1a) (1/500), intersectin 1 (1/1000) (BD Biosciences, Oxford, UK), topoisomerase IIβ(1/500), and α-tubulin (1/500, Santa Cruz Biotechnology, Santa Cruz, CA, USA). Membranes were then incubated with horseradish peroxidase– conjugated secondary antibodies (1/1000, Molecular Probes, Eugene, OR, USA) followed by chemiluminescence detection (ECL Western Blot Substrates, Pierce, Rockford, IL, USA), and then imaged using Laser 3000 Fujifilm (Fujifilm). Densitometry was performed using Alpha-EaseFC software with correction to α-tubulin.
Data analysis
Data are presented as mean±S.E.M. Histology and EEG data were analyzed using one-way ANOVA with post hoc Fisher’s PLSD test. Levels of gene expression measured by rtPCR were compared using Student’s t-test. Significance was accepted at P<0.05.
RESULTS
Mouse model of epileptic preconditioning
We recently described a model of focally-evoked, short duration limbic status epilepticus in C57Bl/6 mice that featured death of 30–50% of ipsilateral CA3 pyramidal neurons (Shinoda et al., 2004a). Presently, we modified this model, eliciting status epilepticus by intraamygdala injection of 1 μg KA, again terminating after 40 min with i.v. lorazepam. This protocol resulted in a near-complete CA3 lesion, thus maximizing the amount of potentially salvageable CA3 neurons (Figs. 1, 2A, B). Seizure-damaged CA3 neurons at 24 h stained strongly for double-stranded DNA breaks using TUNEL (Fig. 1).
Fig. 1.
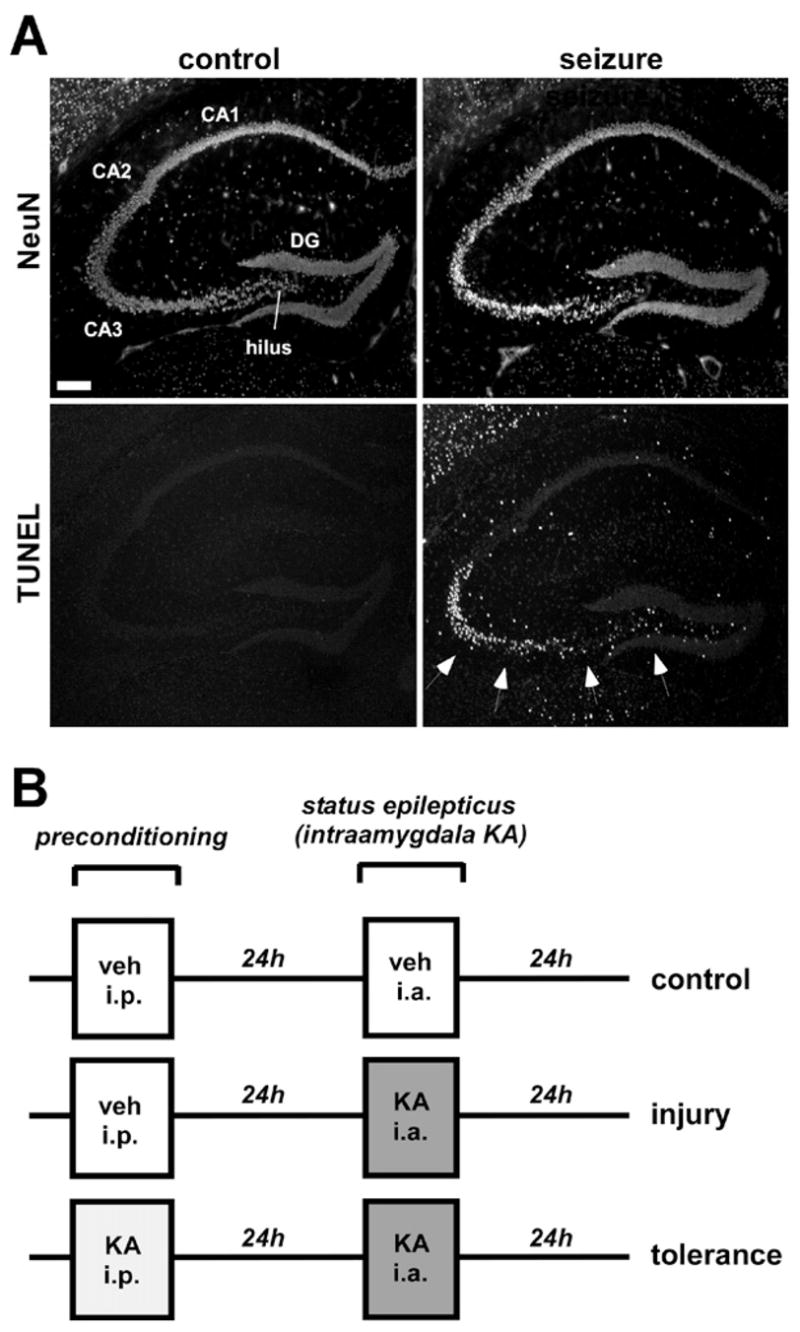
Histopathology of status epilepticus model. (A) Photomicrographs (4× lens) showing field views of (top) NeuN staining and (bottom) TUNEL staining of representative sections of dorsal hippocampus from (left) a control mouse and (right) a mouse 24 h following seizures induced by intraamygdala KA. Arrows depict prominent TUNEL staining within the CA3 region while other hippocampal fields are mainly spared. Scale bar=300 μm. (B) Diagram depicting dosing regimen for tolerance paradigm in which mice receive i.p. vehicle (veh) or KA, followed after 24 h by intraamygdala vehicle, or intraamygdala KA for inducing status epilepticus.
Fig. 2.

Epileptic preconditioning reduces hippocampal injury following status epilepticus (SE). Graphs depicting (A) surviving neuron (NeuN) counts and (B) TUNEL counts, 24 h following SE in mice with or without epileptic preconditioning (PC) (n=5–8 per group). Non-seizure control mice (white bar) received intraamygdala vehicle (veh). Values on x axis depict dose of i.p. KA in mg/kg. *** P<0.0001, ** P<0.01 compared with non-seizure controls. (C) Representative fluorescence photomicrographs (40× lens) of TUNEL and NeuN immunostaining from (top) control mouse, (middle) a non-preconditioned mouse 24 h following SE and (bottom) a mouse preconditioned prior to SE.
Next, we investigated whether we could modify the extent of neuronal death by epileptic preconditioning. The stimulus we chose was low-grade seizures induced by systemic KA, injected 24 h before induction of status epilepticus. A diagram of the dosing regimen for the tolerance paradigm is provided in Fig. 1B. Doses tested were 7.5 and 15 mg/kg KA (i.p.) which were sub-threshold for strong convulsive activity or mortality (detected at ≥20 mg/kg) and resulted in no permanent hippocampal damage as assessed by both NeuN and TUNEL staining (data not shown). Twenty-four hours after preconditioning, mice underwent status epilepticus induced by intraamygdala KA, terminated after 40 min by i.v. lorazepam.
Non-preconditioned seizure mice exhibited a characteristic lesion involving death of ~90% ipsilateral CA3 neurons by 24 h (Fig. 2A–C). Preconditioning with 7.5 mg/kg i.p. KA did not significantly alter hippocampal CA3 damage resulting from intraamygdala KA-induced focal limbic status epilepticus 24 h later (Fig. 2A, B). In contrast, hippocampal injury was significantly reduced in mice given 15 mg/kg KA (i.p.) preconditioning 24 h before intraamygdala KA-evoked status epilepticus (Fig. 2A–C). Surviving neuron numbers were increased by >fivefold compared with non-preconditioned seizure mice, to ~50% of numbers in non-seizure, vehicle control mice. Preconditioning reduced status epilepticus–mediated TUNEL by ~50% (Fig. 2A–C).
Epileptic preconditioning does not alter polyspike seizure cortical EEG during status epilepticus
Hippocampal damage in our mouse model is associated with the occurrence and duration of HAHFDs (Fig. 3A), also termed type i.v. EEG (Shinoda et al., 2004a). Damage is seen only in conjunction with such electrographic events. Accordingly, we quantified the duration of seizure EEG for non-preconditioned and preconditioned mice during status epilepticus. The mean duration of HAHFDs recorded in non-preconditioned mice between the time of KA injection and lorazepam administration was 8±5 min and was not different in mice given epileptic preconditioning (Fig. 3B).
Fig. 3.
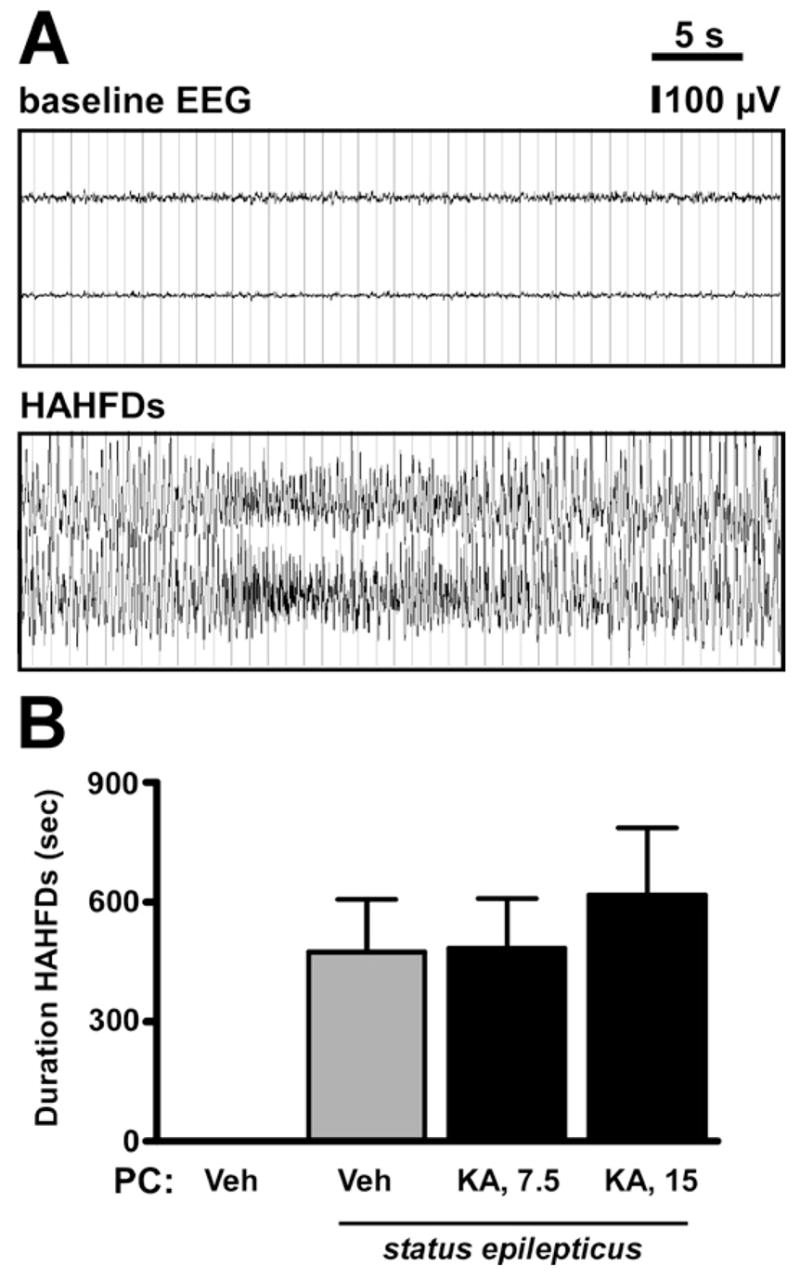
Effect of preconditioning on EEG during status epilepticus. (A) Representative traces showing (top) baseline EEG and (bottom) HAHFDs during status epilepticus induced by intraamygdala KA. (B) Graph showing durations of HAHFDs during status epilepticus in mice with or without preconditioning 24 h previous. Note, preconditioning did not significantly affect seizure duration during subsequent status epilepticus.
Transcriptome of epileptic preconditioning
To define the transcriptional profile of the target hippocampal CA3 subfield at the time that tolerance had been acquired after epileptic preconditioning we undertook microarray analyses using Affymetrix 430 2.0 arrays on RNA from microdissected CA3 subfields of control (n=5) and KA-preconditioned (n=4) mice at 24 h. PCR confirmed microdissected CA3 subfields were enriched for the CA3-specific gene Bok, relative to the dentate gyrus-enriched gene desmoplakin (Dsp) (Lein et al., 2004) (Fig. 4A, B).
Fig. 4.
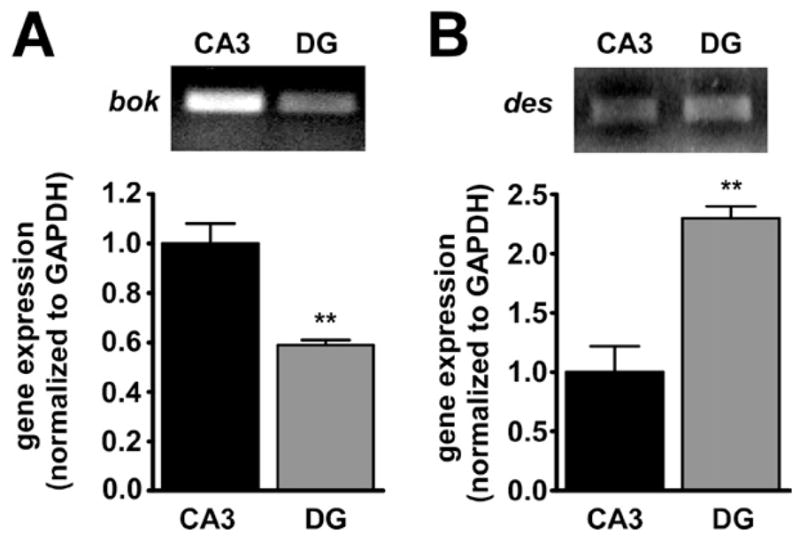
Verification of hippocampal microdissection. (A) Graph and corresponding representative PCR gel showing levels of the CA3-specific gene Bok (normalized to GAPDH) are significantly higher in CA3-enriched samples compared with a sample from microdissected dentate gyrus (DG) (n=1 per lane). (B) Graph and corresponding representative PCR gel showing levels of the dentate gyrus-specific gene desmoplakin (des) (normalized to GAPDH) are significantly higher in DG-enriched samples compared with a sample from microdissected CA3 (n=1 per lane). Graph data are from n=3 individual animals per group. ** P<0.01 compared with CA3.
Microarray analyses showed that of the ~39,000 transcripts interrogated, 37 were upregulated by 1.8-fold in preconditioned brain compared with control, and 26 were down-regulated (t-test, P<0.05). Benjamini and Hochberg correction for multiple comparisons yielded adjusted P values, resulting in a final list of 20 differentially regulated genes in preconditioned CA3 compared with control (Table 1).
Table 1.
a. Genes upregulated in CA3 following epileptic preconditioning at the time tolerance is acquired
| Change | Adjusted P | Identifier | Gene description | Functions/ontology |
|---|---|---|---|---|
| ↑2.16 | 0.049 | BE286482 | AT rich interactive domain 4B (Rbp1 like) | Chromatin assembly/disassembly |
| ↑2.06 | 0.049 | BB246854 | StAR-related lipid transfer domain containing 4 | Lipid/cholesterol synthesis and transport. ER stress responder |
| ↑2.04 | 0.049 | AW107303 | Ubiquitin specific peptidase 9, X chromosome | Post-translational modifications Ubiquitin cycle, catabolism |
| ↑2.02 | 0.027 | NM_009484 | Ubiquitously transcribed tetratricopeptide repeat gene, Y chromosome | Transport (small molecule) |
| ↑1.99 | 0.035 | AW543761 | Tetratricopeptide repeat domain 7B | Protein binding |
| ↑1.97 | 0.043 | NM_008440 | Kinesin family member 1A | Microtubule-based movement, motor protein, nucleotide binding |
| ↑1.88 | 0.027 | BI730484 | RIKEN cDNA 6330563C09 gene | unknown |
| ↑1.86 | 0.049 | AF109769 | Mitogen activated protein kinase 8 interacting protein 1 | Regulation of JNK signalling Anti-apoptotic |
| ↑1.84 | 0.037 | L29457 | Dynamin 1 | Endocytosis, binding, motor function |
| ↑1.83 | 0.027 | BB732892 | Topoisomerase (DNA) II beta | DNA topological change, axonogenesis, neuron migration |
| b. Genes downregulated in CA3 following epileptic preconditioning at the time tolerance is acquired | ||||
|
| ||||
| Change | Adjusted P | Identifier | Gene description | Functions/ontology |
|
| ||||
| ↓1.83 | 0.045 | BB667233 | Histone 2, H2be | Chromosome organization and biogenesis |
| ↓1.87 | 0.027 | NM_023118 | Disabled homolog 2 (Drosophila) | Tumor suppressor |
| ↓1.92 | 0.027 | AA138720 | Retinoblastoma-like 2 | Regulation of transcription Negative progression through cell cycle |
| ↓1.95 | 0.037 | BB698742 | Microtubule-associated protein 9 | Cell cycle, division/mitosis |
| ↓1.97 | 0.027 | U20344 | Kruppel-like factor 4 | [Negative] regulation of transcription DNA damage-induced, p53 pathway |
| ↓1.98 | 0.027 | C86773 | Bardet-Biedl syndrome 4 homolog | Dendritic structure, microtubule cytoskeleton organization and biogenesis |
| ↓2.10 | 0.049 | AW107924 | Ubiquitin specific peptidase 14 | Post-translational modifications Ubiquitin cycle, catabolism |
| ↓2.18 | 0.049 | BB426699 | RIKEN cDNA 2900052N01 gene | Unknown |
| ↓2.24 | 0.049 | BM248471 | Intersectin 1 (SH3 domain protein 1A) | Endocytosis, signal transduction (Rho) |
| ↓2.27 | 0.027 | BC019664 | RIKEN cDNA 2310016C16 | Oxidative stress response |
↑ =Increased expression (fold), ↓ =decreased expression (fold). Table showing genes regulated≥1.8 fold versus control. Adjusted P, obtained following Benjamini and Hochberg correction.
Microarray data ontology: biological function, cellular compartment and molecular function
Fig. 5 shows a breakdown of the 20 regulated genes according to biological processes, cellular compartment and molecular function using Genesifter®. Note, in some cases individual genes were represented more than once within each category. For biological processes, the largest proportion of genes fell into cell and physiological processes which include metabolism, with roughly equal distribution of up- and down-regulated genes (Fig. 5A). However, Z scores, a measure of the degree to which genes are over- or underrepresented were highest for the biological function of localization. Additional biological processes represented by regulated genes included apoptosis/cell cycle and transport.
Fig. 5.

Ontology of regulated genes in preconditioned hippocampal CA3. Graphs representing gene numbers and direction of expression change grouped according to (A) biological function, (B) cell compartment of their primary function and (C) molecular function. Ontology assignments were through Genesifter® software and KEGG, AmiGO and GeneCards®. Note, individual genes may be present in more than one category for each graph.
Analyses of genes according to the compartment or component of the cell in which they function revealed the largest number of genes were associated with the nucleus (Fig. 5B). This was also supported by the highest z score for genes involved in nuclear activities (chromatin). Numbers of up- and down-regulated genes associated with the membrane/cell surface were equal (Fig. 5B). High Z scores were also found for upregulated genes associated with the axon and microtubule and mitochondria, while numbers were equivalent for those genes associated with the cytoplasm.
Finally, analysis of the gene’s molecular function revealed several interesting differences (Fig. 5C). Genes involved in binding, for example nucleic acid, nucleotide and protein, comprised 50% of regulated genes, with the proportion upregulated more represented than downregulated. Genes involved in motor, signal transduction and transporter activity were only upregulated, while functions including antioxidant, enzyme regulation and transcriptional regulation were only downregulated. Z scores were highest for genes involved in motor and antioxidant functions. More genes were upregulated than downregulated in the category of catalytic activity. Additional molecular functions including chemo-attractant, -repellent activity were not represented (data not shown).
Validation of microarray results
We next undertook quantitative rtPCR validation using the original samples from the microarray experiments on a subset of the regulated genes (Table 2). Of seven genes shown by microarray to be upregulated by preconditioning, five also showed significant increases by rtPCR. Two genes failed to show the predicted raised levels by rtPCR. Of five genes tested shown by microarray to be downregulated, two also showed downregulation by rtPCR while three showed levels similar to control by rtPCR.
Further post hoc validation was undertaken by Western blotting on control and preconditioned tissue at 24 h. Expression of Kif1a (200 kD) which showed upregulation on both microarray and by rtPCR was significantly increased in preconditioned CA3 (Fig. 6A). Expression of topoisomerase IIβ which only showed upregulation on microarray was also upregulated at a protein level (Fig. 6B). Protein levels of intersectin 1, a gene showing downregulation on both microarray and rtPCR, only showed a non-significant trend to lower expression in preconditioned tissue (data not shown).
Fig. 6.

Validation of Kif1a and Topoisomerase IIβ (TopoIIβ) changes by Western blotting. Representative Western blots (n=1 per lane) and graph showing increased protein levels of (A) Kif1a and (B) TopoIIβ in CA3 samples subject to epileptic PC. * P<0.05 versus control (Con) (n=3 per group).
DISCUSSION
In the present study we report that a mild seizure event 24 h before an episode of status epilepticus functions to precondition and render mouse brain powerfully refractory to subsequent seizure damage. Microarray profiling of the target region of the hippocampus in which protection is found reveals regulation of genes involved in post-translational modification, transport, cell cycle control and apoptosis, most of which have not previously been associated with seizures or tolerance. Together, these data provide insight into the molecular phenotype of epileptic preconditioning and identify novel targets for strategies aimed at neuroprotection in the setting of seizure-induced neuronal death.
Since prolonged single seizures or repetitive seizures occurring over time may cause damage to brain there is significant interest in understanding mechanisms by which brain may be protected against the harmful effects of seizures (Meldrum, 2002; Pitkanen, 2002). The molecular processes underlying preconditioning, whereby brain exposed to an insult subthreshold for harm becomes refractory against damage by a subsequent prolonged stimulus, constitute potent endogenous programs that are a source of novel neuroprotective genes (Dirnagl et al., 2003; Stenzel-Poore et al., 2007). Such approaches have largely been employed in the setting of cerebral ischemia but tolerance against damaging seizures has previously been shown to be triggered by briefer, non-harmful seizures. The approach used here, in which a systemic convulsant is used to precondition against subsequent focally-evoked status epilepticus has recently been employed in rats (Borges et al., 2007) and was remarkably effective presently in mice. This extends evidence from other approaches that seizures at doses sub-threshold for damage can confer protection against a subsequent prolonged and otherwise harmful episode of status epilepticus (Sasahira et al., 1995; Najm et al., 1998; El Bahh et al., 2001; Kondratyev et al., 2001; Borges et al., 2007). Moreover, they confirm epileptic preconditioning is not unique to either the methodology for induction or the secondary damaging seizure paradigm. The degree of neuroprotection seen in our model (~50%) falls within ranges reported previously by epileptic preconditioning in other models (El Bahh et al., 2001) while being superior to others (Sasahira et al., 1995; Najm et al., 1998). However, even greater protection may be achievable using multiple preconditioning events (Borges et al., 2007) or by fine-tuning the severity of preconditioning seizure or time-interval regimen.
The optimal time interval between challenge and insult in ischemic tolerance models is typically 3 days (Chen et al., 1996; Stenzel-Poore et al., 2003). During model development we found mortality rates increase significantly when the interval between priming event and harmful seizure is extended to 72 h (S.H., unpublished observations). Thus, seizures precondition brain more rapidly than ischemia, but the window of therapeutic efficacy appears shorter, which in ischemia can last 3–4 days (Chen et al., 1996; Stenzel-Poore et al., 2003). Other strengths of the present model include the simplicity of the preconditioning stimulus, its application to C57Bl/6 strain and the convenience of the 24 h time window between preconditioning stimuli and harmful seizure challenge.
The main hippocampal subfields display a remarkable degree of cell and molecular heterogeneity (Lein et al., 2004). Here we minimized the influence of subfield-specific vulnerability and their cell and molecular substrates by analyzing only samples enriched for the seizure-damage target CA3. This microdissection approach, while not as accurate as laser capture, offers a rapid means for obtaining a significant quantity of relatively uniform CA3 subfields and has been used in other epilepsy-related microarray studies (Gorter et al., 2006; Borges et al., 2007). The approach offers improvements over obtaining RNA from the entire hippocampus which risks diluting genes influencing regional vulnerability or resistance (Lukasiuk et al., 2003; Newton et al., 2003; Hunsberger et al., 2005). Nevertheless, other hippocampal regions exhibit altered transcriptional profiles in response to seizures capable of inducing tolerance and could potentially contribute to the damage-refractory phenotype of the seizure-preconditioned hippocampus (French et al., 2001; Newton et al., 2003; Borges et al., 2007).
Our microarray analysis of over 39,000 transcripts is the most comprehensive set thus far interrogated in an in vivo seizure model. Previously, seizure model microarray studies have interrogated ~5000 genes (Lukasiuk et al., 2003), 8000 (Elliott et al., 2003) and most recently ~15,000 genes (Gorter et al., 2006). However, rigorous statistical testing and corrections for multiple comparisons in the present study left a surprisingly small set of regulated genes after preconditioning. Nevertheless, Borges et al. (2007) reported quite similar numbers in seizure-preconditioned CA3 in rats. However, relaxation of this stringent approach to microarray data analysis may also be warranted (French et al., 2001; Lukasiuk et al., 2003; Ploski et al., 2006).
Our microarray analyses revealed several biological processes occurring in concert in the tolerant state. At a global level, transcriptional changes were equally balanced between up- and down-regulation, which differs somewhat from the tendency to increased expression in rats given similar epileptic preconditioning (Borges et al., 2007) but in agreement with the pattern after ischemic preconditioning alone (Stenzel-Poore et al., 2003). Gene down-regulation is only the predominant phenotype when preconditioned brain is later subject to prolonged or damaging insult (Stenzel-Poore et al., 2003). However, several genes involved in transcription were downregulated in our dataset, including Kruppel-like factor 4 and retinoblastoma-like 2. Other genes involved in nuclear activities such as cell cycle control and chromatin structure were also represented (topoisomerase IIβ, AT rich interactive domain 4B). However, ontology analysis revealed genes involved in motor, transport/microtubule and localization activity were particularly disproportionately represented, as assessed by z score reports. This might reflect a preconditioning-induced preparatory response in affected cells that might be important for the damage-refractory phenotype. For example, changes to neuronal shape, dendrite branching and trafficking of materials (e.g. neurotransmitter receptors) all have significant relevance in neuronal tolerance (Park et al., 1996; Hasbani et al., 2001; Magarinos et al., 2006).
Significantly, the genes we detected as regulated in preconditioned brain have not previously been reported in other models of non-damaging or preconditioning seizures (French et al., 2001; Newton et al., 2003; Ploski et al., 2006; Borges et al., 2007). The explanation for the lack of specific commonalities likely results from statistical approaches, subfield specific analysis and the very large gene sets interrogated. However, several genes with similar functions or within the same pathway or gene family as previous microarray seizure studies were altered, with some changes consistent with a neuroprotective phenotype. Preconditioning seizures downregulated histone cluster 2, H2be, a member of the multigene replication-dependent histone family and KA seizures have previously been shown to regulate histone deacetylase 2 (HDAC2) (Hunsberger et al., 2005). Preconditioning also downregulated retinoblastoma-like 2 (p130), although effects of this may run counter to the tolerant phenotype since transgenic mice in which this and related genes are conditionally inactivated can display seizures (McLear et al., 2006). Downregulation of kinesin family 3a (Kif3a) was detected by microarray analysis of mouse brain during epileptogenesis (Lahteinen et al., 2004) which contrasts with our detection of increased Kif1a in seizure-preconditioned brain. Our detection of upregulated mitogen-activated protein kinase 8 interacting protein (Mapk8ip1) in tolerant brain by microarray, although not validated post hoc, is in line with the observation that mice underexpressing this gene are more vulnerable to seizure damage (Magara et al., 2003). Last, while genes regulated by preconditioning here have not been highlighted in studies on antiepileptic or anticonvulsant drugs, there is some homology to ketogenic diet effects (Bough et al., 2006). Microarray analyses of hippocampus from rats on a seizure-suppressive ketogenic diet detected upregulation of dynamin 1 (Bough et al., 2006). Expressional changes were also found for tetratricopeptide repeat domain 11, AT rich interactive domain 1A, Bardet-Biedl syndrome 4, kinesin family members and microtubule-associated proteins; genes with homology to those regulated by preconditioning.
We recently showed pro-apoptotic Bim is degraded in ischemia-preconditioned brain via the ubiquitin–proteosome system (Meller et al., 2006) suggesting protein degradation may be critical for tolerance-mediated neuroprotection. Two genes related to ubiquitin metabolism were altered in brain subject to epileptic preconditioning suggesting that, as in ischemia, the system for degrading cell death-regulatory proteins may be integral to the damage-refractory state. Upregulation of ubiquitin specific peptidase 9, X chromosome may be particularly relevant because this CA3-enriched gene has been implicated in synapse plasticity (Xu et al., 2005). Moreover, alterations to proteosome-related genes have been reported during epileptogenesis (Gorter et al., 2006) and epileptic preconditioning in rats also regulated ubiquitin pathway genes in CA3 (Borges et al., 2007). Comparison of genes regulated by epileptic preconditioning here to ischemic preconditioning also shows apparent similarities, where modulation of ubiquitin and histone H2b were found (Stenzel-Poore et al., 2003). Thus, our data set provides novel targets, the functions of which are supportive of contributing to a damage-refractory state that might be examined further to elucidate novel substrates for neuroprotection.
Several regulated genes detected presently would not intuitively have been selected for potential involvement in tolerance, highlighting the utility of the microarray approach. StAR-related lipid transfer domain containing 4 (Stard4) is a little understood gene involved in the transport of sterols and lipids and was one of the most upregulated genes by preconditioning. Recently, Stard4 has been shown to be an early-phase endoplasmic reticulum stress-activated gene (Yamada et al., 2006) and endoplasmic reticulum stress appears to be a consequence of seizures and epilepsy (Kitao et al., 2001; Yamamoto et al., 2006; Sokka et al., 2007). Accordingly, induction of this gene may confer effects that enable brain to withstand more prolonged stress than in the non-preconditioned brain.
Apoptosis-regulatory genes were represented in seizure preconditioning and this occurred in a predictable manner. That is, microarrays reported increased expression of anti-apoptotic Mapk8ip, a negative regulator of the c-Jun N-terminal kinase signaling pathway and decreased levels of Dab2, a mitogen responsive phosphoprotein with tumor suppressor activity (He et al., 2001). Kruppel-like factor 4, a gene linked to p53 and tumor-suppressor activity was also downregulated (Rowland et al., 2005) as was retinoblastoma-like 2 which has tumor suppressor– and cell cycle–associated functions (Classon and Harlow, 2002). While Dab2 has not been linked to seizure injury, Mapk8ip is upregulated by seizures in damage-resistant dentate gyrus (Becker et al., 1999). Regulation of apoptosis-associated genes might in fact have been predicted to be more prominent after epileptic preconditioning. However, microarray studies in ischemia models suggest this is not the case, with changes to metabolism, transport and defense being dominant (Stenzel-Poore et al., 2007).
Some limitations should be considered in relation to the present model and microarray findings. Our statistical approach was conservative and used a fold change cutoff so it is likely some genes of significance would have been excluded by our analysis. Setting a fold change risks excluding genes with high constitutive mRNA levels where fold level changes may be small despite potentially significant changes to mRNA copy number. Other limitations of microarray technology have been reviewed elsewhere (Lockhart and Barlow, 2001). Gene ontology databases such as those interrogated presently undergo updates and revisions and some assignments made here may later be revised. Further, some sub-classifications of functions were not included in our ontological analysis for purposes of conciseness. While we focused our analysis on CA3, gene expression changes in other subfields may exert important effects in such models (Borges et al., 2007). We also chose to elicit a larger CA3 lesion than used previously in our focal status epilepticus mouse model by using a higher KA dose. This provided a potentially greater “salvageable” tissue area, however it remains a possibility that due to the protracted nature of cell death pathways (Pitkanen et al., 2002; Narkilahti et al., 2003) the salvaged areas could lose addition neurons over the subsequent weeks. Validation of microarray hits by alternate methods is important for gauging false positive rates. In the present study we principally used rtPCR and found good agreement between microarray results and rtPCR. Indeed, none of the genes showing regulation by microarray showed regulation in an opposite direction by rtPCR although a small number failed to show significant changes by rtPCR that had been indicated by microarray. The significance of microarray-identified genes regulated by preconditioning not validated by rtPCR should be viewed with caution. This level of agreement between the techniques compares well to other epilepsy and tolerance microarray studies (Stenzel-Poore et al., 2003; Hunsberger et al., 2005; Jamali et al., 2006). It also underlines the need for validation of a subset of genes or genes upon which future research may be directed, which was not undertaken in a recent study on epileptic preconditioning (Borges et al., 2007). Our immunoblotting experiments confirmed that two of the upregulated genes were also associated with a predicted increase in protein level. Finally, we would anticipate finding a quite different set of regulated genes if we analyzed preconditioned brain after it was subject to damaging status epilepticus (Stenzel-Poore et al., 2003). Such experiments are now under way in our laboratory.
CONCLUSION
In conclusion, we have characterized a mouse model of epileptic preconditioning that renders hippocampal CA3 refractory to damage induced by focally-evoked limbic status epilepticus. The transcriptional profile of this brain region at the time tolerance had been acquired yielded an essentially unique dataset, although we find commonalities in the directional changes and the biological processes affected to other tolerance paradigms, but not the specific genes. These data provide a novel dataset from which to better understand the molecular mechanisms underlying the preconditioning and also novel neuroprotective targets may be obtained.
Acknowledgments
This research was supported by Science Foundation Ireland grant 04/IN3/B466 and NIH grant NS46290. Microarray assays were performed in the Affymetrix Microarray Core of the Oregon Health & Science University Gene Microarray Shared Resource. The authors thank Michael Winther, Kristina Vartanian and Chris Harrington for their technical support and Mary Stenzel-Poore and Susan Stevens for useful advice in study design and data analysis.
Abbreviations
- Bok
Bcl-2-related ovarian killer protein
- EEG
electroencephalogram
- GAPDH
glyceraldehyde-3-phosphate dehydrogenase
- HAHFDs
high amplitude high frequency discharges
- KA
kainic acid
- KEGG
Kyoto Encyclopedia of Genes and Genomes
- Kif1a
kinesin family member 1A
- Mapk8ip
mitogen-activated protein kinase 8 interacting protein
- NeuN
neuronal nuclear protein (neuron-specific nuclear protein)
- PCR
polymerase chain reaction
- rtPCR
real-time quantitative polymerase chain reaction
- Stard4
StAR-related lipid transfer (START) domain containing 4
- TUNEL
terminal deoxynucleotidyl dUTP nick end labeling
References
- Araki T, Simon RP, Taki W, Lan J-Q, Henshall DC. Characterization of neuronal death induced by focally evoked limbic seizures in the C57BL/6 mouse. J Neurosci Res. 2002;69:614–621. doi: 10.1002/jnr.10356. [DOI] [PubMed] [Google Scholar]
- Becker AJ, Gillardon F, Blumcke I, Langendorfer D, Beck H, Wiestler OD. Differential regulation of apoptosis-related genes in resistant and vulnerable subfields of the rat epileptic hippocampus. Brain Res Mol Brain Res. 1999;67:172–176. doi: 10.1016/s0169-328x(99)00060-1. [DOI] [PubMed] [Google Scholar]
- Borges K, Shaw R, Dingledine R. Gene expression changes after seizure preconditioning in the three major hippocampal cell layers. Neurobiol Dis. 2007;26:66–77. doi: 10.1016/j.nbd.2006.12.001. [DOI] [PMC free article] [PubMed] [Google Scholar]
- Bough KJ, Wetherington J, Hassel B, Pare JF, Gawryluk JW, Greene JG, Shaw R, Smith Y, Geiger JD, Dingledine RJ. Mitochondrial biogenesis in the anticonvulsant mechanism of the ketogenic diet. Ann Neurol. 2006;60:223–235. doi: 10.1002/ana.20899. [DOI] [PubMed] [Google Scholar]
- Chen J, Graham SH, Zhu RL, Simon RP. Stress proteins and tolerance to focal cerebral ischemia. J Cereb Blood Flow Metab. 1996;16:566–577. doi: 10.1097/00004647-199607000-00006. [DOI] [PubMed] [Google Scholar]
- Chen J, Simon R. Ischemic tolerance in the brain. Neurology. 1997;48:306–311. doi: 10.1212/wnl.48.2.306. [DOI] [PubMed] [Google Scholar]
- Classon M, Harlow E. The retinoblastoma tumour suppressor in development and cancer. Nat Rev Cancer. 2002;2:910–917. doi: 10.1038/nrc950. [DOI] [PubMed] [Google Scholar]
- Dirnagl U, Simon RP, Hallenbeck JM. Ischemic tolerance and endogenous neuroprotection. Trends Neurosci. 2003;26:248–254. doi: 10.1016/S0166-2236(03)00071-7. [DOI] [PubMed] [Google Scholar]
- El Bahh B, Auvergne R, Lere C, Brana C, Le Gal La Salle G, Rougier A. Decreased epileptic susceptibility correlates with neuropeptide Y overexpression in a model of tolerance to excitotoxicity. Brain Res. 2001;894:209–217. doi: 10.1016/s0006-8993(01)02027-3. [DOI] [PubMed] [Google Scholar]
- Elliott RC, Miles MF, Lowenstein DH. Overlapping microarray profiles of dentate gyrus gene expression during development- and epilepsy-associated neurogenesis and axon outgrowth. J Neurosci. 2003;23:2218–2227. doi: 10.1523/JNEUROSCI.23-06-02218.2003. [DOI] [PMC free article] [PubMed] [Google Scholar]
- Franklin KBJ, Paxinos P. The mouse brain in stereotaxic coordinates. San Diego: Academic Press, Inc; 1997. [Google Scholar]
- French PJ, O’Connor V, Voss K, Stean T, Hunt SP, Bliss TV. Seizure-induced gene expression in area CA1 of the mouse hippocampus. Eur J Neurosci. 2001;14:2037–2041. doi: 10.1046/j.0953-816x.2001.01818.x. [DOI] [PubMed] [Google Scholar]
- Frerichs KU, Kennedy C, Sokoloff L, Hallenbeck JM. Local cerebral blood flow during hibernation, a model of natural tolerance to “cerebral ischemia. J Cereb Blood Flow Metab. 1994;14:193–205. doi: 10.1038/jcbfm.1994.26. [DOI] [PubMed] [Google Scholar]
- Gidday JM. Cerebral preconditioning and ischaemic tolerance. Nat Rev Neurosci. 2006;7:437–448. doi: 10.1038/nrn1927. [DOI] [PubMed] [Google Scholar]
- Gorter JA, van Vliet EA, Aronica E, Breit T, Rauwerda H, Lopes da Silva FH, Wadman WJ. Potential new antiepileptogenic targets indicated by microarray analysis in a rat model for temporal lobe epilepsy. J Neurosci. 2006;26:11083–11110. doi: 10.1523/JNEUROSCI.2766-06.2006. [DOI] [PMC free article] [PubMed] [Google Scholar]
- Hasbani MJ, Schlief ML, Fisher DA, Goldberg MP. Dendritic spines lost during glutamate receptor activation reemerge at original sites of synaptic contact. J Neurosci. 2001;21:2393–2403. doi: 10.1523/JNEUROSCI.21-07-02393.2001. [DOI] [PMC free article] [PubMed] [Google Scholar]
- He J, Smith ER, Xu XX. Disabled-2 exerts its tumor suppressor activity by uncoupling c-Fos expression and MAP kinase activation. J Biol Chem. 2001;276:26814–26818. doi: 10.1074/jbc.M101820200. [DOI] [PubMed] [Google Scholar]
- Hunsberger JG, Bennett AH, Selvanayagam E, Duman RS, Newton SS. Gene profiling the response to kainic acid induced seizures. Brain Res Mol Brain Res. 2005;141:95–112. doi: 10.1016/j.molbrainres.2005.08.005. [DOI] [PubMed] [Google Scholar]
- Jamali S, Bartolomei F, Robaglia-Schlupp A, Massacrier A, Peragut JC, Regis J, Dufour H, Ravid R, Roll P, Pereira S, Royer B, Roeckel-Trevisiol N, Fontaine M, Guye M, Boucraut J, Chauvel P, Cau P, Szepetowski P. Large-scale expression study of human mesial temporal lobe epilepsy: evidence for dysregulation of the neurotransmission and complement systems in the entorhinal cortex. Brain. 2006;129:625–641. doi: 10.1093/brain/awl001. [DOI] [PubMed] [Google Scholar]
- Kitagawa K, Matsumoto M, Kuwabara K, Tagaya M, Ohtsuki T, Hata R, Ueda H, Handa N, Kimura K, Kamada T. ‘Ischemic tolerance’ phenomenon detected in various brain regions. Brain Res. 1991;561:203–211. doi: 10.1016/0006-8993(91)91596-s. [DOI] [PubMed] [Google Scholar]
- Kitao Y, Ozawa K, Miyazaki M, Tamatani M, Kobayashi T, Yanagi H, Okabe M, Ikawa M, Yamashima T, Stern DM, Hori O, Ogawa S. Expression of the endoplasmic reticulum molecular chaperone (ORP150) rescues hippocampal neurons from glutamate toxicity. J Clin Invest. 2001;108:1439–1450. doi: 10.1172/JCI12978. [DOI] [PMC free article] [PubMed] [Google Scholar]
- Kondratyev A, Sahibzada N, Gale K. Electroconvulsive shock exposure prevents neuronal apoptosis after kainic acid-evoked status epilepticus. Brain Res Mol Brain Res. 2001;91:1–13. doi: 10.1016/s0169-328x(01)00099-7. [DOI] [PubMed] [Google Scholar]
- Lahteinen S, Pitkanen A, Knuuttila J, Toronen P, Castren E. Brain-derived neurotrophic factor signaling modifies hippocampal gene expression during epileptogenesis in transgenic mice. Eur J Neurosci. 2004;19:3245–3254. doi: 10.1111/j.0953-816X.2004.03440.x. [DOI] [PubMed] [Google Scholar]
- Lee YJ, Hallenbeck JM. Insights into cytoprotection from ground squirrel hibernation, a natural model of tolerance to profound brain oligaemia. Biochem Soc Trans. 2006;34:1295–1298. doi: 10.1042/BST0341295. [DOI] [PMC free article] [PubMed] [Google Scholar]
- Lein ES, Zhao X, Gage FH. Defining a molecular atlas of the hippocampus using DNA microarrays and high-throughput in situ hybridization. J Neurosci. 2004;24:3879–3889. doi: 10.1523/JNEUROSCI.4710-03.2004. [DOI] [PMC free article] [PubMed] [Google Scholar]
- Lockhart DJ, Barlow C. Expressing what’s on your mind: DNA arrays and the brain. Nat Rev Neurosci. 2001;2:63–68. doi: 10.1038/35049070. [DOI] [PubMed] [Google Scholar]
- Lukasiuk K, Kontula L, Pitkanen A. cDNA profiling of epileptogenesis in the rat brain. Eur J Neurosci. 2003;17:271–279. doi: 10.1046/j.1460-9568.2003.02461.x. [DOI] [PubMed] [Google Scholar]
- Magara F, Haefliger JA, Thompson N, Riederer B, Welker E, Nicod P, Waeber G. Increased vulnerability to kainic acid-induced epileptic seizures in mice underexpressing the scaffold protein islet-brain 1/JIP-1. Eur J Neurosci. 2003;17:2602–2610. doi: 10.1046/j.1460-9568.2003.02701.x. [DOI] [PubMed] [Google Scholar]
- Magarinos AM, McEwen BS, Saboureau M, Pevet P. Rapid and reversible changes in intrahippocampal connectivity during the course of hibernation in European hamsters. Proc Natl Acad Sci U S A. 2006;103:18775–18780. doi: 10.1073/pnas.0608785103. [DOI] [PMC free article] [PubMed] [Google Scholar]
- McLear JA, Garcia-Fresco G, Bhat MA, Van Dyke TA. In vivo inactivation of pRb, p107 and p130 in murine neuroprogenitor cells leads to major CNS developmental defects and high seizure rates. Mol Cell Neurosci. 2006;33:260–273. doi: 10.1016/j.mcn.2006.07.012. [DOI] [PubMed] [Google Scholar]
- Meldrum BS. Implications for neuroprotective treatments. Prog Brain Res. 2002;135:487–495. doi: 10.1016/S0079-6123(02)35046-5. [DOI] [PubMed] [Google Scholar]
- Meller R, Cameron JA, Torrey DJ, Clayton CE, Ordonez AN, Henshall DC, Minami M, Schindler CK, Saugstad JA, Simon RP. Rapid degradation of Bim by the ubiquitin-proteasome pathway mediates short-term ischemic tolerance in cultured neurons. J Biol Chem. 2006;281:7429–7436. doi: 10.1074/jbc.M512138200. [DOI] [PMC free article] [PubMed] [Google Scholar]
- Najm IM, Hadam J, Ckakraverty D, Mikuni N, Penrod C, Sopa C, Markarian G, Luders HO, Babb T, Baudry M. A short episode of seizure activity protects from status epilepticus-induced neuronal damage in rat brain. Brain Res. 1998;810:72–75. doi: 10.1016/s0006-8993(98)00886-5. [DOI] [PubMed] [Google Scholar]
- Narkilahti S, Pirttila TJ, Lukasiuk K, Tuunanen J, Pitkanen A. Expression and activation of caspase 3 following status epilepticus in the rat. Eur J Neurosci. 2003;18:1486–1496. doi: 10.1046/j.1460-9568.2003.02874.x. [DOI] [PubMed] [Google Scholar]
- Newton SS, Collier EF, Hunsberger J, Adams D, Terwilliger R, Selvanayagam E, Duman RS. Gene profile of electroconvulsive seizures: induction of neurotrophic and angiogenic factors. J Neurosci. 2003;23:10841–10851. doi: 10.1523/JNEUROSCI.23-34-10841.2003. [DOI] [PMC free article] [PubMed] [Google Scholar]
- Park JS, Bateman MC, Goldberg MP. Rapid alterations in dendrite morphology during sublethal hypoxia or glutamate receptor activation. Neurobiol Dis. 1996;3:215–227. doi: 10.1006/nbdi.1996.0022. [DOI] [PubMed] [Google Scholar]
- Pitkanen A. Drug-mediated neuroprotection and anti-epileptogenesis. Neurology. 2002;59:S27–S33. doi: 10.1212/wnl.59.9_suppl_5.s27. [DOI] [PubMed] [Google Scholar]
- Pitkanen A, Nissinen J, Nairismagi J, Lukasiuk K, Grohn OH, Miettinen R, Kauppinen R. Progression of neuronal damage after status epilepticus and during spontaneous seizures in a rat model of temporal lobe epilepsy. Prog Brain Res. 2002;135:67–83. doi: 10.1016/S0079-6123(02)35008-8. [DOI] [PubMed] [Google Scholar]
- Plamondon H, Blondeau N, Heurteaux C, Lazdunski M. Mutually protective actions of kainic acid epileptic preconditioning and sublethal global ischemia on hippocampal neuronal death: involvement of adenosine A1 receptors and K(ATP) channels. J Cereb Blood Flow Metab. 1999;19:1296–1308. doi: 10.1097/00004647-199912000-00002. [DOI] [PubMed] [Google Scholar]
- Ploski JE, Newton SS, Duman RS. Electroconvulsive seizure-induced gene expression profile of the hippocampus dentate gyrus granule cell layer. J Neurochem. 2006;99:1122–1132. doi: 10.1111/j.1471-4159.2006.04156.x. [DOI] [PubMed] [Google Scholar]
- Rosenzweig HL, Lessov NS, Henshall DC, Minami M, Simon RP, Stenzel-Poore MP. Endotoxin preconditioning prevents cellular inflammatory response during ischemic neuroprotection in mice. Stroke. 2004;35:2576–2581. doi: 10.1161/01.STR.0000143450.04438.ae. [DOI] [PubMed] [Google Scholar]
- Rowland BD, Bernards R, Peeper DS. The KLF4 tumour suppressor is a transcriptional repressor of p53 that acts as a context-dependent oncogene. Nat Cell Biol. 2005;7:1074–1082. doi: 10.1038/ncb1314. [DOI] [PubMed] [Google Scholar]
- Sasahira M, Lowry T, Simon RP, Greenberg DA. Epileptic tolerance: prior seizures protect against seizure-induced neuronal injury. Neurosci Lett. 1995;185:95–98. doi: 10.1016/0304-3940(94)11233-9. [DOI] [PubMed] [Google Scholar]
- Shinoda S, Araki T, Lan JQ, Schindler CK, Simon RP, Taki W, Henshall DC. Development of a model of seizure-induced hippocampal injury with features of programmed cell death in the BALB/c mouse. J Neurosci Res. 2004a;76:121–128. doi: 10.1002/jnr.20064. [DOI] [PubMed] [Google Scholar]
- Shinoda S, Schindler CK, Meller R, So NK, Araki T, Yamamoto A, Lan JQ, Taki W, Simon RP, Henshall DC. Bim regulation may determine hippocampal vulnerability after injurious seizures and in temporal lobe epilepsy. J Clin Invest. 2004b;113:1059–1068. doi: 10.1172/JCI19971. [DOI] [PMC free article] [PubMed] [Google Scholar]
- Simon RP, Niiro M, Gwinn R. Prior ischemic stress protects against experimental stroke. Neurosci Lett. 1993;163:135–137. doi: 10.1016/0304-3940(93)90364-q. [DOI] [PubMed] [Google Scholar]
- Sokka AL, Putkonen N, Mudo G, Pryazhnikov E, Reijonen S, Khiroug L, Belluardo N, Lindholm D, Korhonen L. Endoplasmic reticulum stress inhibition protects against excitotoxic neuronal injury in the rat brain. J Neurosci. 2007;27:901–908. doi: 10.1523/JNEUROSCI.4289-06.2007. [DOI] [PMC free article] [PubMed] [Google Scholar]
- Stenzel-Poore MP, Stevens SL, King JS, Simon RP. Preconditioning reprograms the response to ischemic injury and primes the emergence of unique endogenous neuroprotective phenotypes: a speculative synthesis. Stroke. 2007;38:680–685. doi: 10.1161/01.STR.0000251444.56487.4c. [DOI] [PubMed] [Google Scholar]
- Stenzel-Poore MP, Stevens SL, Simon RP. Genomics of preconditioning. Stroke. 2004;35:2683–2686. doi: 10.1161/01.STR.0000143735.89281.bb. [DOI] [PubMed] [Google Scholar]
- Stenzel-Poore MP, Stevens SL, Xiong Z, Lessov NS, Harrington CA, Mori M, Meller R, Rosenzweig HL, Tobar E, Shaw TE, Chu X, Simon RP. Effect of ischaemic preconditioning on genomic response to cerebral ischaemia: similarity to neuroprotective strategies in hibernation and hypoxia-tolerant states. Lancet. 2003;362:1028–1037. doi: 10.1016/S0140-6736(03)14412-1. [DOI] [PubMed] [Google Scholar]
- Towfighi J, Housman C, Mauger D, Vannucci RC. Effect of seizures on cerebral hypoxic-ischemic lesions in immature rats. Brain Res Dev Brain Res. 1999;113:83–95. doi: 10.1016/s0165-3806(99)00004-8. [DOI] [PubMed] [Google Scholar]
- Weih M, Kallenberg K, Bergk A, Dirnagl U, Harms L, Wernecke KD, Einhaupl KM. Attenuated stroke severity after prodromal TIA: a role for ischemic tolerance in the brain? Stroke. 1999;30:1851–1854. doi: 10.1161/01.str.30.9.1851. [DOI] [PubMed] [Google Scholar]
- Xu Q, Taya S, Kaibuchi K, Arnold AP. Spatially and temporally specific expression in mouse hippocampus of Usp9x, a ubiquitin-specific protease involved in synaptic development. J Neurosci Res. 2005;80:47–55. doi: 10.1002/jnr.20429. [DOI] [PubMed] [Google Scholar]
- Yamada S, Yamaguchi T, Hosoda A, Iwawaki T, Kohno K. Regulation of human STARD4 gene expression under endoplasmic reticulum stress. Biochem Biophys Res Commun. 2006;343:1079–1085. doi: 10.1016/j.bbrc.2006.03.051. [DOI] [PubMed] [Google Scholar]
- Yamamoto A, Murphy N, Schindler CK, So NK, Stohr S, Taki W, Prehn JH, Henshall DC. Endoplasmic reticulum stress and apoptosis signaling in human temporal lobe epilepsy. J Neuropathol Exp Neurol. 2006;65:217–225. doi: 10.1097/01.jnen.0000202886.22082.2a. [DOI] [PubMed] [Google Scholar]