Abstract
Observational studies in multiple sclerosis (MS) demonstrated altered expression of chemokine receptors (CkRs) on comparable populations of mononuclear cells (e.g. CD4+/CD45RO+ T-cells) in brain sections compared with blood. These findings raised questions about the regulation of CkRs on trafficking cells. Regulatory processes for CkRs are complex: examples include down-regulation following ligand engagement during migration and either up- or down-regulation following activation. Additionally, CkRs that mediate transmigration without being down-regulated will be selectively enriched on migrating cells in the inflammatory site. Finally, CkRs may act as functionally neutral markers of activated cells capable of undergoing transmigration. Clarifying CkR regulation may aid in the selection and application of antagonists for treating neuroinflammation. Mechanisms of receptor regulation during transmigration cannot be studied by descriptive methods. We evaluated CCR5 expression on CD14+ monocytes and CD3+ T-cells following CCL5-driven transmigration through an in vitro blood-brain barrier (IVBBB), as both T-cells and monocytes in MS lesions express CCR5. CCR5 expression was augmented on non-migrating CD14+ but not CD3+ cells, suggesting selective activation of monocytes by incubation in contact with endothelial cells. As proposed from observational studies, CCR5 was enriched on monocytes that migrated spontaneously in the absence of exogenous chemokine. Addition of the CCR5 ligand CCL5 to the lower chamber led to enhanced CD3+ T-cell migration. Interestingly, CCR5 was down-regulated on both CD14+ monocytes and CD3+ T cells during CCL5-driven migration. These results are distinct from those obtained in comparable studies of CCR2 and CXCR3, suggesting that the specifics for CkR expression should be studied for individual receptors on each leukocyte subpopulation during the design of strategies for pharmacological blockade in neuroinflammation.
Keywords: Blood-Brain Barrier, Chemokine, Chemokine Receptor, CCR5, Leukocyte Migration, Monocyte, Multiple Sclerosis, Neuroinflammation, T-lymphocyte
1. INTRODUCTION
CCR5 is a CC-chemokine receptor expressed on resting T-cells with memory/ effector phenotype, monocytes, macrophages and immature dendritic cells [1–3]. CCR5 is genetically variable within the human population, including a non-functional Δ32 mutation in Caucasians whose biological implications are indicated by resistance to HIV-1 infection and susceptibility to West Nile Virus Encephalitis (WNVE) in Δ32 homozygotes [4–7]. CCR5 binds several ligands, including CCL5, CCL3, CCL4, CCL8 and CCL14. Increased expression of CCL5, as well as CCL3 and CCL4, have been described in the inflamed central nervous system (CNS) of patients with MS and an animal model, experimental autoimmune encephalomyelitis (EAE) [1–3] , implying that these chemokines may interact with CCR5 during neuroinflammation.
Multiple processes including those which up- or down-regulate receptor cell surface expression regulate CCR5 function. These adaptive mechanisms (active in many G-protein coupled receptors [GPCRs]) operate within different time frames after ligand-receptor interactions [8–11]. Processes underlying GPCR modulation include ligand-induced internalization, with subsequent recycling or degradation. Depending on the receptor’s post-internalization fate, this process can alter total cellular receptor expression, within several hours [8, 10, 11]. These processes are dependent on C-terminal receptor phosphorylation by a family of serine threonine protein kinases known as G-protein coupled receptor kinases [8, 12].
Following ligand-induced CCR5 phosphorylation, β-arrestins bind to the phosphorylated receptor, as well as the second intercellular loop, and prevent G-protein binding and consequent second messenger signaling. β-arrestins also serve as adaptor proteins that link phosphorylated CCR5 to clathrin in order to mediate receptor internalization via endocytosis [8, 9, 11, 13]. Arrestins can additionally act as adaptors in signaling processes [14]. Ligand-activated CCR5 also undergoes caveolae-dependent endocytosis, independent of receptor phosphorylation and β-arrestin/ clathrin pathways. Following receptor internalization, CCR5 accumulates in the perinuclear recycling endosomes and returns to the plasma membrane in a dephosphorylated form [8, 11, 13, 15]. CCR5 surface expression depends on removal of ligand through sequestration, dissociation from the receptor and endosomal degradation [8, 11]. Mechanisms of CCR5 recycling differ between species, cell type and chemokine ligands [11].
The aim of this study was to elucidate the expression of CCR5 on freshly isolated human CD14+ monocytes and CD3+ T-cells following CCL5-driven migration across an in vitro model of the blood-brain barrier (BBB), as a means to understand the specific role(s) of CCR5 in the early stages of mononuclear cell trafficking during neuroinflammation. CCR5 expression has been detected on perivascular monocytes and T-cells, as well as lesion-associated microglia and macrophages in MS [16]. It remains uncertain what role CCR5 and its ligands might play in MS, based on genetic studies of the Δ32 polymorphism and animal models of MS [17–19]. However, data exist implicating CCR5 and a commonly expressed ligand, CCL5, in pathogenic neuroinflammation as well as host defense against WNVE [4, 20–23]. As a consequence, it would be important to decipher if CCR5 is necessary for the migration of certain leukocytes across the BBB (as seen with CCR2) [24] or is a marker for mononuclear cells capable of undergoing transmigration, as seen with CXCR3 [25]. Such information would address one potential role of CCR5 in neuroinflammation and provide insights into the potential routes of administration and efficacy of receptor blockade during neuroinflammation in vivo.
Studying receptor expression using an in vitro BBB (IVBBB) allows assessment of ligand-receptor interactions during the early phases of neuroinflammation. Results of such studies can have therapeutic implications, as receptors that facilitate leukocyte transmigration can be modulated systemically without recourse to agents capable of crossing the BBB. Previous studies in our laboratory supported the hypothesis that CCL2-CCR2 interactions are important for mononuclear cell migration across the BBB (despite low levels of CCL2 and CCR2+ cells in the CSF and brain parenchyma in MS respectively [24, 26–28]). We also showed that CXCR3 was a marker of CD4+ memory T-lymphocytes capable of migrating across the BBB in vitro, without playing an active role in transmigration [25]. Our findings from these IVBBB experiments were consonant with the results of studies of EAE induced in mutant mice lacking either CCR2 or CXCR3 [29–31].
CCR5 has been demonstrated on a small subset of circulating blood monocytes (<10%), but is present on all monocytes in MS lesions [16, 32–34]. In addition, CCR5 is present on ~20% of circulating T-cells and as high as 90% of perivascular CD4+ T-cells in chronic active MS lesions [35–39]. To study CCR5 expression on mononuclear cells during BBB transmigration ex vivo, we utilized a well-established IVBBB model. Using SV40 T-antigen immortalized human brain microvascular endothelial cells (THBMECs), we developed a cytokine-activated IVBBB model (aIVBBB) that recapitulates the inflammatory milieu during neuroinflammation.
Activating subconfluent THBMECs with 10 U/mL TNF-α and 20 U/mL IFN-γ for 24 hours resulted in maximal endothelial activation, as monitored by up-regulation of intercellular adhesion molecule (ICAM)-1 expression without compromising tight junction properties [40]. In this model, CCL5-driven mononuclear cell migration was dependent on CCR1, CCR5, αLβ2 integrin/ ICAM-1 and α4β1 integrin/ fibronectin connecting segment-1 (FN CS-1) [40]. In this report, we investigated the regulation of CCR5 on mononuclear cells during CCL5-driven migration across the basal (without cytokine activation) IVBBB and aIVBBB. The results provide insight into the origins of differing CCR5 expression on comparable leukocyte populations in blood and brain.
2. MATERIALS AND METHODS
2.1. CCL5 ELISA
THBMECs were grown to confluence in 6-well flat bottom Falcon® tissue culture plates (Becton Dickinson and Company, Franklin Lakes, NJ) and activated with varying combinations of TNF-α (10–100 U/mL) and IFN-γ (20–200 U/mL). The supernatant from these wells was gently collected 24 hours after cytokine activation. Basal confluent THBMECs served as negative controls. ELISA for CCL5 was performed according to the manufacturer’s directions using the DuoSet ELISA kit (R&D Systems, Minneapolis, MN). Briefly, 96-well flat bottom plates were coated overnight with anti-CCL5 capture antibody at 4°C. Plates were washed with 0.05% Tween® 20 in PBS, blocked with 1% bovine serum albumin (BSA) in 1X PBS for 1 hour at room temperature and incubated with 100 μL samples diluted 1:9 in 1% BSA in 1X PBS (in triplicate) for 2 hours at room temperature.
After washing vigorously, the 96-well plates were incubated with biotin-conjugated anti-CCL5 detection antibody for 2 hours at room temperature, followed by 20-minute incubation with streptavidin-horseradish peroxidase. Substrate solution (1:1 mixture of H2O2 and tetramethylbenzidine) was added for the final 20 minutes at room temperature in the dark and the reaction was stopped by 2N H2SO4. Absorbance measurements were taken at 450 nm for CCL5 concentration determination, and 540 nm for background measurements using a SpectraMax M2 microplate reader (Molecular Devices, Sunnydale, CA). CCL5 concentrations (in ng/mL) were determined against a standard curve of known protein concentrations using the manufacturer’s instructions.
2.2. Preparation of leukocytes for transmigration assays
Peripheral blood mononuclear cells (PBMCs) were isolated from fresh whole heparinized blood obtained from healthy adult volunteers by density centrifugation using Lymphocyte Separation Medium (Mediatech, Herndon, VA). After washing with 1% BSA in 1X PBS, PBMCs were centrifuged at 1700 rpm for 5 minutes (300 g) to facilitate platelet removal. The PBMC population was resuspended at 107/mL in 1% BSA + RPMI 1640 without phenol red (transendothelial migration [TEM] buffer) for transmigration assays. The Institutional Review Board approved the protocol and signed informed consent was obtained from all donors.
2.3. Transmigration assays
Transmigration assays were performed as described previously [24, 25, 40] with basal or cytokine-activated (10 U/mL TNF-α and 20 U/mL IFN-γ) THBMECs cultured on 24-well collagen-coated, polyester membrane Transwell ™ inserts of 6.5 mm diameter and 3.0 μm pore size (Corning, Corning, NY) at 20,000–40,000 cells/insert on days 4–5. THBMECs were used at passages 18–25 with mean transendothelial electrical resistance routinely ≥ 90 Ω.cm2. The confluent inserts were carefully transferred to fresh wells containing 600 μL of TEM buffer. 100 ng/mL recombinant human CCL5 (R&D Systems, Minneapolis, MN), a concentration shown to induce maximal PBMC migration in this model [40] was included in the well (bottom chamber, abluminal side) when indicated. In certain experiments, 25 ng/mL CCL2 (an optimal concentration) [24] was also included in separate wells. 106 PBMCs in 100 μL of TEM buffer were added to the inserts and allowed to transmigrate at 37°C in a humid atmosphere of 5% CO2 for 3 hours. These experiments were performed in triplicate, with migration across the basal IVBBB without added chemokine serving as spontaneous migration.
In experiments quantifying the numbers of migrating PBMCs, 107 cells/mL obtained from density centrifugation (PBMCs, erythrocytes and platelets) were fluorescently labeled with 4 μg/mL calcein-AM (Molecular Probes, Eugene, OR) according to the manufacturer’s directions. In this assay, erythrocytes and platelets are calcein-AM negative. The percentage purity of the cell suspension was established by flow cytometry, as previously described [40], varying between 80–100%. Transmigrated PBMCs were enumerated in samples from the wells (bottom chamber) by exciting at 490 nm and measuring fluorescence at 530 nm using aSPECTRAmax GEMINIXS microplate spectrofluorometer (Molecular Devices Corporation, Sunnyvale, CA). In experiments analyzing surface marker expression on PBMCs by flow cytometry, the calcein-AM labeling was omitted. Parallel quantification and surface marker expression experiments on PBMCs isolated from the same donors were performed when indicated in order to quantify subpopulations of PBMCs, as previously described [40].
2.4. Antibody staining and flow cytometry of PBMCs
Flow cytometric analysis of input, non-migrated and migrated PBMCs was performed in parallel with input cells stained at 0 hours and non-migrated and migrated cells stained after 3 hours, as previously described [24, 40]. Two inserts were pooled for the non-migrated population and 4 wells were pooled for the migrated population to perform these analyses.
Samples were blocked with 0.2 mg/mL normal mouse IgG (1:14 dilution, Catalag Laboratories, Burlingame, CA) in FACS buffer (PBS + 2% heat-inactivated fetal calf serum + 0.1% sodium azide) for 15 minutes, followed by single step staining with either mouse anti-human CD14 IgG2b-APC or mouse anti-human CD14 IgG2b-PE (clone MΦP9), mouse anti-human CD3 IgG1-PerCP (clone SK7) and mouse anti-human CCR5 IgG2a-FITC (clone 2D7, all from Becton Dickinson Biosciences, San Jose, CA) when indicated. Following incubation for 15 minutes at room temperature, PBMCs were washed in FACS buffer and fixed in 0.5% paraformaldehyde at 4°C overnight. Data were acquired using an LSR flow cytometer and analyzed using WinList software (Verity Software House, Topsham, ME) or FlowJo version 6.1.1 for Mackintosh software (Tree Star, Ashland, OR). Monocytes and lymphocytes were gated according to forward and side light scatter characteristics, as well as CD14 and CD3 staining profiles, and analyzed against isotype-matched controls.
When indicated, 107/mL of freshly isolated PBMCs were incubated with or without 100 ng/mL recombinant human CCL5 (R&D Systems, Minneapolis, MN) in TEM buffer at either 4°C or 37°C for 1 hour to determine effects of chronic ligand exposure on CCR5 expression. After gentle mixing and washing in FACS buffer, approximately 106 PBMCs per experimental condition were stained for flow cytometric analysis as described above.
2.5. Statistical Analysis
Student’s t-test analyses were performed to ascertain statistical significance. A p-value of <0.05 was used to determine significance.
3. RESULTS
3.1. Cytokine activation induces CCL5 production by THBMECs in vitro
At basal conditions, confluent THBMEC layers (i.e. the basal IVBBB) do not secrete CCL5 into the culture medium. Following physiologic cytokine activation (10 U/mL TNF-α, 20 U/mL IFN-γ), confluent THBMEC layers (i.e. the aIVBBB) produced a mean CCL5 concentration of 870 pg/mL. There was a dose-dependent increase in CCL5 production with higher cytokine concentrations, but as previously reported, high-level cytokine exposure also degraded barrier function of the THBMECs [40]. These data indicate that physiologic cytokine activation results in endogenous CCL5 production by THBMECs that may contribute to the modulation of CCR5 expression on PBMCs during IVBBB transmigration.
3.2. CCL5 induces CCR5 down-regulation on CD14+ monocytes and CD3+ T-cells in vitro
It was important to initially define the effect of ligand-receptor interactions on PBMCs in the absence of endothelial cells and without the stimulus of migration prior to determining the effect of CCL5 on CCR5+ PBMCs during transmigration. Incubation of PBMCs in TEM media for 1 hour without chemokines did not alter expression of CCR5 on CD3+ T-cells (Figure 1a) or CD14+ monocytes (Figure 1b). There was no significant reduction in the numbers of receptor-positive cells under these conditions (Table 1a and 1b) relative to the input. We observed CCR5 down-regulation (based on reduction in mean fluorescent intensity [MFI]) on both CD3+ T-cell (Figure 1a) and CD14+ monocyte (Figure 1b) subpopulations following incubation with CCL5 for 1 hr at 37°C, less so at 4°C, indicative of receptor internalization following ligand engagement. There was a significant quantitative reduction in the number of CD3+CCR5+ T-cells (Table 1a) and CD14+CCR5+ monocytes (Table 1b) following incubation with CCL5 at 37°C (associated with a reduction in average MFI), further validating the effect of CCL5 exposure on CCR5 surface expression on these mononuclear leukocyte subpopulations in these assays.
Figure 1.
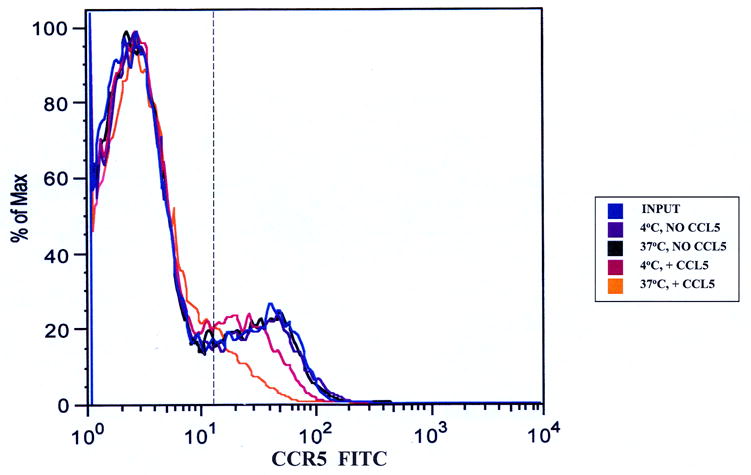
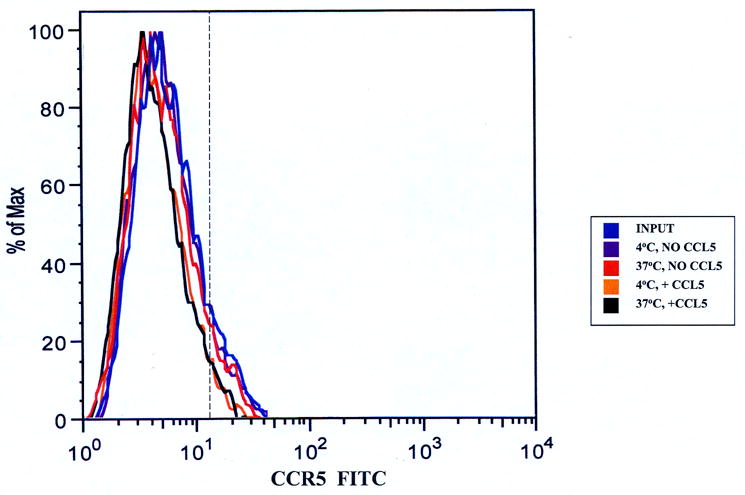
CCL5-induced down-regulation of CCR5 on PBMCs. 107 cells/mL were incubated without chemokine or with 100 ng/mL CCL5 for 1 hour at 4°C or 37°C. Approximately 106 cells were stained with anti-CD14, anti-CD3 and anti-CCR5 antibodies to determine the effects of chronic CCL5 exposure on receptor expression on non-migrating monocytes and T-cells. Both T-cells (Figure 1a) and monocytes (Figure 1b) showed reduced CCR5 expression when incubated with CCL5 at 37°C relative to input cells and cells incubated without CCL5. There was less reduction seen on both subpopulations of mononuclear cells incubated with CCL5 at 4°C, indicating that reduced CCR5 expression was secondary to receptor internalization. Shown are representative overlays from four separate experiments using two different donors. The vertical hashed line represents the gating index for these experiments based on the isotype controls.
Table 1a.
Quantification of CD3+ T-cell CCR5 expression following chronic CCL5 exposure. This table compliments Figure 1a, and demonstrates a significant reduction in the number of CD3+CCR5+ T-cells and CD3+ CCR5 mean fluorescent intensity (MFI), following incubation with CCL5 at 37°C, indicative of receptor internalization following ligand-receptor interactions.
| CD3+ T-cells (% PBMCs) | Number of CD3+ T-cells | CD3+ CCR5+ (% of CD3+ T-cells) | Number of CD3+ CCR5+ T-cells | CD3+ CCR5+ MFI | p-value* | |
|---|---|---|---|---|---|---|
| INPUT (PBMCs) | D1= 54.3 | 499,560 | 16.0 | 79,930 | 39.9 | |
| D1=920,000 | D2= 45.3 | 437,145 | 23.9 | 104,478 | 28.9 | |
| D2=965,000 | Mean= 49.8 | 468,353 | 20.0 | 92,204 | 34.4 | n/a |
| 4°C, No CCL5 | D1= 54.1 | 497,720 | 16.4 | 81,626 | 41.1 | |
| D2= 45.7 | 441,005 | 24.3 | 107,164 | 29.1 | ||
| Mean= 49.9 | 469,363 | 20.4 | 94,395 | 35.1 | n.s. | |
| 4°C, + CCL5 | D1= 54.8 | 504,160 | 13.8 | 69,574 | 29.0 | |
| D2= 45.6 | 440,040 | 17.6 | 77,447 | 19.8 | ||
| Mean= 50.2 | 472,100 | 15.7 | 73,511 | 24.4 | n.s. | |
| 37°C, No CCL5 | D1= 55.2 | 507,840 | 16.3 | 82,778 | 39.1 | |
| D2= 46.2 | 445,830 | 23.8 | 106,108 | 28.8 | ||
| Mean= 50.7 | 476,835 | 20.1 | 94,443 | 34.0 | n.s. | |
| 37°C, + CCL5 | D1= 55.1 | 506,920 | 8.71 | 44,153 | 20.4 | |
| D2= 46.5 | 448,725 | 9.24 | 41,462 | 16.7 | ||
| Mean= 50.8 | 477,823 | 8.98 | 42,808 | 18.6 | 0.02 |
indicates that p-values were ascertained relative to the number of input CD3+CCR5+ T-cells (n=4). Key: D1: Donor 1, D2: Donor 2, n/a: not applicable, n.s.: not significant, PBMCs: peripheral blood mononuclear cells.
Table 1b.
Quantification of CD14+ monocyte CCR5 expression following chronic CCL5 exposure. This table compliments Figure 1b, demonstrating a mild reduction in the number of CD14+CCR5+ monocytes and CD14+ CCR5 mean fluorescent intensity (MFI) following incubation with CCL5 at 37°C. This indicates CCR5 internalization occurs following CCL5-CCR5 interactions in vitro.
| CD14+ monocytes (% PBMCs) | Number of CD14+ monocytes | CD14+ CCR5+ (% of CD14+ monocytes) | Number of CD14+ CCR5+ monocytes | CD14+ CCR5+ MFI | p-value* | |
|---|---|---|---|---|---|---|
| INPUT (PBMCs) | D1= 15.5 | 142,600 | 6.19 | 8,827 | 39.9 | |
| D1=920,000 | D2= 23.3 | 224,845 | 7.05 | 15,852 | 28.9 | |
| D2=965,000 | Mean= 19.4 | 183,723 | 6.62 | 12,340 | 34.5 | n/a |
| 4°C, No CCL5 | D1= 15.3 | 140,760 | 6.39 | 8,995 | 39.1 | |
| D2= 22.6 | 218,090 | 6.93 | 15,114 | 27.4 | ||
| Mean= 19.0 | 179,425 | 6.60 | 12,055 | 33.3 | n.s. | |
| 4°C, + CCL5 | D1= 15.3 | 140,760 | 5.52 | 7,770 | 30.7 | |
| D2= 22.8 | 220,020 | 5.84 | 12,849 | 24.9 | ||
| Mean= 19.1 | 180,390 | 5.68 | 10,310 | 27.8 | n.s. | |
| 37°C, No CCL5 | D1= 15.1 | 138,920 | 5.89 | 8,182 | 41.8 | |
| D2= 22.5 | 217,125 | 7.32 | 15,894 | 28.7 | ||
| Mean= 18.8 | 178,023 | 6.61 | 12,038 | 35.3 | n.s. | |
| 37°C, + CCL5 | D1= 14.9 | 137,080 | 4.33 | 5,936 | 29.1 | |
| D2= 22.1 | 213,265 | 5.04 | 10,749 | 20.7 | ||
| Mean= 18.5 | 175,173 | 4.69 | 8,343 | 24.9 | 0.04 |
indicates that p-values were ascertained relative to the number of input CD14+CCR5+ monocytes (n=4). Key: D1: Donor 1, D2: Donor 2, n/a: not applicable, n.s.: not significant, PBMCs: peripheral blood mononuclear cells.
3.3. In the basal and activated IVBBB, CD14+ monocytes migrating without CCL5 and their non-migrating counterparts are enriched for CCR5+
About 8% (5.0–10.0) of input CD14+ monocytes expressed CCR5 (Table 2a). There was a mean 2.5-fold increase in percentage of non-migrating CD14+ monocytes that expressed CCR5 in the basal IVBBB and aIVBBB assays relative to the input (calculated as the average percentage of non-migrating CD14+CCR5+ monocytes in both assays divided by the mean percentage of CD14+CCR5+ input monocytes; Table 2a). There was also a mean 3.3-fold increase in percentage of migrated CD14+CCR5+ monocytes without added chemokine relative to the input (calculated as the average percentage of spontaneously migrating CD14+ CCR5+ monocytes in the basal IVBBB and aIVBBB models divided by the mean percentage of CD14+CCR5+ input monocytes; Table 2a).
Table 2a.
Quantification of CCL5-driven PBMC migration across basal IVBBB and aIVBBB. Parallel transmigration assays across either the basal IVBBB or aIVBBB, with or without 100 ng/mL CCL5 were performed using calcein-AM labeled and unlabeled cells as described in the Materials and Methods section. There was preferential migration of CD14+ monocytes across either IVBBB models, with higher levels seen across the aIVBBB. There was CCR5 up-regulation on monocytes during the transmigration assay (based on increased numbers and percentages of CD14+ CCR5+ cells in the non-migrated and migrated populations without added CCL5, relative to the input), with receptor down-regulation (based on reduced numbers and percentages of CD14+ CCR5+ monocytes) following CCL5-induced migration. CCL5 facilitated an increase in total CD3+ T-cell migration across either IVBBB models that was more efficient for CCR5+ cells (based on the higher percentages of migrating CD3+CCR5+ T-cells relative to the input and cells migrating without added chemokine). Higher numbers of migrating CD3+ T-cells were seen with the aIVBBB, indicating that endothelial activation significantly induced chemokine-driven T-cell migration in vitro. Shown are the means of five separate experiments using different donors. [ ] indicates the mean percentage of input cells that migrated in 3 hours, while ( ) indicates the mean percentages of the parent mononuclear cell population that were CCR5+. Key: aIVBBB: cytokine-activated in vitro blood-brain barrier, IVBBB: in vitro blood-brain barrier, PBMCs: peripheral blood mononuclear cells.
| BBB MODEL | CONDITION | CD14+ | CD14+ CCR5+ | CD3+ | CD3+ CCR5+ |
|---|---|---|---|---|---|
| INPUT | 167,973 | 12,730 (7.58%) | 482,374 | 103,253 (21.72%) | |
| Basal IVBBB | No Chemokine-Non-migrated | 67,036 | 12,531 (18.69%) | 476,827 | 99,582 (20.80%) |
| Basal IVBBB | No Chemokine-Migrated | 100,937 [60.1%] | 28,661 (28.39%) | 5,547 [1.1%] | 1,443 (26.01%) |
| Basal IVBBB | + CCL5-Non-migrated | 57,762 | 9,892 (17.13%) | 464,544 | 87,456 (18.83%) |
| Basal IVBBB | + CCL5-Migrated | 110,211 [65.6%] | 18,055 (16.38%) | 17,830 [3.7%] | 9,328 (52.33%) |
| aIVBBB | No Chemokine-Non-migrated | 61,319 | 13,344 (21.76%) | 475,058 | 97,866 (20.60%) |
| aIVBBB | No Chemokine-Migrated | 106,654 [63.5%] | 22,419 (21.02%) | 7,316 [1.5%] | 2,908 (39.75%) |
| aIVBBB | + CCL5-Non-migrated | 48,317 | 8,504 (17.60%) | 450,877 | 80,916 (17.95%) |
| aIVBBB | + CCL5-Migrated | 119,656 [71.2%] | 12,730 (10.64%) | 31,497 [6.5%] | 16,756 (53.20%) |
Taking the total number of migrated and non-migrated CD14+CCR5+ monocytes without added CCL5 together, the average number of CD14+CCR5+ monocytes increased from about 13,000 (input) to about 41,000 in the basal IVBBB and 36,000 in the aIVBBB assays (Table 2a). These results suggested that monocytes became activated during transmigration. Figure 2 graphically demonstrates the increased proportion of CD14+CCR5+ monocytes in the migrated population without added chemokine relative to the input and consequential receptor down-regulation following CCL5-driven migration in the basal IVBBB (Figure 2a) and aIVBBB (Figure 2b), supporting the quantitative data shown in Table 2a.
Figure 2.
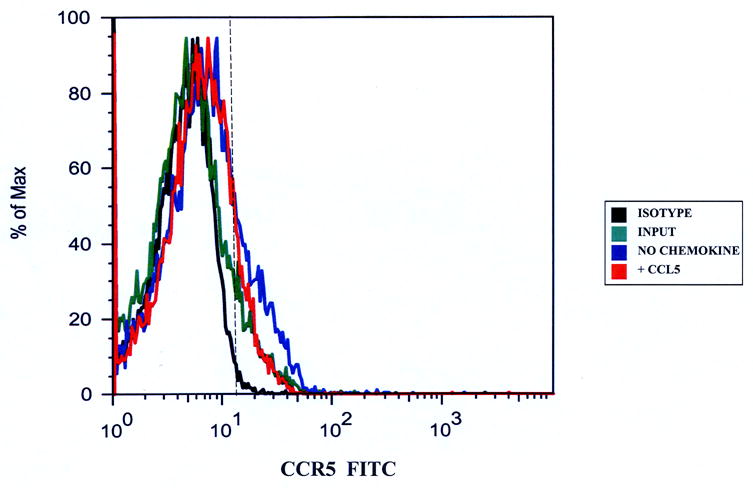
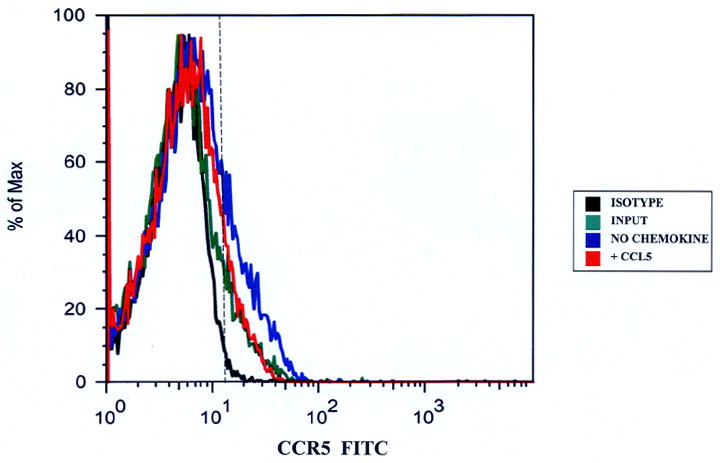
CCR5 expression on CD14+ monocytes migrating to CCL5. Migrated CD14+ monocytes were stained with anti-CCR5 antibodies to determine receptor expression. There was an increased proportion of CCR5+ monocytes that migrated without added chemokines relative to the input, indicative of monocyte activation during the transmigration assay in both the basal IVBBB (Figure 2a) and aIVBBB (Figure 2b). There was a reduction in the proportion of migrated CD14+CCR5+ monocytes following CCL5-driven migration relative to the migrated population without added chemokines in both models, indicative of CCR5 down-regulation following ligand-induced transmigration. Shown are histograms from representative experiments (n=5). The vertical hashed line represents the gating index for these experiments based on the shown isotype control histogram. Key: aIVBBB: cytokine-activated in vitro blood-brain barrier, IVBBB: in vitro blood-brain barrier.
3.4. Regulation of CCR5 on migrating CD3+ T cells in the absence of CCL5: Effect of THBMEC activation
A mean of 22% (13–30) of the input CD3+ T-cells expressed CCR5. There was no change in the total numbers of CD3+CCR5+ T-cells in either the basal IVBBB or aIVBBB assays, comparing the mean number of input CD3+CCR5+ T cells with the mean total numbers of non-migrating and migrating CD3+CCR5+ T-cells in the absence of CCL5 (Table 2a). These data indicate that the regulation of CCR5 expression by co-incubation with THBMECs differs between CD14+ monocytes and CD3+ T-cells. There was a statistically significant, 32% mean increase in spontaneous CD3+ T-cell migration (i.e. without added CCL5) across the aIVBBB as compared with the basal IVBBB. This was calculated as the difference in the mean numbers of CD3+ T-cells that migrated without added chemokine across the aIVBBB and basal IVBBB divided by the mean number of spontaneously migrating CD3+ T cells in the basal IVBBB, multiplied by 100%. This finding most likely reflects T-cell migration in response to endogenously produced CC chemokines by THBMECs following cytokine activation, such as CCL2 [40] and CCL5.
3.5. CCR5 down-regulation on CD14+ monocytes and CD3+ T-cells occurs following CCL5-driven transmigration
CD14+ monocytes migrated more efficiently than did CD3+ T cells across both the basal IVBBB and aIVBBB, under both spontaneous and CCL5-driven conditions (Table 2a). Interestingly, migration in response to CCL5 reduced the percentage of CD14+CCR5+ monocytes (Table 2a) without significant change in MFI (Table 2b). Migration to CCL2, a non-CCR5 ligand, did not modulate monocyte CCR5 expression relative to spontaneous migration across either the basal IVBBB or aIVBBB (data not shown). These results supported the interpretation that the process of transmigration itself did not up-regulate CCR5 on migrating monocytes. Furthermore, there were reduced numbers of CD14+CCR5+ monocytes following spontaneous migration across the aIVBBB relative to spontaneous migration across the basal IVBBB, despite enhanced total CD14+ monocyte migration across the aIVBBB (Table 2a). This unexpected finding was likely due to down-regulation in CCR5 surface expression by CCL5 elicited from THBMECs following cytokine-mediated activation of the IVBBB.
Table 2b.
CCR5 expression on CD14+ monocytes during migration across the IVBBB. This table demonstrates the CCR5 mean fluorescent intensity (MFI) values on CD14+ monocytes from 5 different donors. There was no change in MFI on migrated and non-migrated monocytes in either the basal IVBBB or aIVBBB models relative to the input. This table, coupled with the data in Figure 2a, indicates that CCR5 down-regulation on CD14+ monocytes following CCL5-driven migration is based on a reduced percentage of receptor-positive cells, rather than a reduced receptor surface expression per cell.
| BBB MODEL | CONDITION | Donor 1 | Donor 2 | Donor 3 | Donor 4 | Donor 5 | p-value* |
|---|---|---|---|---|---|---|---|
| INPUT | 22.7 | 22.6 | 37.9 | 28.8 | 46.1 | n/a | |
| Basal IVBBB | No Chemokine-Non-migrated | 23.0 | 21.4 | 32.9 | 28.7 | 44.0 | n.s. |
| Basal IVBBB | No Chemokine-Migrated | 23.6 | 23.0 | 36.4 | 30.6 | 49.7 | n.s. |
| Basal IVBBB | + CCL5-Non-migrated | 20.3 | 21.3 | 37.0 | 27.3 | 44.0 | n.s. |
| Basal IVBBB | + CCL5-Migrated | 20.7 | 21.9 | 33.2 | 28.1 | 45.8 | n.s. |
| aIVBBB | No Chemokine-Non-migrated | 23.5 | 21.6 | 36.9 | 27.9 | 44.3 | n.s. |
| aIVBBB | No Chemokine-Migrated | 23.4 | 21.1 | 34.8 | 30.4 | 42.2 | n.s. |
| aIVBBB | + CCL5-Non-migrated | 22.4 | 22.0 | 37.2 | 28.0 | 43.8 | n.s. |
| aIVBBB | + CCL5-Migrated | 20.7 | 20.8 | 37.4 | 26.2 | 45.1 | n.s. |
indicates that p-values were ascertained relative to the input MFI. Key: aIVBBB: cytokine-activated in vitro blood-brain barrier, IVBBB: in vitro blood-brain barrier, n/a: not applicable, n.s.: not significant.
In either the basal IVBBB or aIVBBB models, CCL5 induced enrichment for CD3+ CCR5+ T-cells in the migrated population (comparing the percentages of CD3+CCR5+ T-cells following CCL5-driven migration relative to the input; Table 2a). We previously found that CCL5 signals preferentially across THBMECs, as compared with human umbilical vein endothelial cells (HUVECs), and mediates efficient migration of CD3+ T-cells (Man S et al. unpublished observations). Using the aIVBBB, CD3+CCR5+ T-cells were also relatively enriched in the migrated population without added chemokines (about 40% CCR5+ compared to about 22% in the input; Table 2a), suggesting a role for endogenous CCL5 production by the aIVBBB in driving spontaneous CD3+ T-cell migration across that model.
Following CCL5-driven CD3+ T-cell migration, we observed down-regulation of CCR5 surface expression in both the basal IVBBB (Figure 3a) and aIVBBB (Figure 3b) models. These observations were supported by statistically significant reductions on CCR5 MFI on CD3+ T-cells following CCL5-driven migration in either model relative to the input (Table 2c and Table 3). CD3+ T-cell migration to CCL2, a non-CCR5 binding chemokine did not alter CCR5 expression relative to the input and T-cells migrating without added chemokine in either IVBBB model (Figures 3a and 3b, and Table 3). This implied that CCR5 down-regulation which occurs following CD3+ T-cell transmigration was ligand specific, and associated with reduced CCR5+ density on T-cells.
Figure 3.
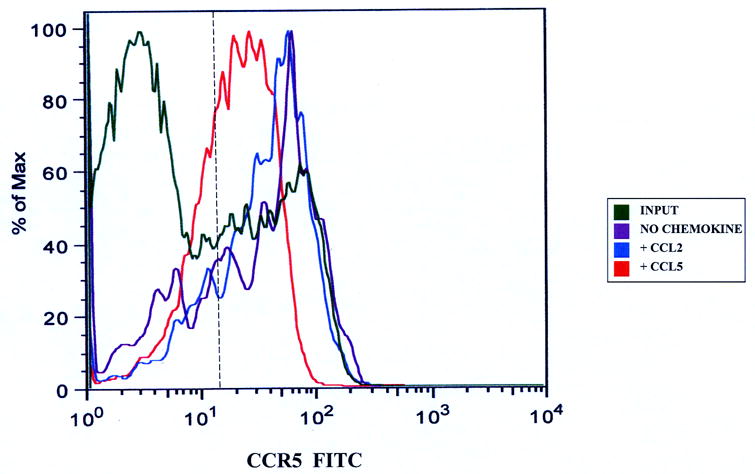
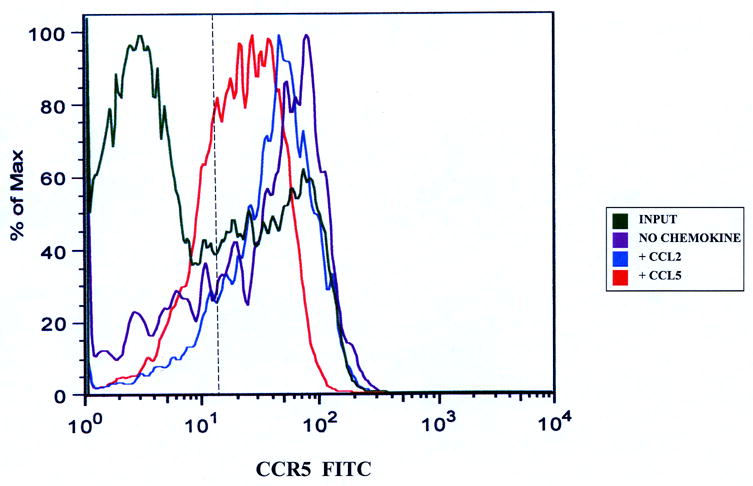
CCR5 expression on CD3+ T-cells migrating to CCL5. Migrated CD3+ T-cells were stained with anti-CCR5 antibodies to determine changes in receptor expression as stated in the Materials and Methods section. There was down-regulation in CD3+ T-cell CCR5 expression following CCL5-driven migration across the basal IVBBB (Figure 3a) and aIVBBB (Figure 3b). This was based on a reduction in mean fluorescent intensity (MFI) relative to the input, as well as to T-cells migrating without added chemokine and to a non-CCR5 binding chemokine, CCL2. Shown are histograms from representative experiments (n=3). The vertical hashed line represents the gating index for these experiments based on the isotype control.
Table 2c.
CCR5 expression on CD3+ T-cells during migration across the IVBBB. This table demonstrates the CCR5 mean fluorescent intensity (MFI) on CD3+ monocytes from 5 different donors. There was a significant reduction in CCR5 MFI on T-cells following CCL5-driven migration in either the basal IVBBB or aIVBBB models relative to the input. There was no change in the MFI on non-migrated cells or cells that migrated without added CCL5 in either model relative to the input. This table in addition to the data in Figure 2a, indicates that CCR5 down-regulation on CD3+ T-cells following CCL5-driven migration is associated with a reduced receptor expression per cell.
| BBB MODEL | CONDITION | Donor 1 | Donor 2 | Donor 3 | Donor 4 | Donor 5 | p-value* |
|---|---|---|---|---|---|---|---|
| INPUT | 25.8 | 24.4 | 38.0 | 28.2 | 27.9 | n/a | |
| Basal IVBBB | No Chemokine-Non-migrated | 25.9 | 24.8 | 37.9 | 27.4 | 22.2 | n.s. |
| Basal IVBBB | No Chemokine-Migrated | 23.1 | 26.6 | 41.1 | 27.8 | 27.5 | n.s. |
| Basal IVBBB | + CCL5-Non-migrated | 24.7 | 22.4 | 36.6 | 31.2 | 24.6 | n.s. |
| Basal IVBBB | + CCL5-Migrated | 16.4 | 15.6 | 27.4 | 21.9 | 19.9 | 0.03 |
| aIVBBB | No Chemokine-Non-migrated | 24.4 | 22.4 | 39.3 | 27.2 | 27.1 | n.s. |
| aIVBBB | No Chemokine-Migrated | 20.8 | 17.0 | 43.3 | 26.4 | 29.8 | n.s. |
| aIVBBB | + CCL5-Non-migrated | 23.8 | 22.3 | 38.5 | 29.8 | 31.1 | n.s. |
| aIVBBB | + CCL5-Migrated | 15.1 | 15.9 | 26.9 | 19.4 | 18.8 | 0.02 |
indicates that p-values were ascertained relative to the input MFI. Key: aIVBBB: cytokine-activated in vitro blood-brain barrier, IVBBB: in vitro blood-brain barrier, n/a: not applicable, n.s.: not significant.
Table 3.
Quantification of CCL5-driven T-cell migration across basal IVBBB and aIVBBB. This table compliments Figure 3, demonstrating significant reduction in the average CCR5 mean fluorescent intensity (MFI) on CD3+ T-cells following CCL5-driven migration across either the basal IVBBB or aIVBBB. The reduction in CCR5 MFI on migrated CD3+ T-cells was specific for CCL5, as there was no reduction seen in T-cells that migrated without added chemokine or in response to CCL2, a non-CCR5 binding chemokine. As demonstrated in Table 2a, endothelial activation significantly facilitated CCL5-driven CD3+ migration with selective migration of CCR5+ cells relative to the input in these series of experiments. The high percentages of CCR5+ T-cells that migrated in response to CCL2 most likely reflect a selective population of CCR2+ CCR5+ CD3+ T-cells. [ ] indicates the mean percentage of input T-cells that migrated in 3 hours, while ( ) indicates the mean percentage of CD3+ T-cells that were CCR5+.
| BBB MODEL | CONDITION | CD3+ | CD3+ CCR5+ | MFI | p-value* |
|---|---|---|---|---|---|
| INPUT | 478,957 | 87,203 (18.21%) | 43.9 | n/a | |
| Basal IVBBB | No Chemokine | 3,419 [0.71%] | 1,059 (31.0%) | 43.8 | n.s. |
| Basal IVBBB | + CCL2 | 10,567 [2.21%] | 7,429 (70.3%) | 42.4 | n.s. |
| Basal IVBBB | + CCL5 | 18,328 [3.83%] | 10,021 (54.7%) | 26.3 | 0.02 |
| aIVBBB | No Chemokine | 5,713 [1.19%] | 2,216 (38.8%) | 42.0 | n.s. |
| aIVBBB | + CCL2 | 26,930 [5.62%] | 19,746 (73.3%) | 41.3 | n.s. |
| aIVBBB | + CCL5 | 33,588 [7.01%] | 18,438 (54.9%) | 26.8 | 0.03 |
indicates that p-values were ascertained relative to the mean input MFI (n=3). Key: aIVBBB: cytokine-activated in vitro blood-brain barrier, IVBBB: in vitro blood-brain barrier.
3.6. CCL5 induces migration of CD3+CCR5+ T-cells across the IVBBB
CCL5 significantly induced the migration of CD3+ T-cells across the basal IVBBB and aIVBBB models, with much higher numbers seen with the aIVBBB (Tables 2 and 3). The mean migration index (defined as the number of cells migrating to a chemokine stimulus divided by the number of cells migrating without added chemokine) to CCL5 for CD3+ T-cells was 3.2 (1.0–8.1) across the basal IVBBB, and 5.7 (1.9–13.6) across the aIVBBB model (Figure 4a). These results provided direct evidence that the aIVBBB enhances CCL5-dependent T-cell migration in vitro. CCL5 also induced the specific migration of CD3+CCR5+ T-cells across both IVBBB models, based on the much higher mean percentages of CCR5+ T-cells that migrated in response to this ligand relative to the input (Table 2a and 3). With the basal IVBBB, the mean migration index for CD3+CCR5+ T-cells to CCL5 was 6.5 (2.3–14.0), increasing to 11.6 (3.9–24.0) with the aIVBBB (Figure 4b). These results demonstrated that CCL5 directly induced the transmigration of receptor-specific CD3+ T-cells through the IVBBB in a process enhanced by endothelial activation.
Figure 4.
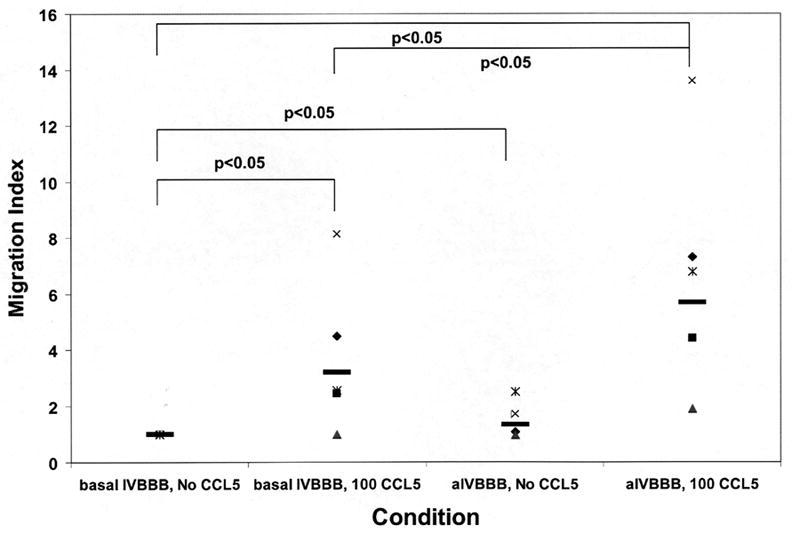
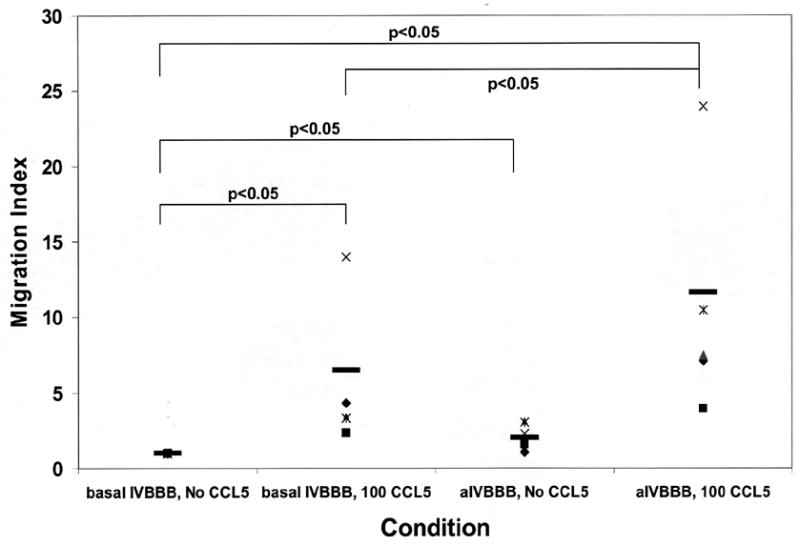
Migration index scatter plots for CCL5-driven T-cell migration across basal IVBBB and aIVBBB. Calcein-AM labeled PBMCs were used for quantification, while parallel transmigration assays using unlabeled PBMCs stained for CD14, CD3 and CCR5 expression were analyzed by flow cytometry as described in the Materials and Methods section. Shown are the CD3+ T-cell migration index data across the basal IVBBB and aIVBBB (Figure 4a) in response to 100 ng/mL CCL5 at 3 hours for five separate experiments using different donors. This demonstrates significantly increased T-cell migration to CCL5. There was also a significant increased migration index of CD3+CCR5+ T-cells (Figure 4b) in response to CCL5 across both models, indicative of efficient migration of receptor positive T-cells. The aIVBBB facilitated increased total and receptor-specific T-cell migration to CCL5 relative to the basal IVBBB. Key: aIVBBB: cytokine-activated in vitro blood-brain barrier, IVBBB: in vitro blood-brain barrier.
4. DISCUSSION
We studied CCL5-driven PBMC migration across the basal IVBBB and aIVBBB in order to decipher CCR5 expression characteristics in migrating mononuclear cells as a means to comprehend receptor expression in inflamed brain tissue. This is important, as CkRs are regulated differently following ligand-receptor interactions [11], and therapeutically modulating the chemokine system would depend on inhibiting ligands, receptors or both, that are required for transmigration or important effector responses within tissues. The BBB has been implicated as the site of initial leukocyte trafficking during neuroinflammatory processes, in contrast to the blood-CSF barrier, which may be more relevant in routine immunosurveillance [3, 41].
We developed an aIVBBB to study CCR5 expression during transmigration in the early stages of neuroinflammation, as endothelial activation influences leukocyte trafficking in vivo. Using concentrations of cytokines present during inflammation in vivo is important, as non-physiological doses may up-regulate inflammatory molecules that are not produced during disease. Furthermore, endothelial cell apoptosis can be induced by cytokines [40, 42], so it is of importance to use cytokine concentrations that maintain the physiologic state of THBMECs without committing them to apoptosis [40]. The effect of cytokine activation on the functional characteristics of the IVBBB is depicted in Figure 5. CCL5 secretion by the aIVBBB augmented the spontaneous migration of CD14+ monocytes and CD3+ T-cells (with increased selectivity of CCR5+ T-cells) relative to the basal IVBBB, with a reduced mean percentage and number of CD14+ CCR5+ monocytes reflecting ligand-induced receptor down-regulation (Table 2a).
Figure 5.
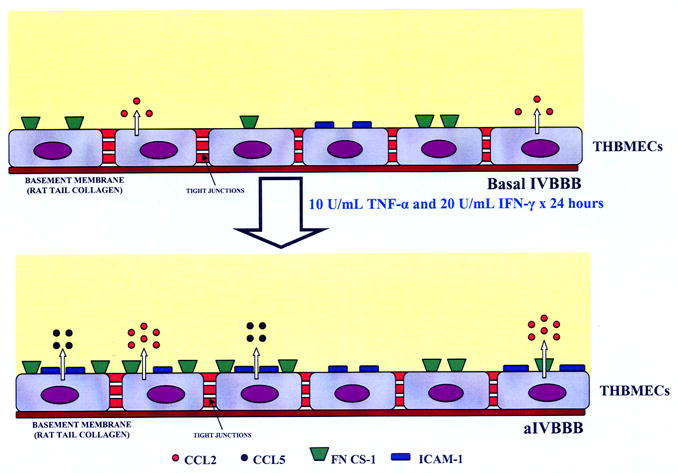
Functional characteristics of the basal IVBBB and aIVBBB. This figure is a schematic illustration of the effects of cytokine-activation on the IVBBB model. Activating subconfluent THBMECs with 10 U/mL TNF-α and 20 U/mL IFN-γ for 24 hours resulted in increased CCL2 secretion from ~600 pg/mL in the basal IVBBB to ~1200 pg/mL in the aIVBBB. There was no detectable CCL5 secretion by the basal IVBBB, increasing to ~900 pg/mL by the aIVBBB. Cytokine activation induced the expression of ICAM-1 (~20% on the basal IVBBB to >90% on the aIVBBB) and FN CS-1 (~50% on the basal IVBBB to >90% on the aIVBBB) on confluent THBMEC layers in vitro. Other studies demonstrate that the physical and biochemical properties of the IVBBB are not affected by these concentrations of cytokines [40]. Key: aIVBBB: cytokine-activated in vitro blood-brain barrier, FN CS-1: fibronectin connecting segment-1, ICAM-1: intercellular adhesion molecule-1, IFN-γ: interferon-γ, IVBBB: in vitro blood-brain barrier, THBMECs: SV-40 T-antigen immortalized human brain microvascular endothelial cells, TNF-α: tissue necrosis factor-α.
We observed CCR5 up-regulation on monocytes during the transmigration assay, suggesting activation of this subpopulation. This activation may have occurred as a consequence of monocyte culture [16], or secondary to monocyte-endothelial interactions during the transmigration assay, or both. The process of migration, in itself, did not induce monocyte CCR5 expression in this study, as CCL2-driven transmigration did not up-regulate CCR5. There was no change on CCR5 expression on T-cells during the transmigration assays without added chemokine, suggesting differential regulation of CCR5 in these mononuclear cell subpopulations. CCR5 down-regulation occurred on both monocytes (based on the numbers of receptor-positive cells) and T-cells (based on MFI, a marker of receptor density) following CCL5-driven migration, suggesting that CCL5-CCR5 interactions occurred during monocyte and T-cell migration across the IVBBB.
The down-regulation of CCR5 expression on monocytes and T-cells in vitro following CCL5 interaction was due to receptor internalization, as CCR5 down-regulation was inhibited by incubation at 4°C. The partial down-regulation in CCR5 following PBMC migration to CCL5 across the IVBBB is not incompatible with the presence of CCR5+ mononuclear cells in the perivascular space and in chronic active MS lesions. CCR5 recycling back to the cell surface after initial receptor internalization occurs and may increase following ligand sequestration [8, 11]. It is also possible that pro-inflammatory cytokines and chemokines produced by astrocytes, microglia and early infiltrating leukocytes may activate infiltrating monocytes within the brain parenchyma, resulting in de novo CCR5 synthesis with subsequent increased surface expression on monocytes/macrophages. In addition, we also demonstrated enrichment of CD3+ CCR5+ T-cells on the abluminal side of the IVBBB in response to CCL5, consistent with observations in the perivascular spaces of MS lesions [36, 37, 39].
Results of this study suggest that CCR5+ monocytes and T-cells are selectively recruited during the acute phases of neuroinflammation. We have previously demonstrated that function-neutralizing monoclonal antibodies to CCR5 significantly reduced CCL5-driven PBMC migration across the aIVBBB [40]. These observations suggest that systemically active CCR5 antagonists may modulate pathogenic mononuclear cell entry into the brain during neuroinflammation. However, drugs capable of crossing the BBB (with lipophilic properties to facilitate retention with the parenchyma) may be required to modulate the proposed chronic pathogenic effects of CCR5+ monocytes in active MS lesions [43].
This study emphasizes the importance of studying individual CkR expression during neuroinflammation, as a means of understanding their pathogenic roles. Previous work in our laboratory has shown that CCR2 might be important for the early transmigration of receptor-positive monocytes and T-cells through the IVBBB, with CCL2 consumption by migrating mononuclear cells occurring in conjunction with receptor down-regulation in vitro [24]. This work provides an explanation for the reduced mononuclear cell CCR2 surface expression in MS lesions and reduced CSF CCL2 levels in MS patients during active disease [26–28]. We have also shown that CXCR3 is a surface marker for CD4+ T-cells capable of undergoing transmigration in vitro and have postulated that it does not play an active role in T-cell transmigration in vivo, despite being present on virtually all perivascular CD4+ T-cells in MS, as collaborated by observations in EAE using CXCR3 knockout mice [25, 31, 39, 44].
The differential expression of CCR5 on monocytes and T-cells further highlights the complexity of CkR regulation. The complexities of CCR5 expression vary between species, cell types and causes and stages of inflammation [8, 11, 45], which in addition to the redundancy in the chemokine system, may explain conflicting data on the role of CCR5 and its ligands in neuroinflammation. Cross-regulation of CCR5 with other CkRs or non-chemokine GPCRs expressed on the same leukocytes may occur during inflammation, as these receptors may be engaged simultaneously or sequentially by multiple mediators [8]. Such heterologous regulation (desensitization or internalization) of CCR5, dependent on second messenger-activated protein kinases [8, 46], adds further complexity to the expression of this receptor in vivo.
There were some study limitations. The analysis of chemokine-mediated IVBBB mononuclear cell transmigration was performed under static conditions, rather than under the influence of flow as seen in vivo. This may account for the rather high spontaneous monocyte migration (without added chemokines) and could limit the extrapolation of the observations derived from these IVBBB models to in vivo neuroinflammation. The development of a flow-dependent IVBBB mimicking the hydrodynamics of the cerebral microvasculature would allow the assessment of CCL5-driven PBMC migration under more physiologic conditions ex vivo.
Parallel experiments quantifying migrating PBMCs fluorometrically with staining for surface markers were performed using aliquots of calcein-AM labeled or unlabeled PBMCs from the same donor at the same time, as previously published [40]. Although this technique resulted in highly reproducible data, minor variations could have occurred resulting in measurement error of the absolute numbers derived for subpopulation quantification. Comparative data expression (e.g. migration indices) circumvents the potential effect of such errors. In addition, tissue culture and leukocyte manipulation may cause CkR dysregulation [3]. Hence, it is possible that cellular manipulation ex vivo during density centrifugation or calcein-AM labeling may affect CCR5 expression or function. However, there was no down-regulation in monocyte or T-cell CkR expression over the time interval required for calcein-AM labeling and the kinetics of CCL5-driven PBMC migration was consistent with previously described models of chemokine-driven migration ex vivo (data not shown) [24, 40]. Caution is required, however, in extrapolating in vitro observations of CkR expression to the in vivo situation during neuroinflammation.
This study demonstrates the differential expression of CCR5 on monocytes and T-cells migrating in response to CCL5 across the IVBBB andadds further knowledge on the potential roles of this CkR in neuroinflammation. This study, coupled with our previous work, predicts that efficacious CCR5 blockade in MS may require a drug that is bothsystemically active (to inhibit predominantly T-cell and a subset of monocyte infiltration) and has good CNS penetrance (to modulate the proposed chronic effects of activated monocytes and macrophages within lesions). Such blockade may simultaneously reduce trafficking of immune effector mononuclear cells across the BBB into the CNS and limit their pathogenic functions within the brain parenchyma during inflammation.
The IVBBB model provides an avenue for directly studying leukocyte migration to chemokines implicated in neuroinflammation, as in vivo studies either assess leukocyte adhesion in animal models (i.e. intravital microscopy) or study chronically infiltrated leukocytes in brain tissue of animal models or human autopsy cases. Further studies are needed to examine the roles of other CkRs during neuroinflammation (such as CCR1 and CXCR4), the potential role(s) of heterologous receptor modulation on CkR expression, as well as translating the knowledge derived from this and similar studies into therapeutic clinical trials for neuroinflammatory disorders, including MS.
Acknowledgments
This research was supported in part by National Institutes of Health grant P01 NS38667 (to RMR) and a fellowship (to MKC) from the National Multiple Sclerosis Society. The paper was presented in part in abstract form at the 131st Annual Meeting of the American Neurological Association, October 2006.
Footnotes
Publisher's Disclaimer: This is a PDF file of an unedited manuscript that has been accepted for publication. As a service to our customers we are providing this early version of the manuscript. The manuscript will undergo copyediting, typesetting, and review of the resulting proof before it is published in its final citable form. Please note that during the production process errors may be discovered which could affect the content, and all legal disclaimers that apply to the journal pertain.
References
- 1.Appay V, Rowland-Jones SL. Trends Immunol. 2001;22:83–87. doi: 10.1016/s1471-4906(00)01812-3. [DOI] [PubMed] [Google Scholar]
- 2.Schall TJ. Cytokine. 1991;3:165–183. doi: 10.1016/1043-4666(91)90013-4. [DOI] [PubMed] [Google Scholar]
- 3.Ubogu EE, Cossoy MB, Ransohoff RM. Trends Pharmacol Sci. 2006;27:48–55. doi: 10.1016/j.tips.2005.11.002. [DOI] [PubMed] [Google Scholar]
- 4.Glass WG, McDermott DH, Lim JK, Lekhong S, Yu SF, Frank WA, Pape J, Cheshier RC, Murphy PM. J Exp Med. 2006;203:35–40. doi: 10.1084/jem.20051970. [DOI] [PMC free article] [PubMed] [Google Scholar]
- 5.Huang Y, Paxton WA, Wolinsky SM, Neumann AU, Zhang L, He T, Kang S, Ceradini D, Jin Z, Yazdanbakhsh K, Kunstman K, Erickson D, Dragon E, Landau NR, Phair J, Ho DD, Koup RA. Nat Med. 1996;2:1240–1243. doi: 10.1038/nm1196-1240. [DOI] [PubMed] [Google Scholar]
- 6.Liu R, Paxton WA, Choe S, Ceradini D, Martin SR, Horuk R, MacDonald ME, Stuhlmann H, Koup RA, Landau NR. Cell. 1996;86:367–377. doi: 10.1016/s0092-8674(00)80110-5. [DOI] [PubMed] [Google Scholar]
- 7.Samson M, Libert F, Doranz BJ, Rucker J, Liesnard C, Farber CM, Saragosti S, Lapoumeroulie C, Cognaux J, Forceille C, Muyldermans G, Verhofstede C, Burtonboy G, Georges M, Imai T, Rana S, Yi Y, Smyth RJ, Collman RG, Doms RW, Vassart G, Parmentier M. Nature. 1996;382:722–725. doi: 10.1038/382722a0. [DOI] [PubMed] [Google Scholar]
- 8.Oppermann M. Cell Signal. 2004;16:1201–1210. doi: 10.1016/j.cellsig.2004.04.007. [DOI] [PubMed] [Google Scholar]
- 9.Signoret N, Hewlett L, Wavre S, Pelchen-Matthews A, Oppermann M, Marsh M. Mol Biol Cell. 2005;16:902–917. doi: 10.1091/mbc.E04-08-0687. [DOI] [PMC free article] [PubMed] [Google Scholar]
- 10.Mueller A, Strange PG. Eur J Biochem. 2004;271:243–252. doi: 10.1046/j.1432-1033.2003.03918.x. [DOI] [PubMed] [Google Scholar]
- 11.Neel NF, Schutyser E, Sai J, Fan GH, Richmond A. Cytokine Growth Factor Rev. 2005;16:637–658. doi: 10.1016/j.cytogfr.2005.05.008. [DOI] [PMC free article] [PubMed] [Google Scholar]
- 12.Pitcher JA, Freedman NJ, Lefkowitz RJ. Annu Rev Biochem. 1998;67:653–692. doi: 10.1146/annurev.biochem.67.1.653. [DOI] [PubMed] [Google Scholar]
- 13.Mueller A, Kelly E, Strange PG. Blood. 2002;99:785–791. doi: 10.1182/blood.v99.3.785. [DOI] [PubMed] [Google Scholar]
- 14.Pierce KL, Lefkowitz RJ. Nat Rev Neurosci. 2001;2:727–733. doi: 10.1038/35094577. [DOI] [PubMed] [Google Scholar]
- 15.Venkatesan S, Rose JJ, Lodge R, Murphy PM, Foley JF. Mol Biol Cell. 2003;14:3305–3324. doi: 10.1091/mbc.E02-11-0714. [DOI] [PMC free article] [PubMed] [Google Scholar]
- 16.Trebst C, Sorensen TL, Kivisakk P, Cathcart MK, Hesselgesser J, Horuk R, Sellebjerg F, Lassmann H, Ransohoff RM. Am J Pathol. 2001;159:1701–1710. doi: 10.1016/s0002-9440(10)63017-9. [DOI] [PMC free article] [PubMed] [Google Scholar]
- 17.Kantarci OH, Morales Y, Ziemer PA, Hebrink DD, Mahad DJ, Atkinson EJ, Achenbach SJ, De Andrade M, Mack M, Ransohoff RM, Lassmann H, Bruck W, Weinshenker BG, Lucchinetti CF. J Neuroimmunol. 2005;169:137–143. doi: 10.1016/j.jneuroim.2005.07.025. [DOI] [PubMed] [Google Scholar]
- 18.Silversides JA, Heggarty SV, McDonnell GV, Hawkins SA, Graham CA. Mult Scler. 2004;10:149–152. doi: 10.1191/1352458504ms994oa. [DOI] [PubMed] [Google Scholar]
- 19.Tran EH, Kuziel WA, Owens T. Eur J Immunol. 2000;30:1410–1415. doi: 10.1002/(SICI)1521-4141(200005)30:5<1410::AID-IMMU1410>3.0.CO;2-L. [DOI] [PubMed] [Google Scholar]
- 20.Glass WG, Hickey MJ, Hardison JL, Liu MT, Manning JE, Lane TE. J Immunol. 2004;172:4018–4025. doi: 10.4049/jimmunol.172.7.4018. [DOI] [PubMed] [Google Scholar]
- 21.Glass WG, Liu MT, Kuziel WA, Lane TE. Virology. 2001;288:8–17. doi: 10.1006/viro.2001.1050. [DOI] [PMC free article] [PubMed] [Google Scholar]
- 22.dos Santos AC, Barsante MM, Esteves Arantes RM, Bernard CC, Teixeira MM, Carvalho-Tavares J. J Neuroimmunol. 2005;162:122–129. doi: 10.1016/j.jneuroim.2005.01.020. [DOI] [PubMed] [Google Scholar]
- 23.Gade-Andavolu R, Comings DE, MacMurray J, Vuthoori RK, Tourtellotte WW, Nagra RM, Cone LA. Mult Scler. 2004;10:536–539. doi: 10.1191/1352458504ms1080oa. [DOI] [PubMed] [Google Scholar]
- 24.Mahad D, Callahan MK, Williams KA, Ubogu EE, Kivisakk P, Tucky B, Kidd G, Kingsbury GA, Chang A, Fox RJ, Mack M, Sniderman MB, Ravid R, Staugaitis SM, Stins MF, Ransohoff RM. Brain. 2006;129:212–223. doi: 10.1093/brain/awh655. [DOI] [PubMed] [Google Scholar]
- 25.Callahan MK, Williams KA, Kivisakk P, Pearce D, Stins MF, Ransohoff RM. J Neuroimmunol. 2004;153:150–157. doi: 10.1016/j.jneuroim.2004.05.004. [DOI] [PubMed] [Google Scholar]
- 26.Mahad DJ, Howell SJ, Woodroofe MN. J Neurol Neurosurg Psychiatry. 2002;72:498–502. doi: 10.1136/jnnp.72.4.498. [DOI] [PMC free article] [PubMed] [Google Scholar]
- 27.Bartosik-Psujek H, Stelmasiak Z. Eur J Neurol. 2005;12:49–54. doi: 10.1111/j.1468-1331.2004.00951.x. [DOI] [PubMed] [Google Scholar]
- 28.Sorensen TL, Sellebjerg F, Jensen CV, Strieter RM, Ransohoff RM. Eur J Neurol. 2001;8:665–672. doi: 10.1046/j.1468-1331.2001.00327.x. [DOI] [PubMed] [Google Scholar]
- 29.Izikson L, Klein RS, Charo IF, Weiner HL, Luster AD. J Exp Med. 2000;192:1075–1080. doi: 10.1084/jem.192.7.1075. [DOI] [PMC free article] [PubMed] [Google Scholar]
- 30.Fife BT, Huffnagle GB, Kuziel WA, Karpus WJ. J Exp Med. 2000;192:899–905. doi: 10.1084/jem.192.6.899. [DOI] [PMC free article] [PubMed] [Google Scholar]
- 31.Liu L, Huang D, Matsui M, He TT, Hu T, Demartino J, Lu B, Gerard C, Ransohoff RM. J Immunol. 2006;176:4399–4409. doi: 10.4049/jimmunol.176.7.4399. [DOI] [PubMed] [Google Scholar]
- 32.Mack M, Bruhl H, Gruber R, Jaeger C, Cihak J, Eiter V, Plachy J, Stangassinger M, Uhlig K, Schattenkirchner M, Schlondorff D. Arthritis Rheum. 1999;42:981–988. doi: 10.1002/1529-0131(199905)42:5<981::AID-ANR17>3.0.CO;2-4. [DOI] [PubMed] [Google Scholar]
- 33.Sorensen TL, Sellebjerg F. Neurology. 2001;57:1371–1376. doi: 10.1212/wnl.57.8.1371. [DOI] [PubMed] [Google Scholar]
- 34.Martinez-Caceres EM, Espejo C, Brieva L, Pericot I, Tintore M, Saez-Torres I, Montalban X. Mult Scler. 2002;8:390–395. doi: 10.1191/1352458502ms841oa. [DOI] [PubMed] [Google Scholar]
- 35.Strunk T, Bubel S, Mascher B, Schlenke P, Kirchner H, Wandinger KP. Ann Neurol. 2000;47:269–273. [PubMed] [Google Scholar]
- 36.Sorensen TL, Tani M, Jensen J, Pierce V, Lucchinetti C, Folcik VA, Qin S, Rottman J, Sellebjerg F, Strieter RM, Frederiksen JL, Ransohoff RM. J Clin Invest. 1999;103:807–815. doi: 10.1172/JCI5150. [DOI] [PMC free article] [PubMed] [Google Scholar]
- 37.Simpson J, Rezaie P, Newcombe J, Cuzner ML, Male D, Woodroofe MN. J Neuroimmunol. 2000;108:192–200. doi: 10.1016/s0165-5728(00)00274-5. [DOI] [PubMed] [Google Scholar]
- 38.Teleshova N, Pashenkov M, Huang YM, Soderstrom M, Kivisakk P, Kostulas V, Haglund M, Link H. J Neurol. 2002;249:723–729. doi: 10.1007/s00415-002-0699-z. [DOI] [PubMed] [Google Scholar]
- 39.Balashov KE, Rottman JB, Weiner HL, Hancock WW. Proc Natl Acad Sci U S A. 1999;96:6873–6878. doi: 10.1073/pnas.96.12.6873. [DOI] [PMC free article] [PubMed] [Google Scholar]
- 40.Ubogu EE, Callahan MK, Tucky BH, Ransohoff RM. J Neuroimmunol. 2006;179:132–144. doi: 10.1016/j.jneuroim.2006.06.004. [DOI] [PubMed] [Google Scholar]
- 41.Ransohoff RM, Kivisakk P, Kidd G. Nat Rev Immunol. 2003;3:569–581. doi: 10.1038/nri1130. [DOI] [PubMed] [Google Scholar]
- 42.Wong D, Dorovini-Zis K, Vincent SR. Exp Neurol. 2004;190:446–455. doi: 10.1016/j.expneurol.2004.08.008. [DOI] [PubMed] [Google Scholar]
- 43.Matsui M, Weaver J, Proudfoot AE, Wujek JR, Wei T, Richer E, Trapp BD, Rao A, Ransohoff RM. J Neuroimmunol. 2002;128:16–22. doi: 10.1016/s0165-5728(02)00121-2. [DOI] [PubMed] [Google Scholar]
- 44.Sorensen TL, Trebst C, Kivisakk P, Klaege KL, Majmudar A, Ravid R, Lassmann H, Olsen DB, Strieter RM, Ransohoff RM, Sellebjerg F. J Neuroimmunol. 2002;127:59–68. doi: 10.1016/s0165-5728(02)00097-8. [DOI] [PubMed] [Google Scholar]
- 45.Mahad DJ, Trebst C, Kivisakk P, Staugaitis SM, Tucky B, Wei T, Lucchinetti CF, Lassmann H, Ransohoff RM. J Neuropathol Exp Neurol. 2004;63:262–273. doi: 10.1093/jnen/63.3.262. [DOI] [PubMed] [Google Scholar]
- 46.Ali H, Richardson RM, Haribabu B, Snyderman R. J Biol Chem. 1999;274:6027–6030. doi: 10.1074/jbc.274.10.6027. [DOI] [PubMed] [Google Scholar]


