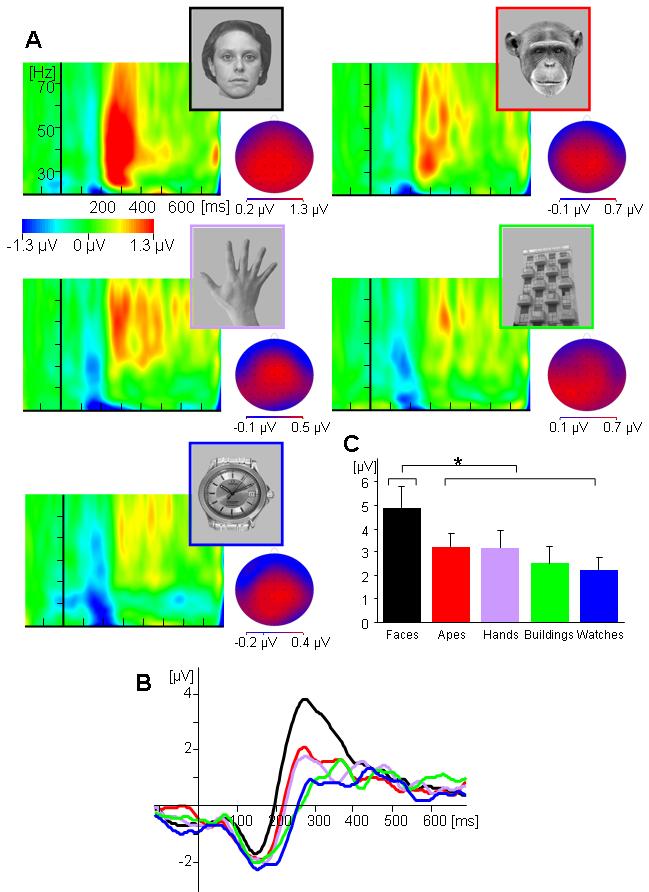
Figure 2.

iGBA activity elicited by the five stimulus categories (A) Time-frequency plots from mid-posterior electrode Pz for human faces, ape faces, human hands, buildings and watches. The scalp distributions of iGBA are presented for all categories, at the latency of their respective maximal peak; note that whereas the same scale is used for the time-frequency plots, different scales are used for each distribution to allow visualization. (B) The time course of the iGBA amplitude (averaged over 20-80Hz) for each stimulus category. (C) Mean iGBA amplitudes for each stimulus category, as measured from the maximal peaks.
