Abstract
We demonstrate remote detection of nuclear magnetic resonance (NMR) with a microchip sensor consisting of a microfluidic channel and a microfabricated vapor cell (the heart of an atomic magnetometer). Detection occurs at zero magnetic field, which allows operation of the magnetometer in the spin-exchange relaxation-free (SERF) regime and increases the proximity of sensor and sample by eliminating the need for a solenoid to create a leading field. We achieve pulsed NMR linewidths of 26 Hz, limited, we believe, by the residence time and flow dispersion in the encoding region. In a fully optimized system, we estimate that for 1 s of integration, 7 × 10¹³ protons in a volume of 1 mm3, prepolarized in a 10-kG field, can be detected with a signal-to-noise ratio of ≈3. This level of sensitivity is competitive with that demonstrated by microcoils in 100-kG magnetic fields, without requiring superconducting magnets.
Keywords: microfluidics, signal-to-noise ratio, mass-limited sample
Remote detection of nuclear magnetic resonance (NMR) (1), in which polarization, encoding or evolution, and detection are spatially separated, has recently attracted considerable attention in the context of magnetic resonance imaging (2), microfluidic flow profiling (3, 4), and spin-labeling (5). Detection can be performed with superconducting quantum interference devices (SQUIDs), inductively at high field as in refs. 3–5 or with atomic magnetometers as in ref. 2. To most efficiently detect the flux from the nuclear sample, it is typically necessary to match the physical dimensions of the sensor and the sample. Thus, small, sensitive detectors of magnetic flux reduce the detection volume, thereby reducing the quantity of analyte. Microfabricated atomic magnetometers (6) with sensor dimensions on the order of 1 mm operating in the spin-exchange relaxation-free (SERF) regime (8) have recently demonstrated sensitivities of (7), with projected theoretical sensitivities several orders of magnitude higher. (In this article, we use Gaussian units; 1 nG = 100 fT.)
In this work, we demonstrate remote detection of pulsed and continuous-wave (CW) NMR with a compact sensor assembly consisting of an alkali vapor cell and microfluidic channel, fabricated with lithographic patterning and etching of silicon. We realize pulsed NMR linewidths of ≈26 Hz, limited, we believe, by residence time and flow dispersion in the encoding region. Estimates of the fundamental sensitivity limit for an optimized system, assuming a modest 10-kG prepolarizing field, indicate detection limits competitive with those demonstrated by microcoils in superconducting magnets (9–14). Hence, the technique described here offers a promising solution to NMR of mass-limited samples—for example, in the screening of new drugs—without requiring superconducting magnets.
The atomic magnetometer operates in the SERF regime (achieved when the Larmor precession frequency is small compared with the spin exchange rate), currently the most sensitive technique in atomic magnetometry. Optical pumping and probing of the alkali vapor are accomplished with a single laser beam (7). In addition to integration of sensor and microfluidic channel on a single chip, a key feature distinguishing the present work from previous applications of atomic magnetometers to the detection of NMR (15, 16) or MRI (2) is that the detection region (both magnetometer and nuclear sample) is at zero magnetic field. This eliminates the need for a solenoid around the detection region (along with the associated noise) and increases the proximity of sensor and sample. A secondary advantage of having both sensor and sample at zero field is that it is the only point at which the Zeeman resonance frequencies of both alkali and nuclear spins coincide, yielding sensitivity to all three components of the nuclear magnetization. This may prove important for the development of new algorithms for efficient remote detection.
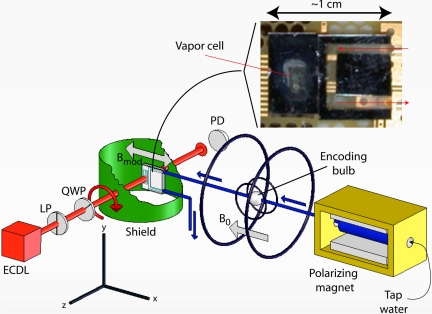
The experimental setup is shown in Fig. 1. Tap water flows through 800-μm-inner-diameter Teflon tubes from a reservoir in a prepolarizing field to an encoding region and finally through the microchip, which is housed inside a four-layer set of magnetic shields. The prepolarizing field is provided by a 7-kG permanent magnet, and the volume of the reservoir is ≈10 cm3, large enough that the water spends several longitudinal relaxation times (T1) in the prepolarization field. The encoding region consists of a bulb ≈4 mm in diameter and a Helmholtz coil used to apply audio frequency (AF) pulses. An anti-Helmholtz coil was used to shim longitudinal gradients of the ambient magnetic field in our laboratory (≈250 mG) to a uniformity of ≈1 mG over a 5-cm baseline. For the present set of measurements, the flow rate was ≈1.5 ml/s, so that the time required to fill and empty the bulb was approximately τres = 22 ms and the distance from the encoding region to the detection region was ≈50 cm.
Fig. 1.
Experimental setup (components are not drawn to scale). Water flows from a reservoir inside a 7-kG permanent magnet through the encoding region where there is a Helmholtz coil used to apply AF (≈1 kHz) pulses. The water subsequently flows into a channel with dimensions of ≈1 × 2 × 3 mm3 adjacent to a microfabricated atomic-magnetometer vapor cell containing Cs and 5,000 torr of N2. The sensor assembly is housed inside of a four-layer set of magnetic shields, only one of which is shown here. (Inset) Photograph of a prototype device before the ITO heaters were installed. The device used for the measurements presented in this work had a larger fluid channel than that pictured here. ECDL, external cavity diode laser; LP, linear polarizer; QWP, quarter wave plate; PD, photodiode.
The sensor chip consists of a vapor cell (the atomic magnetometer) and channel constructed by anodically bonding glass to a 1-mm-thick etched Si substrate. The transverse dimensions of the vapor cell and fluid channel are both ≈2 × 3 mm. The fabrication techniques are described in more detail in ref. 17. The vapor cell contains 5,000 torr of N2 buffer gas and Cs, chosen primarily because its saturated vapor pressure is higher than that of K or Rb, allowing operation of the sensor at lower temperatures. The vapor cell is sandwiched between two indium tin-oxide (ITO) resistive heaters. The heaters, powered by DC current (AC current caused several heaters to crack for unknown reasons), saturated the magnetometer, necessitating cycling of the heaters on and off. When the heaters were off, considerable (repeatable) drift in magnetometer signal occurred due to temperature drift; hence, alternate measurement periods were used for the acquisition of the NMR signal and recording of background drift. To optimize the magnetometer, the current in the heaters was adjusted until the cell comprised approximately one absorption length. We did not measure the temperature directly; however, from absorption measurements and known rates of pressure broadening, we estimate that the Cs density was ≈1014 cm−3, corresponding to a temperature of ≈135°C. A circularly polarized laser beam, tuned to the center of the pressure-broadened D1 line, propagates through the cell and is monitored at the output with a photodiode. Optical pumping by the light produces orientation in the z direction, Pz, and correspondingly, the absorption coefficient for the light is approximately proportional to 1 − Pz. A magnetic field in the x direction induces precession of the orientation into the y direction, and accordingly, the atomic vapor starts to absorb the light.
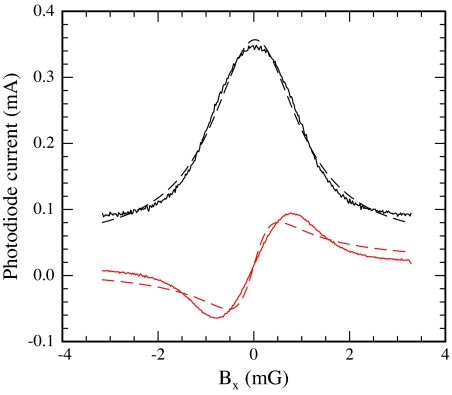
The black trace in Fig. 2 shows the photocurrent as a function of the magnetic field Bx. The slope of the photocurrent as a function of magnetic field is zero for B = 0. To convert the absorptive line into a dispersive line with large slope at zero field, an 800-Hz modulation is applied to the x component of the magnetic field, with amplitude Bm approximately equal to the width of the resonance. The only constraint on the modulation frequency is that it is small compared with the spin-destruction rate; 800 Hz was chosen because optical noise was minimized. An offset in the x component of the magnetic field appears in the first harmonic of the light transmission, with dispersive lineshape shown by the red trace in Fig. 2. Noise in the first harmonic corresponded to a magnetic field sensitivity of at 6 Hz, limited, we suspect, by laser-intensity fluctuations.
Fig. 2.
Transmission of light through the cell (black trace) as a function of Bx and resulting first harmonic (red trace) as a function of Bx when a rapid modulation is applied. The black and red dashed lines overlaying the data are fits to absorptive and dispersive Lorentzians, respectively.
In the present configuration, the magnetometer is primarily sensitive to Bx. Because the line between the sample and magnetometer lies along the x direction, the signal is dominated by the x component of the magnetization. In general, magnetometers operating at zero field are vector sensors, sensitive to all three components (see, e.g., ref. 18, where operation of a three-axis magnetometer was demonstrated by using two orthogonal pump and probe beams). In the current configuration, sensitivity to both x and y components of the field could be achieved by applying modulations to the field in the x and y directions at different frequencies.
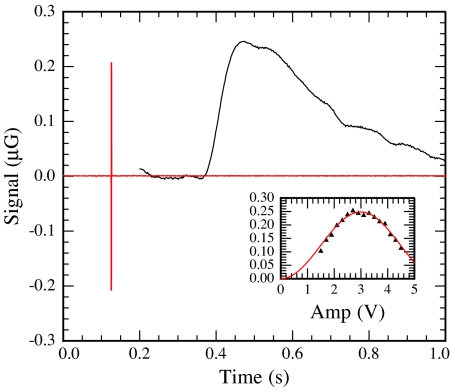
The magnetometer signal resulting from a single π pulse in the encoding region is shown in Fig. 3, the shape of which is determined by flow dispersion in transit from the encoding volume to the detection volume, as well as T1 relaxation. The amplitude of the π pulse was calibrated by recording the peak signal as a function of pulse amplitude (shown in Fig. 3 Inset).
Fig. 3.
Magnetic field due to water in detection region (black trace) following a π pulse in the encoding region (red trace). Data shown here are the result of averaging over ≈10 π pulses. (Inset) Peak signal as a function of AF amplitude to calibrate the π pulses. Units on the vertical axis are the same as those in the main figure.
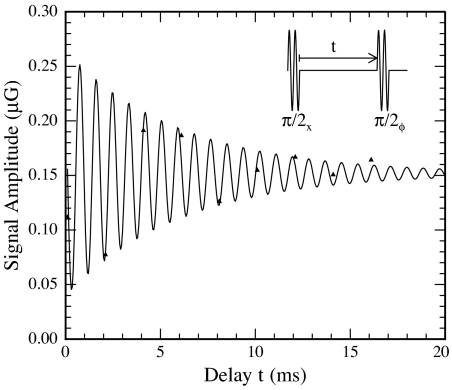
The free induction decay of water in the encoding region can be observed via a variant of phase encoding. We apply a set of two π/2 pulses separated by an interval t (defined by the time between the end of the first pulse and the beginning of the second, as shown in Fig. 4Inset). Each pulse was two periods long, starting and ending at zero, and hence the phase of the second pulse differed from the phase of the first by an amount linear in the delay between the pulses. The first pulse rotates the magnetization into the transverse direction. After evolution in the ambient laboratory field for time t, the phase of the transverse magnetization (relative to the laboratory reference frame) is stored in the longitudinal component by applying the second π/2 pulse. The longitudinal component of M is then subsequently detected by the atomic magnetometer.
Fig. 4.
Free induction decay observed by applying two π/2 pulses separated by a delay. Overlaying the data is a fit to a numerical model that includes the finite length of the pulses and counter-rotating components of the AF, yielding T2 = 6 ms.
The amplitude of the resulting signals as a function of the delay t is shown in Fig. 4 (triangles). The signal amplitude is determined as follows. The flow profile in Fig. 3 following a π pulse is normalized so that the peak value is 1 and fit to a spline, resulting in a function fπ(t). Using the parameters extracted from this initial fit, we then fit the signal following a pulse sequence to afπ(t) with only the signal amplitude a as the free parameter. The solid line overlaying the data in Fig. 4 is a fit to a numerical model that includes the effects of finite pulse length and counter-rotating components of the applied AF magnetic field. Parameters in the fit are the initial signal amplitude S0, the Larmor precession frequency ν0, and the transverse relaxation time T2. The phase of the signal is determined by the detuning of the AF from the Larmor precession frequency. We find ν0 = 1,157 Hz and T2 = 6.0 ms corresponding to Δν ≡ 1/(2πT2) = 26 Hz. The sampling interval for these measurements was 2 ms, yielding a Nyquist frequency of 250 Hz, not sufficient to fully resolve Larmor precession in the neighborhood of 1 kHz. However, from measurements of the laboratory field and from CW NMR measurements (see below), the resonant frequency can be constrained to ≈1,100–1,200 Hz, and hence we are confident in the values of the parameters obtained from the fit.
We estimate the spread in Larmor frequencies due to measured magnetic field gradients to be approximately Δνg = 0.3 Hz, far too small to account for the observed width. Broadening due to the finite residence time in the encoding region is difficult to calculate because of flow dispersion. A minimum value is ≈1/(2πτres) = 7 Hz, approximately a factor of 4 smaller than the measured width, illustrating the importance of minimizing dispersion for high-resolution remotely detected NMR. We anticipate that significantly narrower lines will result from better control over dispersion.
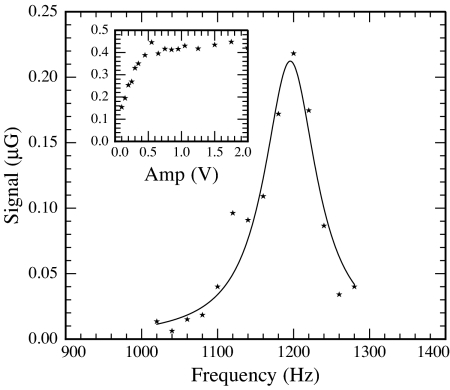
NMR can also be observed by continuous application of AF magnetic field in the encoding region. The resulting signal as a function of frequency is shown in Fig. 5 for relatively weak AF. Fig. 5 Inset shows the dependence of the signal on the amplitude of the AF for ν − ν0 ≈ 0. The signal saturates for large AF amplitude because of the broad range of residence times in the encoding region due to dispersion. To minimize AF power broadening, the data in Fig. 5 were taken for the smallest applied amplitude of AF shown in Fig. 5 Inset, corresponding to B1 ≈ 4 mG in the rotating frame. Overlaying the data is a fit to an absorptive Lorentzian with half-width at half-maximum Δν = 42 ± 3 Hz. We suspect that the difference in linewidths obtained by pulsed and CW NMR is due to AF power broadening in conjunction with dispersion-induced variation in residence times in the encoding region.
Fig. 5.
Magnetometer signal for continuous application of weak AF in encoding region as a function of frequency. The solid line overlaying the data is a fit to an absorptive Lorentzian, resulting in a half-width at half-maximum Δν = 43 Hz. (Inset) Signal as a function of amplitude of the AF, tuned to resonance (units on the vertical axis are the same as those in the main figure). The data in the main figure were obtained at the minimum amplitude value of applied AF shown in Inset.
We now turn to an optimization of remote detection of NMR with the presently considered device, beginning with an estimate of the theoretical sensitivity of the atomic magnetometer to magnetic fields created by the polarized nuclei. The sensitivity of the magnetometer is fundamentally limited by spin-projection noise (see, e.g., ref. 19) , where gs ≈ 2, μB is the Bohr magneton, V is the volume of the sensor, Γ is the alkali relaxation rate, and τ is the measurement time. For sufficiently high alkali densities, binary alkali–alkali spin-destruction collisions dominate the relaxation rate, and spin-projection noise approaches an asymptote given by
 |
where v̄ is the mean relative velocity of colliding alkali atoms and σsd is the alkali–alkali spin-destruction cross-section. Prefactors of order unity in the right-hand side of Eq. 1 depend on the particulars of the pumping and probing scheme. If the sensor and sample are the same size and are separated by a small distance, the magnetic field the sensor experiences is approximately equal to the magnetization M. The thermal magnetization of protons in a prepolarizing field Bp is M = μp2(Np/V) Bp/kT, where μp is the proton magnetic moment and Np is the total number of protons in volume V. Hence, from Eq. 1, a signal-to-noise ratio of 3 or greater requires a minimum number of protons
 |
To obtain concrete numbers, we assume a model device with sensor and sample both of volume V = 1 mm3 and use spin-destruction cross-sections appropriate for Rb [σsd = 9 × 10⁻¹⁸ cm2 (20), approximately a factor of 20 smaller than that of Cs (21)]. The contribution to relaxation from collisions with the cell walls and buffer gas atoms can be significant (we estimate that the contribution to the relaxation rate from wall and buffer gas collisions reaches a minimum value of ≈3,000 s−1 with ≈4,000 torr of N2 buffer gas in a 1-mm3 Rb vapor cell), and hence, to reach the asymptotic limit of magnetometric sensitivity given by Eq. 1, Rb number densities of ≈7 × 1015 cm−3 are required, corresponding to operating temperatures of ≈250°C. (For such high alkali densities, the cell under consideration comprises ≈40 absorption lengths, in which case it may be necessary to monitor optical rotation of a separate probe beam tuned far off resonance.) Under these conditions, with a prepolarizing field of Bp = 10 kG, Eq. 2 gives a detection limit of approximately δNp ≈ 7 × 10¹³ protons or ≈120 pmol (corresponding to a concentration of 120 μM) for τ = 1 s of integration. This is competitive with the detection limit demonstrated by microcoils in high magnetic fields (see, e.g., ref. 14, in which ≈5 × 10¹³ protons were detected with a signal-to-noise ratio of 1 in 1 s of integration in a 383-MHz superconducting magnet).
The magnetometric sensitivity required to reach the fundamental detection limit for the conditions stated above is , approximately 3 orders of magnitude better than that achieved in this work. Realizing this level of sensitivity is admittedly quite challenging and will likely require advanced techniques in magnetic shielding (see, e.g., ref. 22) and ultra-low-noise lasers. Monitoring optical rotation of a separate, far off resonant probe beam (necessary to efficiently probe an optically thick vapor cell such as that considered above) has the additional advantage that noise due to laser intensity fluctuations can be canceled out. By virtue of the dependence in Eq. 2, smaller magnetometers operating at higher temperatures could lead to further improvements in sensitivity. However, at sufficiently high temperatures, alkali atoms begin to react with the glass, which will place a lower bound on the volumes over which Eq. 2 is valid.
Mapping of transverse components of the magnetization onto the longitudinal component, as in the present work, results in an interesting consequence for signal acquisition when integration times are long compared with T1. Consider a remote phase-encoding experiment in which one wishes to collect N data points of a free induction decay using a detector with sensitivity ρr (with units ). We assume that a stop-flow arrangement is used so that fluid can reside in the detection region for as long as we wish but can be transferred from the encoding region to the detection region in a time short compared with T1. The signal in the detection region following a phase encoding sequence that results in a longitudinal component of magnetization M‖ is then M‖e−t/T1. It is straightforward to show that the optimal signal-to-noise ratio is obtained for a measurement time equal to t = 1.25 T1 resulting in an uncertainty of the phase encoded amplitude . After acquiring a single point, the fluid must be repolarized so that the time required to measure a single point is κT1, where κ is a dimensionless parameter of order unity, yielding a total experiment time Texp = NκT1.
Now consider a typical inductively detected direct experiment, in which one collects N data points in a single transient lasting T2. The detector must operate with a bandwidth BW = 1/(2Δt), where Δt = T2/N is the sampling interval. Hence, the uncertainty of each point is , where ρd is the sensitivity of the direct detector. The repetition time (limited by T1) may be taken to be the same in the direct and remote modes, κT1, so that in an experiment lasting the same amount of time as in the remote case, a total number of transients Nt = Texp/κT1 = N may be collected. After averaging Nt transients, the uncertainty of each point in the directly detected FID is reduced by so that . Comparing the uncertainty of each point in the remote and direct modes, we find σr/σd = 1.5 ρrT2/(ρdT1). Hence, for detectors of comparable sensitivity, an experiment that detects the longitudinal component of the magnetization is more sensitive by a factor .
The present technique appears to have several limitations. First, the high temperature estimated for optimal operation of the magnetometer may be prohibitive for analysis of organic compounds that become unstable at high temperature. The most obvious solution to this problem is efficient thermal isolation of the vapor cell and microfluidic channel. For example, the vapor cell could be mounted in close proximity to the microfluidic channel via low thermal conductivity polyimide tethers as in ref. 23, where ≈9 mW of heating power was required to heat similarly sized vapor cells to 95°C in vacuum. Another possible solution is the use of antirelaxation wall coatings in the vapor cell. This would allow the use of lower buffer gas pressures, so that alkali–alkali spin-destruction collisions would dominate at lower temperatures, thereby lowering the temperature at which the asymptotic limit of magnetometric sensitivity (Eq. 1) would be reached. The best coating presently available is paraffin, allowing up to 10,000 bounces before depolarizing atoms; however, paraffin typically does not survive temperatures beyond 70°C. A promising alternative coating is octadecyltrichlorosilane, which has been shown to operate at temperatures of up to 120°C (24).
Finally, in the present work, encoding was performed in a field of ≈250 mG. This value of magnetic field allows access to scalar (J) couplings; however, chemical shifts, which are typically on the order of several parts per million for 1H, would be difficult to observe. Future work will likely explore the possibility of measuring chemical shifts by employing reasonably homogeneous permanent magnets and spatially tailored RF fields with appropriate pulse sequences to counteract the effects of inhomogeneous magnetic fields, as has been demonstrated in refs. 25 and 26.
In conclusion, we have demonstrated remote detection of both pulsed and CW NMR with a SERF magnetometer/microfluidic channel integrated into a single microfabricated device. We realized pulsed NMR linewidths of ≈26 Hz, limited, we believe, by the residence time and flow dispersion in the encoding region. Measurements were performed at zero field, allowing operation in the SERF regime and eliminating the need for a solenoid surrounding the sample, increasing the proximity of sensor and sample. Estimates of the fundamental detection limit indicate that, for an integration time of 1 s and a relatively modest prepolarizing field of 10 kG, ≈7 × 10¹³ protons can be detected in a volume of 1 mm3 with a signal-to-noise ratio of 3. With fast algorithms for remote detection and a recirculating pump to minimize the total volume of analyte, the technique presented here offers a promising alternative to conventional detection of NMR at high field.
ACKNOWLEDGMENTS.
We greatly appreciate stimulating discussions with L.-S. Bouchard. This work was supported by Office of Naval Research–Multidisciplinary University Research Initiative Grant FD-N00014-05-1-0406; the Director, Office of Science, Office of Basic Energy Sciences, Nuclear Science Divisions, of the U.S. Department of Energy under Contract DE-AC03-76SF00098; a CalSpace Minigrant; and the Microsystems Technology Office of the Defense Advanced Research Projects Agency.
Footnotes
The authors declare no conflict of interest.
References
- 1.Moulé AJ, et al. Amplification of xenon NMR, MRI by remote detection. Proc Natl Acad Sci USA. 2003;100:9122–9127. doi: 10.1073/pnas.1133497100. [DOI] [PMC free article] [PubMed] [Google Scholar]
- 2.Xu S, et al. Magnetic resonance imaging with an optical atomic magnetometer. Proc Natl Acad Sci USA. 2006;103:12668–12671. doi: 10.1073/pnas.0605396103. [DOI] [PMC free article] [PubMed] [Google Scholar]
- 3.Granwehr J, et al. Dispersion measurements using time-of-flight remote detection MRI. Magn Reson Imaging. 2007;25:449–452. doi: 10.1016/j.mri.2006.11.011. [DOI] [PubMed] [Google Scholar]
- 4.Harel E, Hilty C, Koen K, McDonnell EE, Pines A. Time-of-flight flow imaging of two-component flow inside a microfluidic chip. Phys Rev Lett. 2007;98 doi: 10.1103/PhysRevLett.98.017601. 017601. [DOI] [PubMed] [Google Scholar]
- 5.Anwar MS, et al. Spin coherence transfer in chemical transformations monitored by remote detection NMR. Anal Chem. 2007;79:2806–2811. doi: 10.1021/ac062327+. [DOI] [PubMed] [Google Scholar]
- 6.Schwindt PDD, et al. Chip-scale atomic magnetometer. Appl Phys Lett. 2004;85:6409–6411. [Google Scholar]
- 7.Shah V, Knappe S, Schwindt PDD, Kitching J. Subpicotesla atomic magnetometry with a microfabricated vapour cell. Nat Photonics. 2007;1:649–652. [Google Scholar]
- 8.Kominis IK, Kornack TW, Allred JC, Romalis MV. A subfemtotesla multichannel atomic magnetometer. Nature. 2003;422:596–599. doi: 10.1038/nature01484. [DOI] [PubMed] [Google Scholar]
- 9.Olson DL, Peck TL, Webb AG, Margin RL, Sweedler JV. High-resolution microcoil 1H-NMR for mass-limited, nanoliter-volume samples. Science. 1995;270:1967–1970. [Google Scholar]
- 10.Olson DL, Lacey ME, Sweedler J. The nanoliter niche—NMR detection for trace analysis and capillary separations. Anal Chem. 1998;70:645–650. doi: 10.1021/ac9818071. [DOI] [PubMed] [Google Scholar]
- 11.Webb A. Nuclear magnetic resonance of mass-limited samples using small RF coils. Anal Bioanal Chem. 2007;388:525–528. doi: 10.1007/s00216-007-1178-2. [DOI] [PubMed] [Google Scholar]
- 12.Djukovic D, Liu S, Henry I, Tobias B, Raftery D. Signal enhancement in HPLC/microcoil NMR using automated column trapping. Anal Chem. 2006;78:7154–7160. doi: 10.1021/ac0605748. [DOI] [PMC free article] [PubMed] [Google Scholar]
- 13.Minard KR, Wind RA. Picoliter 1H NMR spectroscopy. J Magn Reson. 2002;154:336–343. doi: 10.1006/jmre.2001.2494. [DOI] [PubMed] [Google Scholar]
- 14.Ciobanu L, Seeber DA, Pennington CH. 3D MR microscopy with resolution 3.7 μm by 3.3 μm by 3.3 μm. J Magn Reson. 2002;158:178–182. doi: 10.1016/s1090-7807(02)00071-x. [DOI] [PubMed] [Google Scholar]
- 15.Savukov IM, Romalis MV. NMR detection with an atomic magnetometer. Phys Rev Lett. 2005;94:123001. doi: 10.1103/PhysRevLett.94.123001. [DOI] [PubMed] [Google Scholar]
- 16.Savukov IM, Seltzer SJ, Romalis MV. Detection of NMR signals with a radio-frequency atomic magnetometer. J Magn Reson. 2007;185:214–220. doi: 10.1016/j.jmr.2006.12.012. [DOI] [PubMed] [Google Scholar]
- 17.Knappe S, et al. Atomic vapor cells for chip-scale atomic clocks with improved long-term frequency stability. Opt Lett. 2005;30:2351–2353. doi: 10.1364/ol.30.002351. [DOI] [PubMed] [Google Scholar]
- 18.Seltzer SJ, Romalis MV. Unshielded three-axis vector operation of a spin-exchange-relaxation-free atomic magnetometer. Appl Phys Lett. 2004;85:4804–4806. [Google Scholar]
- 19.Budker D, Romalis MV. Optical magnetometry. Nat Phys. 2007;3:227–234. [Google Scholar]
- 20.Baranga AB, et al. Polarization of 3He by spin exchange with optically pumped Rb and K vapors. Phys Rev Lett. 1998;80:2801–2804. [Google Scholar]
- 21.Beverini N, Minguzzi P, Strumia F. Foreign-gas-induced cesium hyperfine relaxation. Phys Rev A. 1971;4:550. [Google Scholar]
- 22.Kornack TW, Smullin SJ, Lee S-K, Romalis MV. A low-noise ferrite magnetic shield. Appl Phys Lett. 2007;90:223501. [Google Scholar]
- 23.Lutwak R, et al. In: Senior K, editor. The Chip-Scale Atomic Clock—Low-Power Physics Package; Proceedings of the 36th Annual Precise Time and Time Interval (PTTI) Systems and Applications Meeting; Springfield, VA: National Technical Information Service; 2004. pp. 339–354. [Google Scholar]
- 24.Seltzer SJ, Meares PJ, Romalis MV. Synchronous optical pumping of quantum revival beats for atomic magnetometry. Phys Rev A. 2007;75 051407. [Google Scholar]
- 25.Meriles CA, Sakellariou D, Heise H, Moule AJ, Pines A. Approach to high-resolution ex situ NMR spectroscopy. Science. 2001;293:82–85. doi: 10.1126/science.1061498. [DOI] [PubMed] [Google Scholar]
- 26.Grunin L, Blümich B. Resolving chemical shift spectra with a low-field NMR relaxometer. Chem Phys Lett. 2004;397:306–308. [Google Scholar]


