Abstract
In this article, we have applied the ChIP-on-chip approach to pursue a large scale identification of ERα- and ERβ-binding DNA regions in intact chromatin. We show that there is a high degree of overlap between the regions identified as bound by ERα and ERβ, respectively, but there are also regions that are bound by ERα only in the presence of ERβ, as well as regions that are selectively bound by either receptor. Analysis of bound regions shows that regions bound by ERα have distinct properties in terms of genome landscape, sequence features, and conservation compared with regions that are bound by ERβ. ERβ-bound regions are, as a group, located more closely to transcription start sites. ERα- and ERβ-bound regions differ in sequence properties, with ERα-bound regions having an overrepresentation of TA-rich motifs including forkhead binding sites and ERβ-bound regions having a predominance of classical estrogen response elements (EREs) and GC-rich motifs. Differences in the properties of ER bound regions might explain some of the differences in gene expression programs and physiological effects shown by the respective estrogen receptors.
Keywords: bioinformatics, estrogen response elements, estrogen signaling, gene expression, nuclear receptors
Estrogen is a key regulator of growth and differentiation in a broad range of target tissues, including the mammary gland (1). Estrogen is also known to be involved in many pathological processes including breast cancer.
Estrogens exert their physiological effects through two estrogen receptor (ER) subtypes, ERα and ERβ (official gene names ESR1 and ESR2), that belong to the nuclear receptor family (2). The ERs share structural characteristics with other members of the NR superfamily including five distinct domains (3). The DNA-binding domain is the most conserved region between the two ERs. After activation, ERs may regulate target gene transcription through distinct pathways. In the classical model of ER action, ligand-activated ER binds specifically to DNA at estrogen-responsive elements (EREs) through its DNA binding domain and brings coactivators and corepressors to transcription start sites (TSS). Estrogen also modulates gene expression by a mechanism in which ER interacts with other transcription factors (4, 5).
ERα and ERβ have different biological functions, as indicated by their specific expression patterns and the distinct phenotypes observed in ERα and ERβ knockout mice (5). However, analysis of estrogen receptor expression patterns suggests that the highly variable and even contrasting effects of estrogens in different tissues do not simply reflect expression of a particular receptor subtype. Recent studies aimed at comprehensively unraveling the complete estrogen-regulated gene expression programs in various cell lines suggest different signaling pathways for ERα and/or ERβ, respectively (5).
Several gene expression studies have been performed in breast cancer cell lines expressing endogenous ERα and recombinant ERβ (6–8). Microarray analyses of E2-stimulated Hs578T cells stably expressing either ERα or ERβ revealed that the patterns of E2-regulated gene expression were largely unique to either ER subtype (9). In summary, available data suggests that ERα and ERβ have the capacity to regulate overlapping but yet distinct repertoires of genes. However, whether this reflects intrinsic differences in their in vivo DNA-binding properties and/or different interactions with coregulators remains unclear.
Recently, chromatin immunoprecipitation (ChIP) has been used in combination with genomic DNA microarrays (chip) (ChIP-on-chip) and DNA sequencing (ChIP-PETs) to pursue whole genome identification of ERα-binding DNA regions in intact chromatin of cultured cell lines and tissue samples (10–12). However, no large scale identification of ERβ-binding DNA regions has been reported. In this article, we report on such a study.
Results
Identification and Characterization of an Antibody Suitable for ERβ ChIP-on-Chip Analysis.
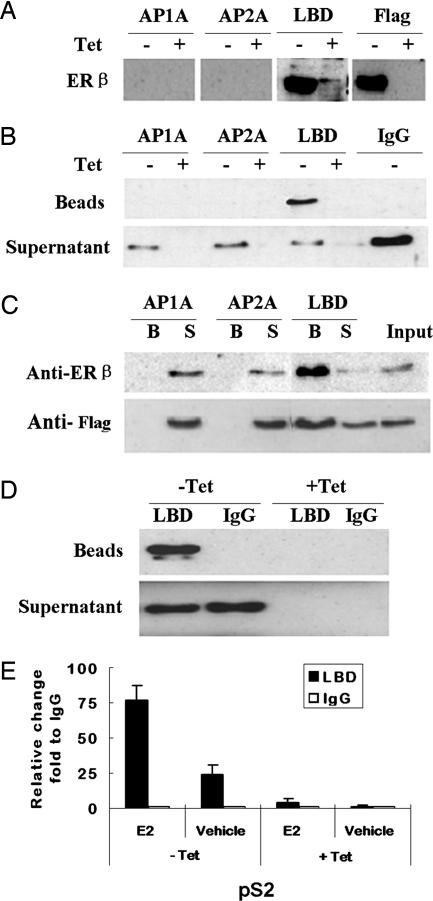
A stable cell line, MCF-7 tet-off Flag-ERβ, that expresses an inducible version of ERβ fused to a Flag tag, was used in all experiments. This cell line expresses endogenous ERα. Initially we tested three antibodies for their ability to detect overexpressed ERβ by Western blot analysis. The anti-ERβ antibody “LBD” has been developed in our laboratory (13). The anti-ERβ antibodies AP1A and AP2A have been described in ref. 14. As shown in Fig. 1A, only the LBD antibody, and an antibody raised against the Flag tag, detected the overexpressed ERβ by Western blot analysis using our conditions. Fig. 1 B and C shows that the LBD antibody efficiently immunoprecipitated ERβ. Importantly, as shown in Fig. 1D, LBD can immunoprecipitate ERβ also under ChIP conditions. Finally, the ChIP assay was performed and binding of ERβ to DNA was assayed by using a fragment of the pS2 promoter (15). Fig. 1E shows that the LBD antibody could be used for the ChIP assay and that ligand-dependent binding of ERβ to the pS2 promoter could be detected under the conditions used.
Fig. 1.
Characterization of ERβ antibodies. (A) MCF-7 tet-off Flag-ERβ cells were cultured in the presence of tetracycline (+Tet; −ERβ) or absence (−Tet; +ERβ) of tetracycline for 18 h. Whole cell extracts were processed for Western blot analysis with different antibodies as indicated. (B) MCF-7 tet-off Flag-ERβ cells were cultured as in A. Cells were processed for standard IP analysis using the various ERβ antibodies and a nonspecific control antibody (IgG, normal rabbit IgG). Precipitated fractions (Beads) and supernatant fractions (Supernatant), after IP, were analyzed by Western blotting using the anti-Flag antibody M5. (C) The conditions are the same as in B except that beads (B) and supernatants (S) were analyzed by using the ERβ antibody (Upper) and the anti-Flag antibody M5 (Lower), respectively. Input corresponds to sample before IP. (D) MCF-7 tet-off Flag-ERβ cells were cultured as in A. The cells were processed for ChIP analysis as described in Materials and Methods by using ERβ LBD antibody and a nonspecific control antibody (IgG, normal rabbit IgG). The anti-Flag antibody M5 was used for Western blotting. (E) MCF-7 tet-off Flag-ERβ cells were treated and processed for ChIP assays as described in Materials and Methods. Real-time PCR on DNA from immunoprecipitated fractions was performed by using primer pairs that amplify the ER binding region in the pS2 promoter. Data are presented as relative promoter enrichment by the ERβ LBD antibody compared with normal rabbit IgG.
Identification of ERα- and ERβ-Binding DNA Regions.
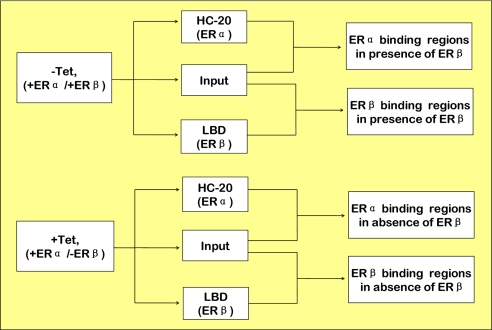
We used the Affymetrix platform to perform the ChIP-on-chip assay for ERα and ERβ, respectively. ChIP enriched samples and input samples were hybridized to Affymetrix human genome tiling arrays that covered chromosomes 1, 3, 6, 21, 22, X, and Y with chromosome 21 including the well characterized estrogen inducible pS2 gene as positive control. Fig. 2 shows the experimental design. MCF-7 tet-off Flag-ERβ cells were cultured to express ERβ (−Tet, +ERα/+ERβ) and not to express ERβ (+Tet, +ERα/−ERβ), respectively. Samples were processed for ChIP by using antibodies against ERα (HC-20) and ERβ (LBD). ChIP-on-chip data derived from HC-20 and LBD ChIP were compared with input to derive ER ChIP regions. This analysis identified three sets of ER-binding regions, ERα-binding regions in the presence of ERβ, ERβ-binding regions in the presence of ERβ and ERα-binding regions in the absence of ERβ. A fourth group, ERβ-binding regions in the absence of ERβ, served as a negative control.
Fig. 2.
Design of ChIP-on-chip assay for ERα and ERβ. MCF-7 tet-off Flag-ERβ cells were cultured in the presence of tetracycline (+Tet; +ERα/−ERβ) or absence of tetracycline (-Tet; +ERα/+ERβ), followed by ChIP with ERα HC-20 or ERβ LBD antibodies, respectively. ChIP DNA was amplified, labeled, and hybridized to Affymetrix human tiling 2.0R A and C arrays.
Table 1 shows the number of identified ERα- and ERβ-binding DNA regions under conditions of expressed ERβ (ERα+β, ERβ+β) and unexpressed ERβ (ERα−β, ERβ−β), respectively. ER-binding DNA regions were identified by using the TAS software from Affymetrix and the MAT software (16). Only regions identified by both analysis strategies were included in the further analysis. In summary, this assay detected a similar number of ERα- and ERβ-binding DNA regions and the number of ERα-binding DNA regions was not affected by overexpressed ERβ. No ER enriched regions were detected in the negative control [ERβ binding regions in the absence of ERβ (the ERβ−β experiment)], using this approach (Table 1).
Table 1.
ERα- and ERβ-binding regions
| Group | MAT | TAS | Overlap |
|---|---|---|---|
| ER α+β | 791 | 1,309 | 584 |
| ER β+β | 680 | 834 | 485 |
| ER α-β | 976 | 676 | 604 |
| ER β-β | 162 | 21 | 0 |
MAT (Model-based Analysis of Tiling-array) and TAS (Tiling Analysis Software)-detected regions are listed.
We compared our ERα ChIP-on-chip data with those recently reported by Carroll et al. (17). Overall, our conditions and analysis strategy identified approximately half as many sites as identified by Carroll et al. Of our identified sites, ≈60% were reported by Carroll et al. (Y.L., H.G., and K.D.-W., unpublished data).
Comparison of ERα- and ERβ-Binding DNA Regions.
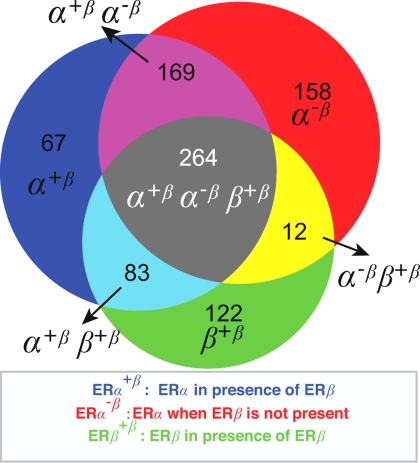
We analyzed the three datasets from Table 1: ERα-binding regions in the presence of ERβ [ERα+β; supporting information (SI) Dataset 1], ERα-binding regions in the absence of ERβ (ERα−β; SI Dataset 2), and ERβ-binding regions in the presence of ERβ (ERβ+β; SI Dataset 3). We merged regions between these experiments if the regions overlapped by >50%. In a few cases, bridging effects occurred so that nearby regions in one set were merged because a region in another set bridged them. The number of clusters from a given set is therefore slightly lower than the number of binding regions in Table 1. The clusters and their different content are visualized in the Venn diagram in Fig. 3, showing the overlap of binding regions for ERα and ERβ.
Fig. 3.
Venn diagram showing clustered regions and their overlap between the different experiments.
As the different partitions (types of overlap) in the Venn diagram form the basis for the analysis below, we have defined a nomenclature and an associated color scheme describing the different partitions that were consistently used in the analyses below.
The regions only identified in the ERα+β experiment were labeled α+β, and colored blue in Fig. 3. The regions bound only in the ERα−β experiment were labeled α−β (red) and the regions only bound by ERβ+β were labeled β+β (green). Regions where several experiments indicated binding sites are labeled α+βα−β (pink), α+ββ+β (cyan), α−ββ+β (yellow) and α+βα−ββ+β (gray).
Fig. 3 shows the following. (i) The largest partition is the α+βα−ββ+β (gray), where all experiments indicated binding. ERα, in the presence or in the absence of ERβ, as well as ERβ could bind to these regions. (ii) α+ββ+β (cyan) regions were bound by ERα and ERβ only in the presence of ERβ, indicating a possible role of ERβ as a recruiter or stabilizer of ERα binding to these regions. (iii) The very small partition (yellow) composed of 12 regions bound only by ERα−β and ERβ+β is difficult to interpret. These regions likely belong to the α+βα−ββ+β partition but were not picked up as ERα+β binders with the applied filters for identifying binding regions. This interpretation in combination with the fact that so few regions are in this partition was the basis for not including this partition in the subsequent studies. (iv) This analysis identified sites that were unique for ERα in the presence of ERβ (α+β; blue), ERα in the absence of ERβ (α−β; red) and ERβ (green). It is somewhat surprising that the number of regions unique to the α+β and α−β experiments was so large. (v) There is also a large partition (α+βα−β, violet) with sites that are only bound by ERα, regardless of the presence of ERβ.
Confirmation of Identified ERα- and ERβ-Binding DNA Regions.
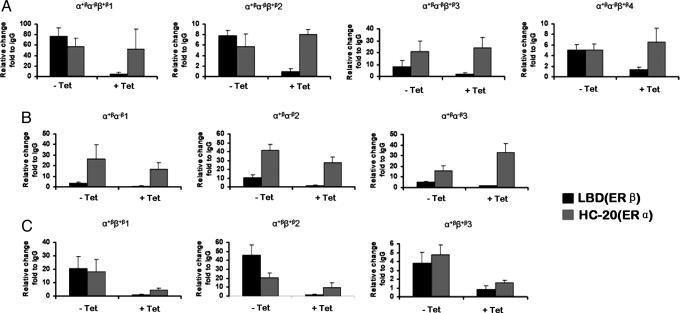
Fig. 4 shows confirmation of binding regions identified by the ChIP-on-chip assay using ChIP followed by real-time PCR to detect ER-bound DNA-binding regions. In Fig. 4A, four binding regions that were identified as general ER-binders in the ChIP-on-chip assay were confirmed as general ER-binders by using ChIP followed by real-time PCR. In Fig. 4 B and C, three binding regions were confirmed as ERα selective regions and as regions where ERα-binding depended on ERβ, respectively.
Fig. 4.
Confirmation of ERα and ERβ binding regions using ChIP followed by real-time PCR. The real-time PCR data are presented as relative enrichment by ERβ LBD antibody or ERα HC-20 antibody compared with normal rabbit IgG. (A) Binding regions from the α+βα−ββ+β group. (B) Binding regions from the α+βα−β group. (C) Binding regions from the α+ββ+β group.
Genome Landscape of ERα- and ERβ-Binding Regions.
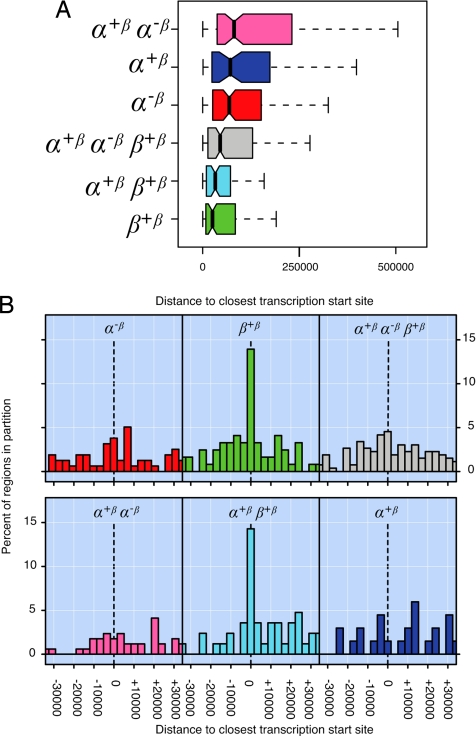
Fig. 5A shows that regions binding ERβ on average were closer to known Refseq TSSs (18) than regions binding ERα. This difference was statistically significant (SI Table 2). We repeated the analysis considering whether regions were upstream or downstream of the TSS. This analysis confirmed the tendency for ERβ binding regions to be closer to the TSS than ERα binding regions. However, there was no noticeable bias toward regions being up or downstream of the TSS (Fig. 5B). Overall, ≈27% of ERβ sites are within 10 kb of a RefSeq TSS.
Fig. 5.
Distance bias of ERα and ERβ binding regions. Labels of partitions and associated colors are as in Fig. 3. (A) Boxplots showing the distributions of distances to the closest TSS for regions within the different partitions. Because of space constrains, extreme values are not shown (see SI Fig. 9 for a complete image). (B) Histogram of distances to the closest TSS. Negative distances indicate regions upstream of TSSs, positive distances indicate regions downstream of TSSs. Note that only the region around the TSS is shown.
Sequence Properties of Regions Within Partitions.
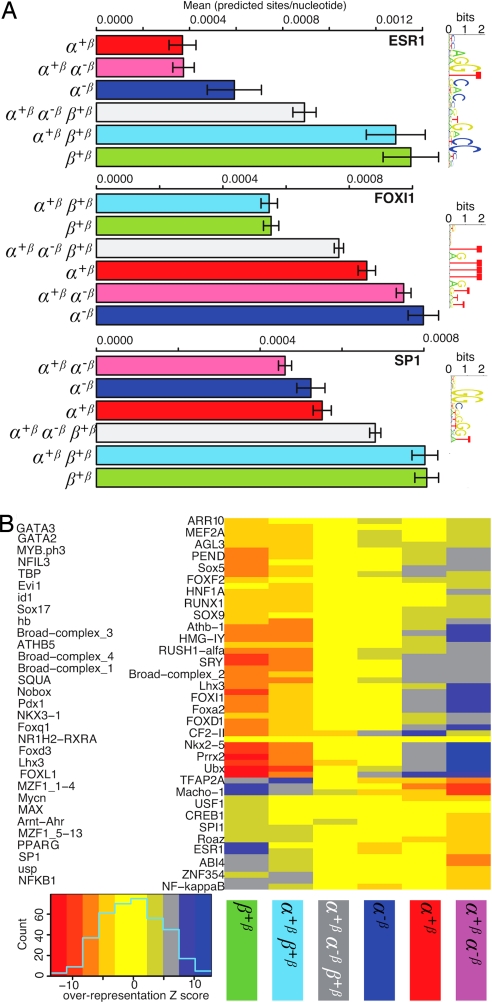
Scanning each region in each partition with binding site models (position weight matrices) from the JASPAR database (19) using the ASAP package to predict potential transcription factor binding sites (TFBS), revealed that there were differences between the sets. In particular, the ESR1 matrix model (modeling ER-binding sites) and GC-rich patterns, such as SP1, were found more often in regions binding ERβ (Fig. 6A), whereas AT-rich patterns like forkhead transcription factors were predicted more often in regions preferentially bound by ERα (Fig. 6A). Fig. 6B shows a global heatmap representation (20) that clusters partitions and transcription factor binding densities. Potential binding site densities set ERα- and ERβ-binding regions apart, consistent with the above observation. Furthermore, as in the TSS distance analyses, regions binding ERβ or ERα clustered together.
Fig. 6.
Sequence properties of regions within partitions. (A) Examples of mean densities of predicted TFBSs in the different partitions for ESR 1 (classical EREs), a forkhead transcription factor (FOXI1), and Sp1. Colors and labels of partitions are as in Fig. 3. Error bars are standard error of the mean. Sequence logos (26) corresponding to the matrix models used are shown to the right. (B) Heatmap representation of global differences in predicted TFBS densities between the partitions. Columns represent the different partitions in the Venn diagram (Fig. 3). Rows are densities of predicted TFBSs. The gene name for the predicted TFBS is indicated to the left. TFBSs are indicated as Z scores, ranging from −15 (strong under-representation indicated by red color) to +15 (strong overrepresentation indicated by blue color). Columns and rows are clustered by similarity. This figure shows only TF models with high signal; see SI Fig. 8 for a full version.
Conservation of ERα- and ERβ-Binding DNA Regions.
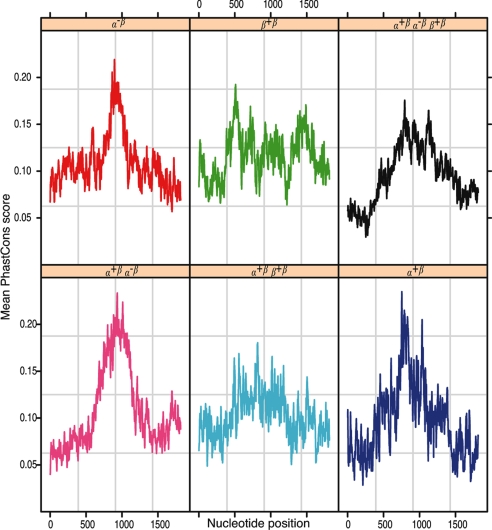
Mean PhastCons scores for each position in the binding regions are shown in Fig. 7. The same type of grouping between the partitions in the Venn diagram (Fig. 3) as observed in the TSS distance occurred when we compared conservation profiles, although the difference was not as pronounced as in the TSS distance case. Regions only binding ERα had a higher conservation toward the center (see SI Text).
Fig. 7.
Mean PhastCons conservation scores for ChIP regions, centered on their midpoint. Colors and labels are defined in Fig. 3.
Discussion
In this study, we report the identification of ERβ-binding DNA regions using the ChIP-on-chip assay. We also pursued a parallel identification of ERα-binding DNA regions, with or without the presence of ERβ. Under ERβ expressing conditions, the levels of ERα and ERβ were similar in this cell line (Y.L., H.G., and K.D.-W., unpublished observation). The dataset reported in this article is a source for understanding the distinct as well as overlapping functions of the two estrogen receptors at the level of DNA binding.
Difference Between ERα- and ERβ-Binding DNA Regions.
Our results show a high degree of overlap between the DNA regions bound by ERα and ERβ, respectively, but there were also regions that were selectively bound by ERα in the presence of ERβ, as well as regions that were selectively bound by either receptor (Fig. 3).
Interestingly, the regions bound by ERα have distinct properties in terms of genome landscape, sequence features and conservation compared with regions that were bound by ERβ. The fact that ERβ-bound regions, as a group, were located closer to TSS than ERα-bound regions suggests that a higher proportion of ERβs are working as proximal transcription factors.
There was also a highly significant difference in DNA sequence properties depending on ERα/ERβ specificity. For example, ERβ-bound regions included GC-rich motifs, whereas ERα-bound regions had an overrepresentation of TA-rich motifs including forkhead binding sites. Importantly, ChIP experiments suggested that ERα bound regions selectively bind forkhead TFs as compared with ERβ bound regions (Y.L., T.T.M., A. Sandelin, and K.D.-W., unpublished observations). Similarly, for ERα, Carroll et al. (21), have suggested the involvement of FOXA1 in DNA-binding by the receptor protein. Genes associated with different types of binding regions do not display differences in GO classes.
ERβ as a Recruiter of ERα.
The α+ββ+β region (cyan) in Fig. 3 shows that a number of regions are bound by ERβ and ERα, but ERα only in the presence of ERβ. We hypothesize that in these regions, ERβ recruits ERα by direct or indirect interactions, e.g., by making the region available to ERα by affecting chromatin state.
Are ERα and ERβ Sites Distinct?
Our results are consistent with the notion that ER binding regions are not exclusively bound by ERα or ERβ, but a given site can have a higher propensity for one factor than the other. For the promiscuous regions that, according to the ChIP-on-chip experiment, bound both ERα and ERβ, the relative binding of these two receptors varied between the regions (Fig. 4A, compare e.g., α+βα−ββ+β1 and α+βα−ββ+β3). For regions that were labeled ERα-selective, there was a small but varying component of ERβ-binding (Fig. 4B). For the α+ββ+β regions, where ERα binding may be dependent on ERβ binding, it is clear that there was a varying degree of enhancement of ERα binding by ERβ expression (Fig. 4C).
In summary, we have shown that ERα and ERβ display selectivity with regard to genomic location, using the ChIP-on-chip assay. Differences in the properties of bound regions might explain some of the differences in gene expression programs and physiological effects exerted by the respective ERs.
Materials and Methods
Cell Culture and Generation of a Stable MCF-7 tet-off ERβ Clone.
Modified MCF-7 human breast cancer cells were cultured in DMEM (Invitrogen, Carlsbad, CA) supplemented with 10% FCS and 1% penicillin/streptomycin (Invitrogen) at 37°C in a humidified atmosphere of 5% CO2 in air. A stable MCF-7 tet-off ERβ clone was generated as described in ref. 22.
Western Blot Analysis.
MCF-7 tet-off ERβ cells were seeded in 150-mm tissue culture plates and grown in the presence (+Tet; −ERβ) or absence (−Tet; +ERβ) of tetracycline, respectively, for 18 h. The total cell extracts were prepared as described in ref. 22. Aliquots corresponding to 100 μg of protein were separated by SDS/PAGE. Antibodies included were as follows: anti-ERβ rabbit polyclonal antibodies AP1A and AP2A (14), anti-ERβ rabbit polyclonal antibody LBD (13), anti-ERβ chicken polyclonal antibody Ab14021 (Abcam, Cambridge MA), and anti-Flag M5 monoclonal antibody (Sigma).
Immunoprecipitation.
Total cell extracts from MCF7 tet-off ERβ cells were incubated with AP1A, AP2A, and LBD antibodies, followed by immunoprecipitation as described in ref. 22. Precipitated fractions and supernatant were transferred to nitrocellulose membrane and visualized by using the anti-Flag M5 monoclonal antibody (Sigma) or the anti-ERβ chicken polyclonal antibody Ab14021 (Abcam, Cambridge MA).
Chromatin Immunoprecipitation.
MCF-7 tet-off ERβ cells were seeded in 150-mm dishes and grown in the presence (+Tet; −ERβ) or absence (−Tet; +ERβ) of tetracycline, respectively, for 18 h. Cells were treated with 10 nM E2 for 45 min and ChIP was performed as described in ref. 15. The LBD antibody was used to perform ChIP for ERβ, and the HC-20 antibody was used for ERα ChIP. The ChIP DNA was used for real-time PCR and ChIP-on-chip analysis.
Probe Labeling and Microarray Hybridization.
ChIP DNA was amplified and labeled according to the standard Affymetrix protocol (www.affymetrix.com/products/arrays/specific/human_tiling_2.affx). Six micrograms of labeled products were hybridized to Affymetrix human tiling 2.0R A and C arrays (Affymetrix, Santa Clara, CA).
Affymetrix Data Analysis.
The scanned output files were analyzed with Tiling Analysis Software version 1.1 (Affymetrix, Santa Clara, CA) as described in ref. 11. MAT (16) was used as an alternative analysis strategy using default settings.
Distance to Closest Transcription Start Site.
As described (11), we identified the closest RefSeq 5′ end for each ChIP region, regardless of whether the cluster was upstream or downstream of the 5′ end. The distance was calculated from the end or the start of each cluster (whichever gave the smallest distance). RefSeq mapping data were collected from the RefFlat table from the UCSC genome browser database (23). We repeated the above analysis but annotated each distance with plus or minus signs depending on the location of the cluster to the 5′ end.
Computational Motif Analysis.
We searched all sequence sets with all position weight matrices in the JASPAR CORE database, using the ASAP tool (27) with the following settings: pseudocounts equal to the square root of the position specific counts and 0th order uniform background model. We used a score threshold corresponding to 75% of the scoring range for each specific matrix model (24). For a given transcription factor model and Venn diagram partition, we estimated the mean number of predicted sites per nucleotide, using the predictions above. Heatmap Z scores where generated by using simulations (see SI Text).
Sequence Conservation Analysis.
As in ref. 11, we assessed the conservation over the vertebrate lineage using PhastCons scores from the UCSC genome browser (based on whole-genome alignments of 28 species) (25). We reasoned that the midpoint of a cluster is more likely to harbor the actual ER site than any other point in the cluster. Therefore, we centered all clusters within a Venn diagram compartment on their midpoint, which produced an alignment of clusters and a column of conservation scores for each position. For each of these columns, we calculated the mean of these scores and plotted them, for each partition. Nucleotides with no PhastCons scores were treated as missing values.
Directed ChIP and Real-Time PCR.
ChIP was performed as described above, and the ChIP DNA was amplified by real-time PCR using Platinum SYBR green quantitative PCR supermix uracil DNA glycosylase (Invitrogen). Primer pairs are shown in SI Table 3.
Supplementary Material
ACKNOWLEDGMENTS.
We thank the Bioinformatics and Expression Analysis core facility for help with microarray analysis. T.T.M., E.V., and A. Sandelin were supported by a grant from the Novo Nordisk Foundation to the Bioinformatics Centre. Y.L. was also supported by a grant from the China Scholarship Council. The study was also supported by grants from the Swedish Cancer Fund and from the Swedish Science Council.
Footnotes
Conflict of interest statement: J.-Å.G. is shareholder, research grant receiver, and consultant of KaroBio AB.
This article contains supporting information online at www.pnas.org/cgi/content/full/0712085105/DC1.
References
- 1.Platet N, Cathiard AM, Gleizes M, Garcia M. Estrogens and their receptors in breast cancer progression: A dual role in cancer proliferation and invasion. Crit Rev Oncol Hematol. 2004;51:55–67. doi: 10.1016/j.critrevonc.2004.02.001. [DOI] [PubMed] [Google Scholar]
- 2.Dahlman-Wright K, et al. International Union of Pharmacology. LXIV. Estrogen receptors. Pharmacol Rev. 2006;58:773–781. doi: 10.1124/pr.58.4.8. [DOI] [PubMed] [Google Scholar]
- 3.Gronemeyer H, Laudet V. Transcription factors 3: Nuclear receptors. Protein Profile. 1995;2:1173–1308. [PubMed] [Google Scholar]
- 4.Bjornstrom L, Sjoberg M. Mechanisms of estrogen receptor signaling: Convergence of genomic and nongenomic actions on target genes. Mol Endocrinol. 2005;19:833–842. doi: 10.1210/me.2004-0486. [DOI] [PubMed] [Google Scholar]
- 5.Heldring N, et al. Estrogen receptors: How do they signal and what are their targets. Physiol Rev. 2007;87:905–931. doi: 10.1152/physrev.00026.2006. [DOI] [PubMed] [Google Scholar]
- 6.Chang EC, Frasor J, Komm B, Katzenellenbogen BS. Impact of estrogen receptor beta on gene networks regulated by estrogen receptor alpha in breast cancer cells. Endocrinology. 2006;147:4831–4842. doi: 10.1210/en.2006-0563. [DOI] [PubMed] [Google Scholar]
- 7.Lin CY, et al. Inhibitory effects of estrogen receptor beta on specific hormone-responsive gene expression and association with disease outcome in primary breast cancer. Breast Cancer Res. 2007;9:R25. doi: 10.1186/bcr1667. [DOI] [PMC free article] [PubMed] [Google Scholar]
- 8.Williams C, Edvardsson K, Lewandowski SA, Strom A, Gustafsson JA. A genome-wide study of the repressive effects of estrogen receptor beta on estrogen receptor alpha signaling in breast cancer cells. Oncogene. 2007 Aug 13; doi: 10.1038/sj.onc.1210712. [DOI] [PubMed] [Google Scholar]
- 9.Secreto FJ, Monroe DG, Dutta S, Ingle JN, Spelsberg TC. Estrogen receptor alpha/beta isoforms, but not betacx, modulate unique patterns of gene expression and cell proliferation in Hs578T cells. J Cell Biochem. 2007;101:1125–1147. doi: 10.1002/jcb.21205. [DOI] [PubMed] [Google Scholar]
- 10.Carroll JS, Brown M. Estrogen receptor target gene: An evolving concept. Mol Endocrinol. 2006;20:1707–1714. doi: 10.1210/me.2005-0334. [DOI] [PubMed] [Google Scholar]
- 11.Gao H, Falt S, Sandelin A, Gustafsson JA, Dahlman-Wright K. Genome-wide identification of estrogen receptor (alpha) binding sites in mouse liver. Mol Endocrinol. 2007;22:10–22. doi: 10.1210/me.2007-0121. [DOI] [PMC free article] [PubMed] [Google Scholar]
- 12.Lin CY, et al. Whole-genome cartography of estrogen receptor alpha binding sites. PLoS Genet. 2007;3:e87. doi: 10.1371/journal.pgen.0030087. [DOI] [PMC free article] [PubMed] [Google Scholar]
- 13.Omoto Y, et al. Expression, function, and clinical implications of the estrogen receptor beta in human lung cancers. Biochem Biophys Res Commun. 2001;285:340–347. doi: 10.1006/bbrc.2001.5158. [DOI] [PubMed] [Google Scholar]
- 14.Weitsman GE, et al. Assessment of multiple different estrogen receptor-beta antibodies for their ability to immunoprecipitate under chromatin immunoprecipitation conditions. Breast Cancer Res Treat. 2006;100:23–31. doi: 10.1007/s10549-006-9229-5. [DOI] [PubMed] [Google Scholar]
- 15.Matthews J, et al. Estrogen receptor (ER) beta modulates ERalpha-mediated transcriptional activation by altering the recruitment of c-Fos and c-Jun to estrogen-responsive promoters. Mol Endocrinol. 2006;20:534–543. doi: 10.1210/me.2005-0140. [DOI] [PubMed] [Google Scholar]
- 16.Johnson WE, et al. Model-based analysis of tiling-arrays for ChIP-chip. Proc Natl Acad Sci USA. 2006;103:12457–12462. doi: 10.1073/pnas.0601180103. [DOI] [PMC free article] [PubMed] [Google Scholar]
- 17.Carroll JS, et al. Genome-wide analysis of estrogen receptor binding sites. Nat Genet. 2006;38:1289–1297. doi: 10.1038/ng1901. [DOI] [PubMed] [Google Scholar]
- 18.Wheeler DL, et al. Database resources of the National Center for Biotechnology Information. Nucleic Acids Res. 2007;35:D5–D12. doi: 10.1093/nar/gkl1031. [DOI] [PMC free article] [PubMed] [Google Scholar]
- 19.Bryne JC, et al. JASPAR, the open access database of transcription factor-binding profiles: new content and tools in the 2008 update. Nucleic Acids Res. 2007;36:D102–D106. doi: 10.1093/nar/gkm955. [DOI] [PMC free article] [PubMed] [Google Scholar]
- 20.Eisen MB, Spellman PT, Brown PO, Botstein D. Cluster analysis and display of genome-wide expression patterns. Proc Natl Acad Sci USA. 1998;95:14863–14868. doi: 10.1073/pnas.95.25.14863. [DOI] [PMC free article] [PubMed] [Google Scholar]
- 21.Carroll JS, et al. Chromosome-wide mapping of estrogen receptor binding reveals long-range regulation requiring the forkhead protein FoxA1. Cell. 2005;122:33–43. doi: 10.1016/j.cell.2005.05.008. [DOI] [PubMed] [Google Scholar]
- 22.Zhao C, et al. Estrogen receptor beta2 negatively regulates the transactivation of estrogen receptor alpha in human breast cancer cells. Cancer Res. 2007;67:3955–3962. doi: 10.1158/0008-5472.CAN-06-3505. [DOI] [PubMed] [Google Scholar]
- 23.Kuhn RM, et al. The UCSC genome browser database: update 2007. Nucleic Acids Res. 2007;35:D668–73. doi: 10.1093/nar/gkl928. [DOI] [PMC free article] [PubMed] [Google Scholar]
- 24.Wasserman WW, Sandelin A. Applied bioinformatics for the identification of regulatory elements. Nat Rev Genet. 2004;5:276–287. doi: 10.1038/nrg1315. [DOI] [PubMed] [Google Scholar]
- 25.Miller W, et al. 28-Way vertebrate alignment and conservation track in the UCSC Genome Browser. Genome Res. 2007;17:1797–1808. doi: 10.1101/gr.6761107. [DOI] [PMC free article] [PubMed] [Google Scholar]
- 26.Schneider TD, Stephens RM. Sequence logos: A new way to display consensus sequences. Nucleic Acids Res. 1990;18:6097–6100. doi: 10.1093/nar/18.20.6097. [DOI] [PMC free article] [PubMed] [Google Scholar]
- 27.Marstrand TT, et al. PLoS ONE. 2008 doi: 10.1371/journal.pone.0001623. in press. [DOI] [PMC free article] [PubMed] [Google Scholar]
Associated Data
This section collects any data citations, data availability statements, or supplementary materials included in this article.


