

Abstract
CYP2E1 is recognized as the most important enzyme for initiation of acetaminophen (APAP)-induced toxicity. In this study, the resistance of Cyp2e1-null mice to APAP treatment was confirmed by comparing serum aminotransferase activities and blood urea nitrogen levels in wild-type and Cyp2e1-null mice. However, unexpectedly, profiling of major known APAP metabolites in urine and serum revealed that the contribution of CYP2E1 to APAP metabolism decreased with increasing APAP doses administered. Measurement of hepatic glutathione and hydrogen peroxide levels exposed the importance of oxidative stress in determining the consequence of APAP overdose. Subsequent metabolomic analysis was capable of constructing a principal components analysis (PCA) model that delineated a relationship between urinary metabolomes and the responses to APAP treatment. Urinary ions high in wild-type mice treated with 400 mg/kg APAP were elucidated as 3-methoxy-APAP glucuronide (VII) and three novel APAP metabolites, including S-(5-acetylamino-2-hydroxyphenyl)mercaptopyruvic acid (VI, formed by a Cys-APAP transamination reaction in kidney), 3,3′-biacetaminophen (VIII, an APAP dimer) and a benzothiazine compound (IX, originated from deacetylated APAP), through mass isotopomer analysis, accurate mass measurement, tandem MS fragmentation, in vitro reactions and chemical treatments. Dose-, time- and genotype-dependent appearance of these minor APAP metabolites implied their association with the APAP-induced toxicity and potential biomarker application. Overall, the oxidative stress elicited by CYP2E1-mediated APAP metabolism might significantly contribute to APAP-induced toxicity. The combination of genetically-modified animal models, mass isotopomer analysis and metabolomics provides a powerful and efficient technical platform to characterize APAP-induced toxicity through identifying novel biomarkers and unravelling novel mechanisms.
Acetaminophen (APAP) overdose causes acute liver and kidney failure (1,2). Because of its clinical importance, APAP-induced acute toxicity has become an indispensable model for studying drug-induced liver and kidney injury. Over the past 40 years, numerous efforts have been undertaken to understand the molecular mechanism of this toxicological event. Results from those studies indicated that the toxicity is initiated by P450-mediated reactions that convert APAP to the reactive electrophile, N-acetyl-p-benzoquinone imine (NAPQI), causing glutathione depletion and covalent binding (3). Subsequent damage to mitochondria, cell membranes and nuclei, as well as the disruption of cell death- and survival-related signalling pathways, lead to massive necrosis and apoptosis (4). Besides the P450-catalyzed oxidation reactions, detoxicating reactions including sulfation, glucuronidation and glutathione conjugation also significantly contribute to the biotransformation of APAP and NAPQI. The balance between these activation and detoxication routes can largely determine the consequences of APAP treatment. Several P450s, including CYP1A2, CYP2A6, CYP2E1 and CYP3A, have been identified as APAP-metabolizing enzymes. Among them, CYP2E1 was widely accepted as the major isoform responsible for the bioactivation of APAP based on several convincing pieces of evidence. Firstly, in vitro enzyme kinetic assays showed that purified CYP2E1 enzyme possessed low Km and high Vmax values for the formation of NAPQI and the bioactivation of APAP by liver microsomes was largely inhibited by CYP2E1 antibody (5,6). Secondly, there is a clear link between enhanced sensitivity to APAP hepatotoxicity and chronic alcoholism, which significantly increases the CYP2E1 levels in liver (7). Thirdly, APAP-induced hepatic necrosis mainly occurs in the centrilobular region, where CYP2E1 is highly expressed (8). Finally, Cyp2e1-null mice are highly resistant to APAP, compared to wild-type mice (9), while reintroduction of the human CYP2E1 gene into Cyp2e1-null mice reestablished the toxic response to APAP (10). Therefore, the Cyp2e1-null mouse line is an ideal model as the negative control for investigating the mechanism and biomarkers of the APAP-induced toxicity.
Metabolomics, a methodology for measuring small-molecule metabolite profiles and fluxes in biological matrices, following genetic modification or exogenous challenges, has become an important component of systems biology, complementing genomics, transcriptomics and proteomics (11,12). Combining advanced analytical instrumentation for comprehensive metabolite measurement with robust chemometric computation for detecting subtle changes in a large dataset, metabolomics techniques have been utilized to identify biomarkers and unravel pathophysiological mechanisms in many scientific fields, including xenobiotic metabolism (13) and toxicology (14). Recently, APAP-induced toxicity has also been investigated using metabolomics approaches. Two NMR-based studies have depicted the general changes caused by the APAP-elicited disruption of carbohydrate and lipid metabolism (15,16), and a capillary electrophoresis-MS-based study identified ophthalmic acid as a general biomarker of oxidative stress following glutathione depletion (17).
To obtain more insights into the underlying mechanism of APAP-induced toxicity and the role of CYP2E1, metabolite profiling and metabolomics of APAP-treated wild-type and Cyp2e1-null mice were conducted in this study. Profiling of major known APAP metabolites as well as glutathione and hydrogen peroxide assays revealed the potential role of CYP2E1-mediated oxidative stress in APAP-induced toxicity. Metabolomic analysis resulted in the identification of four toxicity-associated APAP metabolites that should find utility in monitoring the emergence of acetaminophen toxicity.
EXPERIMENTAL PROCEDURES
Reagents
APAP, APAP-glucuronide, p-aminophenol, α-ketoglutarate, hydrogen peroxide, horseradish peroxidase, HPLC-grade water, acetonitrile and formic acid were purchased from Sigma-Aldrich (St. Louis, MO). [acetyl-2H3]-APAP and 3-methoxy-APAP were purchased from SynFine Research (Richmond Hill, Ontario, Canada). 2,3,5,6-[2H4]-APAP and Cys-APAP were purchased from Toronto Research Chemicals (North York, Ontario, Canada). GS-APAP and NAC-APAP standards were kindly provided by Professor Bernhard Lauterburg, University of Bern, Switzerland.
Animal treatments and sample collection
The Cyp2e1-null mouse line (Cyp2e1−/−) was described previously (9). Female wild-type (Cyp2e1+/+) and Cyp2e1-null mice on the 129/Sv strain background, from 2 to 3 months of age, were used in this study. All animals were maintained in an NCI animal facility under a standard 12 h light/12 h dark cycle with food and water ad libitum. Handling and treatment procedures were in accordance with animal study protocols approved by the NCI Animal Care and Use Committee. APAP was dissolved in saline solution at doses ranging from 10 to 400 mg/kg and administered by intraperitoneal (i.p.) injection to mice. Control mice were treated with blank saline solution. Serum samples were collected by retro-orbital bleeding. Twenty-four hour urine samples were collected by housing mice in glass metabolic bowls (Jencons, Leighton Buzzard, U.K.) and 1-h, 2-h and 4-h urine samples were collected by combining urine in metabolic bowel and urine harvested from bladder emptying during retro-orbital bleeding. After CO2 euthanization, liver and other tissue samples were harvested. All samples were stored at −80 °C before analysis.
Assessment of APAP-induced toxicity
APAP-induced liver injury was evaluated by measuring the catalytic activities of asparate aminotransferase (AST) and alanine aminotransferase (ALT) in serum. Briefly, 1 μL serum was mixed with 200 μL AST or ALT assay buffer (Catachem, Bridgeport, CT) in a 96-well microplate, and the oxidation of NADH to NAD+ was monitored at 340 nm for 5 minutes.
APAP-induced kidney injury was evaluated by measuring the blood urea nitrogen (BUN) in serum. Briefly, 2 μL serum was mixed with 200 μL urea assay buffer (BioAssay Systems, Hayward, CA) in a 96-well microplate, and the reaction was monitored at 520 nm after a 30-min incubation at room temperature.
LC-MS analysis of glutathione
The levels of reduced glutathione (GSH) and oxidized glutathione (GSSG) in liver and GSH in mitochondria were measured by LC-MS/MS. Samples for total GSH and GSGS measurement were prepared by homogenizing liver in 10 volumes of 5% 5-sulfosalicylic acid. Precipitated protein was removed by centrifugation at 10,000 × g for 10 minutes and supernatant was diluted by deionized water prior to LC-MS analysis. Samples for mitochondrial GSH measurement was prepared by homogenizing liver in 10 volumes of Mito buffer (0.2 mM EDTA, 0.25 M sucrose, 10 mM Tris-HCl, pH 7.8). Cytosol fraction was removed by centrifugation at 10,000 × g for 20 minutes and pellet was resuspended in Mito buffer. Nuclear fraction was removed by centrifugation at 1,000 × g for 10 minutes. Mitochondrial fraction was precipitated by spinning supernatant at 18,000 × g for 10 minutes. Mitochondrial GSH was extracted by mixing mitochondrial pellet with 5% 5-sulfosalicylic acid. After removing protein by centrifugation, supernatant was diluted by deionized water and transferred to a sample vial for LC-MS analysis. Samples from whole liver homogenate or mitochondrial fraction were injected into a high-performance liquid chromatography system (PerkinElmer, Waltham, MA) using a Synergi Polar-RP column (Phenomenex, Torrance, CA, 50 × 2.1 mm i.d.). The flow rate through the column at ambient temperature was 0.2 ml/min with a gradient (methanol: water: acetonitrile, containing 0.1% formic acid) from 5: 85: 10 to 5: 40: 55 in a 5-min run. The column was equilibrated for 1.5 min before each injection. API 2000™ mass spectrometer (Applied Biosystems, Foster City, CA) was operated in the turbo ion spray mode with positive ion detection. The turbo ion spray temperature was maintained at 350°C, and a voltage of 5.5 kV was applied to the sprayer needle. Nitrogen was used as the turbo ion spray and nebulizing gas. Detection and quantification were performed using the multiple reactions monitoring mode, with m/z 308.0/75.9 for GSH and m/z 613.1/355.1 for GSSG.
Hydrogen peroxide assay
Hydrogen peroxide (H2O2) level in liver was determined by the ferrous thiocyanate assay (18). Samples were prepared by homogenizing liver in 10 volumes of 5% 5-sulfosalicylic acid. Precipitated protein was removed by centrifugation at 10,000 × g for 10 minutes. The H2O2 level in supernatant was determined by measuring the absorbance at 492 nm after reacting with 3.2 mM ferrous ammonium sulphate and 180 mM potassium thiocyanate.
UPLC-QTOFMS analysis of urine and serum
A 5 μL aliquot of diluted urine and serum samples was injected into a Waters UPLC-QTOFMS system (Mildford, MA). An Acquity UPLC™ BEH C18 column (Waters) was used to separate chemical components including APAP and its metabolites at 35°C. The mobile phase flow rate was 0.5 mL/min with an aqueous acetonitrile gradient containing 0.1% formic acid over a 10-min run. The QTOF Premier™ mass spectrometer was operated in the positive electrospray ionization (ESI) mode. Capillary voltage and cone voltage was maintained at 3 kV and 20 V, respectively. Source temperature and desolvation temperature were set at 120 °C and 350 °C, respectively. Nitrogen was used as both cone gas (50 L/h) and desolvation gas (600 L/h), and argon as collision gas. For accurate mass measurement, the QTOFMS was calibrated with sodium formate solution (range m/z 100–1000) and monitored by the intermittent injection of the lock mass sulfadimethoxine ([M+H]+ = 311.0814 m/z) in real time. Mass chromatograms and mass spectral data were acquired and processed by MassLynx software (Waters) in centroided format.
Determination of APAP metabolite profile in urine
Urine samples were collected for 24 h after i.p. injection of 10, 200 and 400 mg/kg APAP to wild-type and Cyp2e1-null mice. Samples for LC-MS analysis were prepared by mixing 50 μL of urine with 200 μL of 50% aqueous acetonitrile and centrifuging at 18,000 × g for 10 min to remove protein and particulates. Supernatants were injected into UPLC and separated by a gradient ranging from water to 95% aqueous acetonitrile containing 0.1% formic acid over a 10-min run. After data acquisition in QTOFMS, chromatograms and spectra of urine samples were processed by MetaboLynx software (Waters). APAP and its four major metabolites (Cys-APAP, NAC-APAP, APAP-G and APAP-S) were identified through accurate mass measurement, comparison with authentic standards and analysis of MS2 fragmentation pattern, and their peak areas were quantified to represent the signal intensities. Urinary metabolite profiles of APAP in wild-type and Cyp2e1-null mice were compared based on relative peak area in the total peak area of APAP and its four major urinary metabolites.
Quantitation of APAP and determination of APAP metabolite profiles in serum
Serum samples were collected at 1 h, 2 h, 4 h and 8 h after i.p. injection of 400 mg/kg APAP. One volume of serum was deproteinated by 20 volumes of 66% aqueous acetonitrile. After 10-min centrifugation at 18,000 × g, supernatant was injected into UPLC-QTOFMS for quantitation with a gradient of mobile phase ranging from water to 99% aqueous acetonitrile containing 0.1% formic acid over a 10-min run. To prepare the calibration curve, APAP standard was mixed with blank serum and diluted 20 times by 66% aqueous acetonitrile. Linear range from 0.1 μM to 50 μM of APAP (r = 0.99) was achieved by using dynamic range enhancement (DRE) function of QTOF Premier. Serum APAP concentrations were determined by the integration of peak area and fitting with a calibration curve using QuantLynx software (Waters).
To examine the metabolite profile of APAP in serum of wild-type and Cyp2e1-null mice, chromatograms and spectra of 1-h, 2-h and 4-h serum samples acquired by UPLC-QTOFMS were processed by MarkerLynx software (Waters). APAP and its major serum metabolites (GS-APAP, Cys-APAP, NAC-APAP, APAP-G and APAP-S) were identified through accurate mass measurement, comparison with authentic standards and analysis of MS2 fragmentation pattern. Relative abundances of APAP and its metabolites were determined by normalizing the single ion counts (SIC) of each metabolite versus the total ion counts (TIC) of each serum sample.
Principal components analysis (PCA)
Chromatographic and spectral data of wild-type and Cyp2e1-null mice were deconvoluted by MarkerLynx™ software. A multivariate data matrix containing information on sample identity, ion identity (RT and m/z) and ion abundance was generated through centroiding, deisotoping, filtering, peak recognition and integration. The intensity of each ion was calculated by normalizing the single ion counts (SIC) versus the total ion counts (TIC) in the whole chromatogram. The data matrix was further exported into SIMCA-P+™ software (Umetrics, Kinnelon, NJ), and transformed by mean-centering and Pareto scaling, a technique that increases the importance of low abundance ions without significant amplification of noise. Principal components were generated by PCA analysis to represent the major latent variables in the data matrix and were described in a scores scatter plot. Potential APAP metabolites were identified by analyzing ions contributing to the principal components and to the separation of sample groups in the loadings scatter plot.
Mass isotopomer analysis of novel APAP metabolites and structural elucidation
Twenty-four hour urine samples were collected after treating wild-type mice with 400 mg/kg [acetyl-2H3]-APAP or 400 mg/kg 2,3,5,6-[2H4]-APAP by i.p. injection, and then analyzed by UPLC-QTOFMS. Data from [acetyl-2H3]-APAP treatment were compared with those from unlabeled APAP treatment through a PCA-based metabolomic analysis. The identity of individual ion as APAP metabolite was validated by comparing extracted ion chromatograms from three treatments. The structure of each APAP metabolite was elucidated by tandem mass spectrometry (MS2) fragmentation with collision energy ramping from 15 to 35 eV.
In vitro transamination reaction of Cys-APAP
Liver and kidney were homogenized in microsomal buffer (50 mM potassium phosphate, 320 mM sucrose, 1 mM EDTA, pH 7.4) containing 100 μM pyridoxal-5-phosphate (1:10 w:v). The S9 fraction was prepared by centrifuging tissue homogenate at 9,000 × g for 10 min. The transamination reaction was conducted by incubating tissue homogenate or S9 supernatant with 5 mM α-ketoglutarate and 1 mM Cys-APAP in a phosphate buffered saline solution at 37°C for 30 min. The reaction was terminated by adding equal volumes of acetonitrile and the reaction products were further analyzed by LC-MS.
Peroxidase-mediated metabolism of APAP and Cys-APAP
Analytical reactions were performed according to Potter’s method (19). Briefly, 0.1 M potassium phosphate (pH 7.4), 1 mM APAP or Cys-APAP, and 2.5 U/mL horseradish peroxidase were pre-incubated at 25°C for 2 min before adding 1 mM H2O2. The reaction mix was incubated at 25°C for 5 min. The reaction was terminated by adding equal volume of ice-cold 90% aqueous methanol containing 2 mM ascorbate. Reaction products were further analyzed by LC-MS.
Statistics
Experimental values are expressed as mean ± standard deviation (SD). Statistical analysis was performed with two-tailed Student’s t-tests for unpaired data, with a P value of <0.05 was considered as statistically significant.
RESULTS
APAP metabolite profiles in wild-type and Cyp2e1-null mice
Elevation of serum aminotransferase activities is a reliable indicator of hepatic injury (20). Twenty-four hours after 200 mg/kg and 400 mg/kg APAP treatments, the activities of serum alanine aminotransferase (ALT) and asparate aminotransferase (AST) in wild-type and Cyp2e1-null mice were examined. Consistent with the previous report (9), serum ALT and AST activities in wild-type mice were dramatically increased by both treatments but their activities in Cyp2e1-null mice were unaffected by 200 mg/kg and slightly increased by 400 mg/kg treatment (Figure 1A–B). In addition, the effect of APAP treatment on kidney function of wild-type and Cyp2e1-null mice was determined by measuring blood urea nitrogen (BUN) levels. After a 400 mg/kg treatment, the BUN level in wild-type mice was much higher than its level in Cyp2e1-null mice and wild-type controls. These results indicated that not only CYP2E1 plays an important role in APAP-induced hepatotoxicity, but also contributes to the APAP-induced nephrotoxicity.
Figure 1.
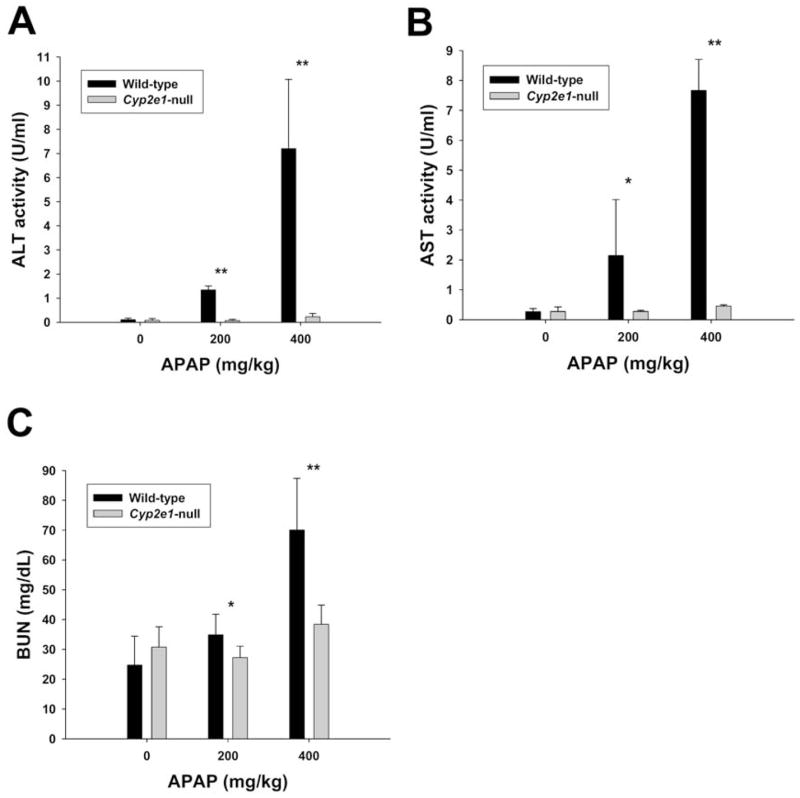
Determination of APAP-induced liver and kidney injury in wild-type and Cyp2e1-null mice. Serum samples were harvested from wild-type and Cyp2e1-null mice 24 h after the i.p. injection of 200 mg/kg and 400 mg/kg APAP. Values were represented as mean ± SD (n=4, * for P < 0.05 and ** for P < 0.01). A. Alanine aminotransferase (ALT) activity (U/ml). B. Aspartate aminotransferase (AST) activity (U/ml). C. Blood urea nitrogen (BUN) level (mg/dL).
Major urinary metabolites of APAP (I) have been identified previously as 3-cysteinyl-APAP (Cys-APAP: II); N-acetylcysteinyl-APAP (NAC-APAP: III), APAP-O-glucuronide (APAP-G: IV) and APAP-O-sulfate (APAP-S: V) (21). While APAP-G and APAP-S are formed by direct conjugation to facilitate the elimination and excretion of APAP, Cys-APAP and NAC-APAP are the products of multiple reactions including P450-mediated metabolic bioactivation and subsequent glutathione conjugation. Since CYP2E1 is one of the major enzymes capable of converting APAP to NAPQI, the metabolite profiles of APAP in wild-type and Cyp2e1-null mice were compared by LC-MS profiling of APAP and four major metabolites in urine. Chemical identities of urinary ions corresponding to APAP, Cys-APAP, NAC-APAP and APAP-G were confirmed by use of authentic standards. The ion corresponding to APAP-S was identified by accurate mass measurement and analysis of the MS2 fragmentation pattern (data not shown). The urinary metabolite profile of APAP was defined by calculating the relative abundances of APAP and four major metabolites in the whole APAP metabolite cluster (22). Surprisingly, with the 400 mg/kg treatment, which is the LD50 for wild-type but a nontoxic dose for Cyp2e1-null mice (9), urinary metabolite profiles of APAP in wild-type and Cyp2e1-null mice were quite comparable except for a slightly higher abundance of Cys-APAP in wild-type mice and slightly lower abundances of APAP-G and APAP-S in Cyp2e1-null mice (Figure 2A). This marginal difference in APAP metabolism was in clear contrast to the dramatic differences in the toxic response to 400 mg/kg APAP treatment between wild-type and Cyp2e1-null mice (Figure 1). To clarify this observation, urinary metabolite profiles of APAP in 200 mg/kg (a low toxic dose for wild-type) and 10 mg/kg (a non-toxic dose comparable to therapeutic dose in human) treatments were further examined. Distinct from 400 mg/kg treatment, a 200 mg/kg dose led to significantly higher abundance of urinary Cys-APAP and lower abundance of APAP in wild-type mice than those in Cyp2e1-null mice (Figure 2B). Furthermore, following 10 mg/kg APAP treatment, the differences between wild-type and Cyp2e1-null mice in APAP metabolism became even more apparent with a much higher abundance of Cys-APAP in wild-type mice and much higher abundances of APAP, APAP-G and APAP-S in Cyp2e1-null mice (Figure 2C).
Figure 2.

Distribution of APAP and its major metabolites in urine and serum of wild-type and Cyp2e1-null mice. Metabolite profiles of APAP in 24-h urine samples of wild-type and Cyp2e1-null mice were examined by LC-MS analysis of APAP and four major metabolites (Cys-APAP, NAC-APAP, APAP-G, APAP-S), and defined by their relative abundances (area % ± SD) that were calculated by normalizing individual peak area with total peak area of APAP and four metabolites (n=8, * for P < 0.05 and ** for P < 0.01). A. Urinary metabolite profile of wild-type and Cyp2e1-null mice after 400 mg/kg APAP treatment. B. Urinary metabolite profile after 200 mg/kg APAP treatment. C. Urinary metabolite profile after 10 mg/kg APAP treatment. D. Serum concentrations of APAP in wild-type and Cyp2e1-null mice at 1, 2, 4 and 8 h after 400 mg/kg APAP treatment (n=4).
To confirm the results from urinary metabolite profiling, the distribution of APAP and its major metabolites in serum during first 8 h after 400 mg/kg treatment was examined. Comparison of APAP pharmacokinetics in wild-type and Cyp2e1-null mice indicated that significant difference in serum concentrations of APAP did not occur until 4 h of treatment (Figure 2D). Subsequent analysis of the LC-MS signal abundances of APAP metabolites in serum revealed that at 1 h after dosing, serum metabolite profiles of wild-type and Cyp2e1-null mice were comparable while at 2 h and 4 h, higher abundances of 3-glutathionyl-APAP (GS-APAP) and Cys-APAP in wild-type mice were observed (Supplemental Table 1). Overall, these results suggested that when exposed to high concentrations of APAP, wild-type mice only have a slightly higher APAP-oxidizing capacity than Cyp2e1-null mice.
APAP-induced oxidative stress in wild-type and Cyp2e1-null mice
Reduced glutathione (GSH) is an essential thiol antioxidant for protecting cells from oxidative stress. One hallmark event in the APAP-induced toxicity is the depletion of intracellular glutathione, which then facilitates the attack from reactive APAP metabolites to biologically important macromolecules through covalent binding. To examine the influence of 400 mg/kg APAP on the redox balance in livers of wild-type and Cyp2e1-null mice, hepatic GSH levels were measured at 0, 1, 2, 4 and 24 h after treatment using LC-MS analysis. A much higher level of GSH was detected in untreated wild-type mouse liver comparing to that in Cyp2e1-null mice, while at 1 h and 2 h after APAP treatment a significant higher GSH level was observed in Cyp2e1-null mice even though both mouse lines had their hepatic GSH largely depleted (Figure 3A). Interestingly, at 4 h, hepatic GSH level in Cyp2e1-null mice was fully restored to the pre-treatment level, while GSH level in wild-type mouse liver was still about 8% of the control level. At 24 h, hepatic GSH levels in both mouse lines were largely recovered even though liver injury and other toxicological events had occurred in wild-type mice. Ratio between reduced and oxidized glutathione (GSH/GSSG) has been used as an indicator of oxidative stress (23). To examine the influence of APAP treatment on this index, hepatic GSSG levels in wild-type and Cyp2e1-null mice were measured at 0, 1, 2, 4 and 24 h using LC-MS analysis. Results indicated that the profile of hepatic GSSG levels during 24 h of post-treatment was largely similar to the profile of hepatic GSH except the comparable GSSG levels between wild-type and Cyp2e1-null mice at 4 h (Supplemental Figure 1A). Therefore, the GSH/GSSG ratio might not be an objective index for APAP-induced oxidative stress due to the fact that GSH is mainly converted to GS-APAP conjugate instead of GSSG after APAP overdose. Furthermore, mitochondria have been recognized as the main targets of APAP. It has been shown that APAP-induced oxidative stress can lead to the permeability transition in mitochondrial membrane and the disruption of energy production (24). Since CYP2E1 is also located in mitochondria (25), the influence of APAP treatment on mitochondrial GSH levels was examined. Overall, the changes elicited by APAP on the mitochondrial GSH levels of wild-type and Cyp2e1-null mice were very similar to the changes on total GSH levels in liver (Supplemental Figure 1B), which was consistent to the fact the mitochondrial GSH was originated from cytoplasm (26). Since prolonged glutathione depletion can lead to severe disruption of redox balance, hydrogen peroxide (H2O2) levels in liver were further examined. During the first 4 h of APAP treatment, hepatic H2O2 levels in Cyp2e1-null mice remained largely unchanged while its level in wild-type mice dramatically increased at 4 h, correlating with the low glutathione levels at this time point (Figure 3B). Noticeably, at 24 h wild-type mice still had a significantly higher H2O2 level than in Cyp2e1-null mice, which was different to the glutathione profile in both mouse lines.
Figure 3.

Influence of APAP treatment on the redox balance in wild-type and Cyp2e1-null mice. Liver samples collected at 0, 1, 2, 4, 24 h after i.p. administration of 400 mg/kg APAP were processed as described in the Experimental procedures (n=4, * for P < 0.05 and ** for P < 0.01). A. Hepatic GSH levels in wild-type and Cyp2e1-null mice. GSH levels were determined by LC-MS analysis. B. Hepatic H2O2 levels in wild-type and Cyp2e1-null mice. H2O2 levels were determined by the ferrous thiocyanate assay.
Metabolomics and mass isotopomer analysis of APAP metabolism in wild-type and Cyp2e1-null mice
Metabolite profiling of wild-type and Cyp2e1-null mice showed the importance of CYP2E1 in APAP metabolism, especially under conditions of low-dose APAP treatment (Figure 2). However, the results from the high-dose treatments indicated that the role of CYP2E1 to the APAP-induced toxicity might not be limited to its contribution to the formation of major NAPQI-derived metabolites since the urinary abundances of major APAP metabolites were largely comparable between wild-type and Cyp2e1-null mice in spite of dramatic differences in liver toxicity. To further explore the mechanism underlying this observation, a metabolomics approach was adopted to examine the urine samples from two mouse lines. After data collected from the chromatograms and mass spectra of urine samples were processed by unsupervised principal components analysis (PCA), a multivariate model was constructed to delineate the relationship among samples and the contribution of each detected urinary chemical ion to the model. As shown in the scores scatter plot, urine samples from APAP treatment were clearly separated from the control in the first component (PC1) of the model, and the intrinsic differences between wild-type and Cyp2e1-null mice were mainly reflected by the second principal component (PC2) of the model (Figure 4A). The treatment- and genotype-dependent groupings of urine samples were also demonstrated in a three-component PCA model (Supplemental Figure 2). Furthermore, among the samples from APAP treatments, wild-type mice administered 400 mg/kg APAP were clearly separated from other treated mice and correlated well with the severe liver toxicity occurring in this group of mice (encircled in Figure 4A). Analysis of urinary ions in the loadings plot showed the strong contribution of major APAP metabolites (I–V) and their in-source fragments (Supplemental Table 1) to the PC1, which largely defined the separation between the mice treated with APAP and untreated control (Figure 4B). More importantly, a group of urinary ions corresponding to the distinctive grouping of wild-type mice treated with 400 mg/kg APAP were identified (in the region between two dashed lines in Figure 4B). Among them, several ions were not detected in the untreated control. To determine whether those ions were minor metabolites of APAP, urine samples of 400 mg/kg APAP treatment were compared with the samples of 400 mg/kg [acetyl-2H3]-APAP treatment using a mass isotopomer analysis-based metabolomics approach. As expected, urine samples from [acetyl-2H3]-APAP treatment were separated from their counterparts from unlabeled APAP treatment in a two-component PCA model (Figure 4C). Since the influences of both treatments on the endogenous components of urine were very similar, the ions contributing to the separation between two treatments should be mainly APAP and its metabolites. This hypothesis was validated after analyzing the loadings plot of APAP versus [acetyl-2H3]-APAP model in which labeled and unlabeled APAP and their metabolites were positioned in a largely symmetrical pattern (Figure 4D). Besides detecting major APAP metabolites (I–V), three more ions were confirmed as the minor APAP metabolites (VI–VIII) in the loadings plot using this approach (Figure 4D). Metabolite IX was further confirmed as a minor APAP metabolite after treating wild-type mice with 2,3,5,6-[2H4]-APAP instead of [acetyl-2H3]-APAP treatment since metabolite IX was metabolically transformed from deacetylated APAP. Because of the correlation between those minor metabolites (VI–IX) and APAP-induced toxicity, their chemical structures were further elucidated by accurate mass measurement, MS2 fragmentation (MS2 spectra of metabolite I–IV were presented in Supplemental Figure 3A–D, respectively), as well as various in vitro and in vivo assays (Table 1).
Figure 4.

Identification of urinary APAP metabolites through LC-MS-based metabolomics. LC-MS measurement was conducted using UPLC-QTOFMS, data processing using MarkerLynx software, and principal components analysis using SIMCA-P+ software. Details of data processing and model construction were described in the Experimental procedures. A. Scores plot of a PCA model on 24-h urine samples from control and APAP-treated wild-type and Cyp2e1-null mice. A two-component PCA model was constructed to characterize the relationship among 6 mouse groups (8 mice/group), including wild-type mice (control: ■; 200 mg/kg APAP: ▲; 400 mg/kg APAP: ●) and Cyp2e1-null mice (control: □; 200 mg/kg APAP: △; 400 mg/kg APAP: ○). The t[1] and t[2] values represent the scores of each sample in principal component 1 and 2, respectively. Fitness (R2) and prediction power (Q2) of this PCA model are 0.486 and 0.429, respectively. B. Loadings plot of chemical ions from 24-h urine samples of control and APAP-treated wild-type and Cyp2e1-null mice. The p[1] and p[2] values represent the contributing weights of each ion to principal components 1 and 2 of the PCA model, respectively. Major APAP metabolites (I–V) and the ions (VI–IX) contributing to the separation of wild-type mice treated with 400 mg/kg APAP from other mouse groups as well as their in-source fragments were labeled. C. Scores plot of a PCA model on 24-h urine samples from wild-type mice treated with 400 mg/kg APAP ( ) and wild-type mice treated with 400 mg/kg [acetyl-2H3]-APAP (▴). Fitness (R2) and prediction power (Q2) of this PCA model are 0.75 and 0.496, respectively. D. Loadings plot of chemical ions in the urine samples from APAP and deuterated APAP treatment. APAP and its metabolites (I–IX) as well as their in-source fragments were labeled (* for [acetyl-2H3]-APAP metabolites).
Table 1.
APAP metabolite ions identified in the LC-MS-based metabolomic analysis of the urine samples from APAP-treated wild-type and Cyp2e1-null mice. Conditions for LC-MS analysis were described in the Experimental procedures. APAP metabolites and their in-source fragments were identified in the loadings plot of PCA model and further characterized by accurate mass measurement, MS2 fragmentation and comparison with authentic standards.
| Ions | RT (min) | [M+H]+ | Formula | Identity |
|---|---|---|---|---|
| I | 1.96 | 152.0700 | C8H10NO2+ | APAP |
| Ii | 1.96 | 110.0587 | C6H8NO+ | APAP fragment |
| II | 1.86 | 271.0752 | C11H15N2O4S+ | Cys-APAP |
| IIi | 1.86 | 140.0161 | C6H6NOS+ | Cys-APAP fragment |
| IIii | 1.86 | 208.0417 | C10H10NO2S+ | Cys-APAP fragment |
| IIiii | 1.86 | 182.0268 | C8H8NO2S+ | Cys-APAP fragment |
| III | 2.55 | 313.0860 | C13H17N2O5S+ | NAC-APAP |
| IIIi | 2.55 | 182.0267 | C8H8NO2S+ | APAP-NAC fragment |
| IV | 1.70 | 328.1045 | C14H18NO8+ | APAP glucuronide |
| IVi | 1.70 | 152.0714 | C8H10NO2+ | APAP glucuronide |
| V | 1.89 | 232.0270 | C8H11NO5S+ | APAP sulfate |
| VI | 2.34 | 270.0437 | C11H12NO5S+ | SAMP |
| VII | 2.01 | 358.1138 | C15H20NO9+ | 3-methoxy-APAP-G |
| VIIi | 2.01 | 182.0813 | C9H12NO3+ | 3-methoxy-APAP-G fragment |
| VIII | 2.81 | 301.1183 | C16H17N2O4+ | 3,3′-biacetaminophen |
| IX | 4.54 | 281.0041 | C11H9N2O3S2+ | benzothiazine compound |
Identification of metabolite VI as a transamination product of Cys-APAP
Mass isotopomer analysis confirmed ion 270.04+ (VI) as an APAP metabolite by comparing the extracted ion chromatogram from 400 mg/kg APAP treatment with those from 400 mg/kg [acetyl-2H3]-APAP and 2,3,5,6-[2H4]-APAP treatments (Figure 5A). The presence of ion 273.06+ in the urine of both [acetyl-2H3]-APAP- and 2,3,5,6-[2H4]-APAP-treated mice indicated that the metabolizing reaction for forming metabolite VI occurred in the benzene ring instead of N-acetyl group of APAP. Its molecular formula was defined as C11H12NO5S+ by accurate mass measurement and analysis of isotope abundance pattern, and its MS2 fragmentation spectrum bears a great similarity to that of Cys-APAP (II) (Supplemental Figure 3B). Major MS2 fragment ions of metabolite VI (Figure 5B) are interpreted as follows: 270.043+ (parent ion); 252.033+ (-H2O); 224.043+ (-HCOOH); 208.043+ (-CO2 from 252.033+); 182.028+ (-C3H4O3, loss of CH3COCOOH); 140.017+ (-CH2=C=O from 182.028+). Based on the abovementioned information, the chemical identity of metabolite VI was determined as S-(5-acetylamino-2-hydroxyphenyl)mercaptopyruvic acid (SAMP), a novel APAP metabolite potentially formed by the transamination reaction of Cys-APAP. Interestingly, albeit its modest presence in urine, SAMP was not detected in the serum samples of APAP-treated mice (Figure 5C), indicating that kidney should be the site where Cys-APAP was converted to SAMP. To examine this hypothesis, in vitro transamination reaction of Cys-APAP was conducted using tissue homogenates of liver and kidney. Results showed that Cys-APAP aminotransferase activity in kidney was more than 10-times higher than that in liver (Figure 5D). Comparison of the appearance of SAMP in the 24-h urine of 200 mg/kg and 400 mg/kg APAP treatments revealed the genotype-dependent differences between two mouse lines as the relative abundance of SAMP in wild-type mice was about 2-fold higher than that of Cyp2e1-null mice for both doses (Figure 5E). Furthermore, comparison of the urine samples collected for 1, 2, 4, 24 h following 400 mg/kg treatment indicated that the relative abundance of SAMP in the urine of wild-type mice was consistently higher than that of Cyp2e1-null mice even though its urinary level in both mouse lines decreased progressively during the first 24 h of APAP treatment (Figure 5F).
Figure 5.

Identification and characterization of metabolite VI as S-(5-acetylamino-2-hydroxyphenyl)mercaptopyruvic acid (SAMP). A. Presence of metabolite XI in the urine of wild-type mice treated with 400 mg/kg APAP, [acetyl-2H3]-APAP and 2,3,5,6-[2H4]-APAP. Ion chromatograms were prepared by extracting ions in the 20 ppm mass range of 270.044+ (APAP), 273.064+ ([acetyl-2H3]-APAP) and 273.064+ (2,3,5,6-[2H4]-APAP), respectively. B. MS2 spectrum of metabolite VI. Major fragment ions were interpreted in the inlaid structural diagrams. C. Comparison of the presence of Cys-APAP and SAMP in the urine and serum from APAP treatment. Ion chromatograms were prepared by extracting ions in the 20 ppm mass range of Cys-APAP (271.075+) and SAMP (270.044+). D. In vitro transamination reaction converting Cys-APAP to SAMP. Overlayed ion chromatograms from the reaction between liver/kidney homogenates and Cys-APAP were prepared by extracting ions in the 20 ppm mass range of SAMP (270.044+) and scaled by the counts of SAMP ion (the counts from kidney-mediated reaction was used as 100%). E. Relative abundances of metabolite VI in the 24-h urine of wild-type and Cyp2e1-null mice treated with 200 and 400 mg/kg APAP (n=8). F. Relative abundances of metabolite VI in the 1-h, 2-h, 4-h and 24-h urine of wild-type and Cyp2e1-null mice treated with 400 mg/kg APAP. Relative abundances of metabolite VI (mean ± SD in parts per ten thousand) were determined by normalizing the single ion counts of metabolite VI versus the total ion counts of each urine sample (n=4 for 1-h, 2-h, 4-h urine, * for P < 0.05 and ** for P < 0.01).
Identification of metabolite VII as 3-methoxyacetaminophen-4-O-glucuronide
Ion 182.08+ (VIIi) as the in-source fragment of ion 358.11+ (VII) was implied by the neutral loss of mass 176 (loss of glucuronic acid moiety) and the same retention time for parent and daughter ions. Mass isotopomer analysis confirmed that both 358.11+ (Figure 6A) and 182.08+ (Figure 6B) ions originated from APAP by comparing extracted ion chromatogram from unlabeled APAP treatment with those from [acetyl-2H3]-APAP and 2,3,5,6-[2H4]-APAP treatments. Examination of empirical formula (C9H12NO3+ based on the accurate mass measurement) and MS2 fragmentation pattern of ion 182.08+ (Figure 6C) established its identity as protonated 3-methoxyacetaminophene (VIIi). Major MS2 fragment ions of ion VIIi are interpreted as follows: 182.081+ (parent ion); 140.071+ (-CH2=C=O); 108.045+ (-CH3OH from 140.071+, loss of methoxy group). Therefore, the chemical identity of metabolite VII was determined to be 3-methoxyacetaminophen-4-O-glucuronide (3-CH3O-APAP-G), which was further confirmed by β-glucuronidase treatment and comparison with authentic 3-methoxyacetaminophen (3-CH3O-APAP) standard (data not shown). Formation of 3-CH3O-APAP-G in wild-type and Cyp2e1-null mice occurred in a dose- and time-dependent pattern. At 200 mg/kg dose, both wild-type and Cyp2e1-null mice generated comparable amounts of 3-CH3O-APAP-G during the first 24 h of APAP treatments. However, at 400 mg/kg dose, the relative abundance of 3-CH3O-APAP-G in wild-type was much higher than that in Cyp2e1-null mice even though both mouse lines converted more APAP to 3-CH3O-APAP-G at this dose than at 200 mg/kg dose (Figure 6D). Furthermore, the relative abundances of 3-CH3O-APAP-G in 1-h urine after 400 mg/kg dosing were comparable between wild-type and Cyp2e1-null mice (Figure 6E). Significantly higher levels of 3-CH3O-APAP-G in wild-type was achieved at 2 h and maintained through 24 h, possibly by sustained biosynthesis in wild-type mice and faster elimination in Cyp2e1-null mice (Figure 6E).
Figure 6.
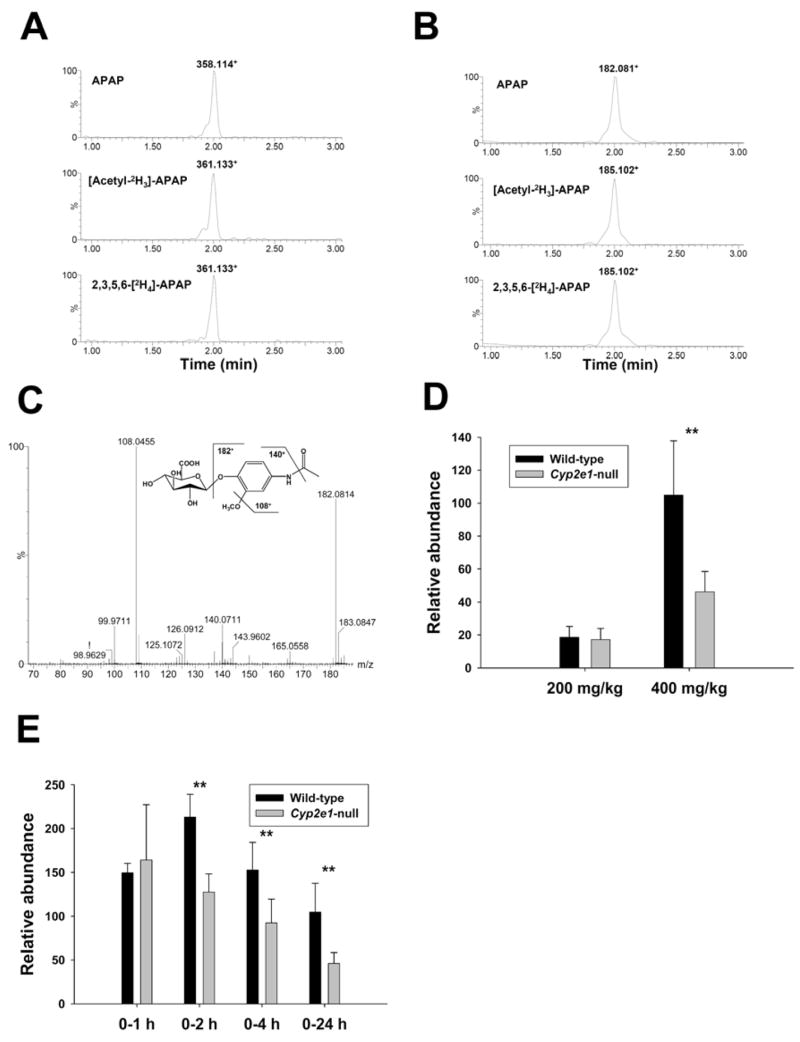
Identification and characterization of metabolite VII as 3-methoxy-APAP glucuronide. A. Presence of metabolite VII in the urine of wild-type mice treated with 400 mg/kg APAP, [acetyl-2H3]-APAP and 2,3,5,6-[2H4]-APAP. Ion chromatograms were prepared by extracting ions in the 20 ppm mass range of 358.114+ (APAP), 361.133+ ([acetyl-2H3]-APAP) and 361.133+ (2,3,5,6-[2H4]-APAP), respectively. B. Presence of ion VIIi in the urine of wild-type mice treated with 400 mg/kg [acetyl-2H3]-APAP and 2,3,5,6-[2H4]-APAP. Ion chromatograms were prepared by extracting ions in the 20 ppm mass range of 182.081+ (APAP), 185.102+ ([acetyl-2H3]-APAP) and 185.102+ (2,3,5,6-[2H4]-APAP), respectively. C. MS2 spectrum of ion VIIi. Major fragment ions were interpreted in the inlaid structural diagrams. D. Relative abundances of metabolite VII in the 24-h urine of wild-type and Cyp2e1-null mice treated with 200 and 400 mg/kg APAP (n=8). E. Relative abundances of metabolite VII in the 1-h, 2-h, 4-h and 24-h urine of wild-type and Cyp2e1-null mice treated with 400 mg/kg APAP. Relative abundances of metabolite VII (mean ± SD in parts per ten thousand) were determined by normalizing the single ion counts of metabolite VII versus the total ion counts of each urine sample (n=4 for 1-h, 2-h, 4-h urine, * for P < 0.05 and ** for P < 0.01).
Identification of metabolite VIII as a dimerization product of APAP
Mass isotopomer analysis confirmed ion 301.11+ (VIII) as an APAP metabolite by comparing extracted ion chromatogram from 400 mg/kg APAP treatment with those from 400 mg/kg [acetyl-2H3]-APAP and 2,3,5,6-[2H4]-APAP treatments (Figure 7A). The presence of ion 307.16+ in the urine of [acetyl-2H3]-APAP-treated mice implied the reaction between two APAP molecules while the presence of ion 307.16+ in the urine of 2,3,5,6-[2H4]-APAP-treated mice indicated that the dimerization reaction for forming metabolite VIII occurred to the benzene ring of APAP. The chemical identity of metabolite VIII was further designated as 3,3′-biacetaminophen based on accurate mass measurement (C16H17N2O4+) and MS2 fragmentation pattern (Figure 7B). Major MS2 fragment ions of ion VIII are enlisted and interpreted as follows: 301.120+ (parent ion); 283.110+ (-OH); 259.109+ (-CH2=C=O); 241.098+ (-H2O from 259.109+); 217.099+ (-CH2=C=O from 259.109+); 200.072+ (-NH3 from 217.099+). It has previously been shown that the hydrogen peroxide-dependent APAP dimerization or polymerization occurred in a horseradish peroxidase (HRP)-catalyzed reaction, in which APAP functions as an antioxidant (19). Therefore, by comparing its extracted ion chromatogram from the APAP-treated mouse urine to the MS chromatogram of HRP-mediated APAP dimerization reaction (Figure 7C), the structure of metabolite VIII was further confirmed as APAP dimer because of the same retention time and MS2 fragmentation pattern (data not shown). Examination of dose responses and kinetics revealed a distinctive pattern for the generation of APAP dimer in wild-type and Cyp2e1-null mice. At 200 mg/kg dose, unexpectedly, Cyp2e1-null mice yielded significantly more APAP dimer than wild-type while at 400 mg/kg dose the production of APAP dimer in wild-type mice was much higher than that in Cyp2e1-null mice (Figure 7D). Comparing 400 mg/kg to 200 mg/kg treatment, the increase of APAP dimer in wild-type was more 10-fold, but the increase in Cyp2e1-null mice was proportional to the increase in treatment dose (Figure 7D). A time-course study showed that the relative abundance of APAP dimer in wild-type mice remained relatively unchanged during 24 h of 400 mg/kg treatment while its level in Cyp2e1-null mice gradually decreased (Figure 7E). Therefore, even though the relative abundance of APAP dimer in Cyp2e1-null mice was significantly higher than that in wild-type mice at 1 h of treatment, wild-type mice had higher levels of APAP dimer than Cyp2e1-null mice at the end of 24 h treatment (Figure 7E).
Figure 7.

Identification and characterization of metabolite VIII as APAP dimer. A. Presence of metabolite VIII in the urine of wild-type mice treated with 400 mg/kg APAP, [acetyl-2H3]-APAP and 2,3,5,6-[2H4]-APAP. Ion chromatograms were prepared by extracting ions in the 20 ppm mass range of 301.118+ (APAP), 307.160+ ([acetyl-2H3]-APAP) and 307.160+ (2,3,5,6-[2H4]-APAP), respectively. B. MS2 spectrum of metabolite VIII. Major fragment ions were interpreted in the inlaid structural diagrams. C. LC-MS analysis of the products from the HRP-mediated reaction between APAP and H2O2. Peaks corresponding to APAP, APAP dimer, trimer and tetramer were labeled in the ion chromatogram of the reaction (upper panel), respectively. The peak corresponding to APAP dimer was also labeled in the extracted ion chromatogram of APAP-treated urine (lower panel). D. Relative abundances of metabolite VIII in the 24-h urine of wild-type and Cyp2e1-null mice treated with 200 and 400 mg/kg APAP (n=8). E. Relative abundances of metabolite VIII in the 1-h, 2-h, 4-h and 24-h urine of wild-type and Cyp2e1-null mice treated with 400 mg/kg APAP. Relative abundances of metabolite VIII (mean ± SD in parts per ten thousand) were determined by normalizing the single ion counts of metabolite VIII versus the total ion counts of each urine sample (n=4 for 1-h, 2-h, 4-h urine, * for P < 0.05 and ** for P < 0.01).
Identification of metabolite IX as a benzothiazine compound
Mass isotopomer analysis confirmed ion 281.00+ (IX) as an APAP metabolite by comparing extracted ion chromatograms from 400 mg/kg APAP treatment with that from 400 mg/kg 2,3,5,6-[2H4]-APAP treatment (Figure 8A). The presence of the same 281.00+ ion following 400 mg/kg [acetyl-2H3]-APAP treatment implied that ion 281.00+ might originate from deacetylated APAP since the deuterium label is located in the acetyl group of APAP (Figure 8A). To examine this hypothesis, mice were treated with p-aminophenol (PAP, which is deacetylated APAP). As expected, ion 281.00+ was detected in the 24-h urine of PAP treatment (Figure 8B). Empirical formula of metabolite IX was determined to be C11H8N2O3S2 by accurate mass measurement, and the presence of sulfur atom in the structure was further suggested by the prominent appearance of [M+H+2]+ isotopic ion, indicating that metabolite IX was originated from thiol conjugates of APAP, most probably cysteine conjugate. Because of its high degree of unsaturation as suggested by empirical formula, metabolite IX should possess an unsaturated bicyclic structure. This hypothesis was supported by its much longer UPLC retention time (4.54 min) in comparison to other APAP metabolites (Table 1). To our knowledge, the ring-closing reaction on APAP metabolites has not previously been reported. Nevertheless, natural ring-closing reactions on meta-phenolic cysteine conjugates, such as the peroxidase-mediated biotransformation of cysteinyldopas to benzothiazinylalanines during melanin biosynthesis, have been well documented (27). Because of the structural similarity between cysteinyldopa and Cys-APAP, the possibility of forming benzothiazine compound from Cys-APAP was explored. Indeed, after mixing Cys-APAP with HRP and H2O2, 7-N-acetylamino-1,4-benzothiazine, formed by cyclization of Cys-APAP by dehydration and decarboxylation, was readily detected by LC-MS (Figure 8C) and confirmed by MS2 fragmentation (Supplemental Figure 4). Analysis of MS2 fragmentation of ion 281+ provided further evidence supporting potential benzothiazine structure (Figure 8D). Major MS2 fragment ions of ion IX are interpreted as follows: 281.005+ (parent ion); 235.000+ (-HCOOH); 193.973+ (-CH3CN from 235.000+); 177.012+ (-CH2=C=S from 235.000+). Although the exact structure of metabolite IX was not elucidated in this study, it is possible that it may contain a tricyclic benzothiazine moiety according to the above as well as its exceptional degree of unsaturation and its late elution time (later than 7-N-acetylamino-1,4-benzothiazine). Examination of the appearance of metabolite IX in urine indicated that the relative abundances of metabolite IX in the APAP-treated wild-type and Cyp2e1-null mice were well correlated to the toxicity. In both 200 and 400 mg/kg treatments, wild-type mice produced more metabolite IX than Cyp2e1-null mice. Dose increase from 200 mg/kg to 400 mg/kg led to about 4-fold increment of the urinary level of metabolite IX in wild-type mice but no significant change in Cyp2e1-null mice (Figure 8E). Similarly, after 400 mg/kg dosing, the relative abundance of metabolite IX in Cyp2e1-null mice remained relatively unchanged while its level in wild-type mice gradually increased during the first 24 h of the treatment (Figure 8F).
Figure 8.

Identification and characterization of metabolite IX as a benzothiazine compound. A. Presence of metabolite IX in the urine of wild-type mice treated with 400 mg/kg APAP, [acetyl-2H3]-APAP and 2,3,5,6-[2H4]-APAP. Ion chromatograms were prepared by extracting ions in the 20 ppm mass range of 281.005+ (APAP), 281.005+ ([acetyl-2H3]-APAP) and 284.025+ (2,3,5,6-[2H4]-APAP), respectively. B. Presence of metabolite IX in the urine of wild-type mice treated with 400 mg/kg p-aminophenol (PAP). Peaks corresponding to metabolite IX were labeled in the extracted ion chromatograms of PAP (lower panel) and APAP (upper panel) treatments. C. MS2 spectrum of metabolite IX. Major fragment ions were interpreted in the inlaid structural diagrams. D. LC-MS analysis of the products from the HRP-mediated reaction between Cys-APAP and H2O2. Peaks corresponding to Cys-APAP (271.045+) and N-acetylamino-1,4-benzothiazine (207.059+) were labeled in the ion chromatogram of the reaction. E. Relative abundances of metabolite IX in the 24-h urine of wild-type and Cyp2e1-null mice treated with 200 and 400 mg/kg APAP (n=8). F. Relative abundances of metabolite IX in the 1-h, 2-h, 4-h and 24-h urine of wild-type and Cyp2e1-null mice treated with 400 mg/kg APAP. Relative abundances of metabolite IX (mean ± SD in parts per ten thousand) were determined by normalizing the single ion counts of metabolite IX versus the total ion counts of each urine sample (n=4 for 1-h, 2-h, 4-h urine, * for P < 0.05 and ** for P < 0.01).
DISCUSSION
Since CYP2E1 is widely accepted as an important enzyme for the biotransformation of APAP to NAPQI, it was reasonable to propose that Cyp2e1-null mice should generate much less NAPQI and correspondently less thiol conjugates (GS-APAP, Cys-APAP, NAC-APAP) than wild-type mice, and also produce more detoxication products (APAP-G and APAP-S) than wild-type mice. This hypothesis was validated in the low-dose (10 mg/kg) APAP treatment. However, based on the results from pharmacokinetics and metabolite profiling of urine and serum in this study (Figure 2 and Supplemental Table 1), the differences between wild-type and Cyp2e1-null mice in the metabolism of APAP were dramatically reduced in the 200 mg/kg treatment group compared to 10 mg/kg treatment and became minimal at a dose of 400 mg/kg, indicating that the relative contribution of CYP2E1 to the formation of NAPQI and its thiol conjugates decreased following the dose increase of APAP. This unexpected observation was in clear contrast to the dramatic differences between wild-type and Cyp2e1-null mice in their responses to the high-dose APAP treatments, especially the 400 mg/kg treatment, and therefor suggested the possibility of an alternative mechanism for explaining the resistance of Cyp2e1-null mice to APAP treatment. Results from in vitro enzyme kinetics and antibody inhibition assays have shown that other P450s, such as CYP1A2 and CYP3A, can significantly contribute to the NAPQI formation, especially at high concentration (5,6). The importance of CYP1A2 in the metabolism of high-dose APAP in vivo was further demonstrated by the increased covalent binding in β-napthaflavone-pretreated mice (28) and the exceptional resistance to the APAP-induced toxicity in CYP2E1 and CYP1A2 double knockout mice (29). The potential involvement of CYP3A in the in vivo bioactivation of APAP was also implied by the studies on alcohol-enhanced APAP toxicity (30,31) and the pregnane X receptor (PXR) null mouse model (32). In fact, it was recently reported that liver microsomes from wild-type and Cyp2e1-null mice had comparable activities for generating GS-APAP (30). Therefore, it is highly possible that in the high-dose APAP treatments, CYP1A2 and CYP3A as well as other P450s with high Km values can compensate for the deficiency of CYP2E1 in Cyp2e1-null mice for converting APAP to NAPQI, resulting in a metabolite profile similar to wild-type mice.
Covalent binding was originally proposed as the mechanism for the initiation of APAP-induced toxicity based on the observation that extensive arylation of macromolecules occurred after NAPQI formation (33). However, many subsequent studies have shown that the resistance to APAP can occur without a decrease of covalent binding, suggesting that the arylation of proteins and lipids might not be the determining factor in the APAP-induced toxicity (4). Our current results also supported this view since the similar levels of thiol-NAPQI conjugates observed in wild-type and Cyp2e1-null mice in the early hours of APAP treatment did not correlate well with the observed toxicity in these two mouse lines. Oxidative stress caused by APAP metabolism has been proposed as an alternative mechanism based on the identification of APAP-elicited reactive oxygen species (ROS) (34,35) and the protective effect of antioxidants and detoxicating enzymes (36). Distinct from the transient metabolism of APAP, the production of ROS and the effect of oxidative stress can be prolonged, as indicated by the clinical observation that the administration of N-acetylcysteine (NAC) as late as 16 h after APAP overdosing can still be protective against hepatotoxicity even though at that time point APAP has been completely metabolized (37). Results from the examination of hepatic glutathione and hydrogen peroxide levels in this study also implied a role for oxidative stress in the APAP-induced toxicity. At 1 h and 2 h after treatment, both wild-type and Cyp2e1-null mice had their total and mitochondrial GSH in liver dramatically depleted, indicating a severe oxidative stress occurring in both mouse lines. However, at 4 h, compared to the 8 % of control level in wild-type mice, the hepatic GSH level in Cyp2e1-null mice was fully restored to normal, suggesting a rapid recovery from APAP-elicited oxidative stress. Disruption of redox balance in liver after APAP treatment was further reflected by the hydrogen peroxide level, which was significantly higher in wild-type than in Cyp2e1-null mice 4 h after treatment. In fact, the resistance of Cyp2e1-null to APAP treatment was consistent with the known relationship between CYP2E1 and oxidative stress (38). Compared to other P450s, CYP2E1 possesses a higher NADPH oxidase activity, which leads to the increased production of hydrogen peroxide and superoxide as well as hydroxyl radical through the Fenton reaction (39). Indeed, it was shown that the ROS-producing function of CYP2E1 significantly contributes to ethanol-induced lipid peroxidation (40). Interestingly, in contrast to CYP2E1, CYP1A2 can protect against the ROS production in microsomes (41). Therefore, it is possible that the simultaneous generation of ROS during the CYP2E1-mediated APAP biotransformation results in a lasting oxidative stress in wild-type mice while this effect is greatly reduced in Cyp2e1-null mice by the removal of CYP2E1 and the shift of NAPQI-forming reaction to CYP1A2 and/or CYP3A.
Since the dramatic differences between wild-type and Cyp2e1-null mice in the toxic response was not reflected by metabolite profiling in this study, a metabolomic approach was adopted to characterize the urine metabolomes of both mouse lines. Using unsupervised PCA method, wild-type mice treated with 400 mg/kg APAP were distinctively separated from other mouse groups, and this separation was associated with a group of minor APAP metabolites (VI–IX) instead of major APAP metabolites (I–V). In addition to the separation between untreated and treated mouse groups in the PCA model, metabolomic analysis also revealed a distinctive separation between wild-type and Cyp2e1-null mice, especially in untreated controls, indicating the existence of some genotype-dependent intrinsic difference between two mouse lines. Several ions contributing to this separation were identified (data not shown), but whether the biochemical processes involved in the biogenesis of those chemicals are related to the toxic response to APAP treatment is still under investigation. To confirm that the toxicity-associated urinary metabolites (VI–IX) originated from APAP, a novel mass isotopomer analysis-based metabolomics was conducted using the same dose of unlabeled APAP and deuterated APAP. Since the mass values of endogenous compounds were not affected by APAP treatment, the majority of labeled and unlabeled APAP metabolites were conveniently displayed outside of endogenous compounds-comprised ion cluster in the loadings plot. This approach, is complementary to the vehicle-versus-treatment approach (42) and wild-type-versus-transgenic approach (43) and provides an efficient and convenient tool to identify and validate xenobiotic metabolites in complex biological samples (13). Compared to the traditional empirical methods for metabolite identification, the metabolomics-based methods have clear advantages in the rationalization and visualization of metabolite identification processes. Therefore, more applications of this novel technological platform in the pharmacological and toxicological fields are expected.
Identification and characterization of four urinary metabolites (VI–IX) elevated in the urine of wild-type mice treated with 400 mg/kg APAP provided more insights into the APAP-induced toxicity and further expanded the knowledge on the metabolic pathways of APAP (Figure 9). Potential mechanisms and significance of their high-abundance appearance in the APAP-treated wild-type mice are discussed as follows.
Figure 9.
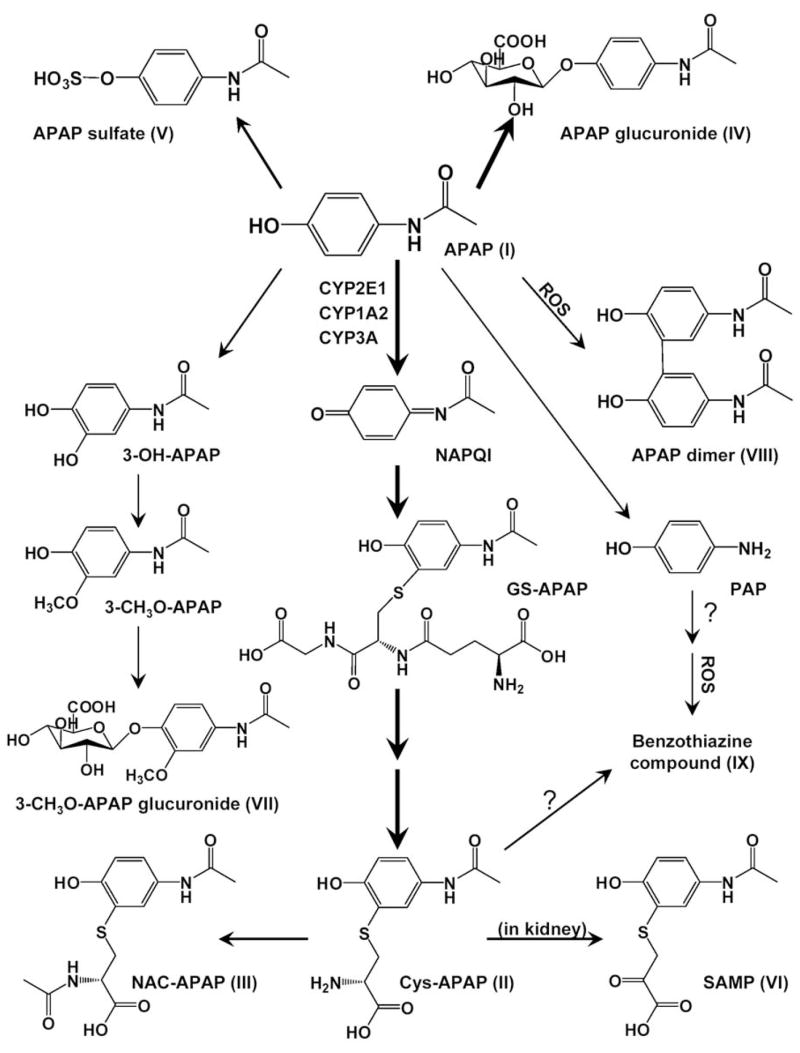
Major in vivo APAP metabolic pathways. Thick lines represent major pathways, and thin lines denote minor pathways.
Metabolite VI (S-(5-acetylamino-2-hydroxyphenyl)mercaptopyruvic acid)
The mercaptopyruvate conjugate of APAP has not been reported previously. Nevertheless, other mercaptopyruvate conjugates have been identified as the metabolites of halogenated hydrocarbons (44) and isothiocyanate compounds (45) through a transamination reaction on cysteine conjugates. In fact, cysteine conjugate aminotransferases have been purified from rat liver although their genetic and biochemical properties were not fully characterized (44). In this study, the site for the transamination reaction of Cys-APAP was determined in kidney through in vitro assays. Since aminotransferases generally locate in cytosol and mitochondria (46), a possible explanation for the higher abundance of SAMP in wild-type than in Cyp2e1-null mice is that at both 200 mg/kg and 400 mg/kg APAP treatments, mitochondrial toxicity in wild-type mice, as indicated by elevated serum aminotransferases, led to the release of Cys-APAP aminotransferase from mitochondria to cytosol and thus increased the conversion of Cys-APAP to SAMP. This hypothesis was partially supported by the observation that Cys-APAP aminotransferase activity of S9 supernatant of kidney only counted for less than 50% of total activity of kidney homogenate (data not shown), indicating that mitochondria may possess more enzymatic activity than cytosol. Interestingly, it was recently reported that Cys-APAP can exacerbate APAP-induced renal injury (47). Whether the formation to SAMP contributes to the nephrotoxic effects of APAP and Cys-APAP remains to be investigated.
Metabolite VII (3-methoxyacetaminophen-4-O-glucuronide)
3-Methoxyacetaminophen has been identified as a minor urinary metabolite of APAP previously (48) though its correlation with toxicity has not been reported. The immediate precursor of 3-CH3O-APAP is 3-hydroxy-acetaminophen (3-OH-APAP), the catechol metabolite of APAP. It has been shown that the reaction mechanism of 3-OH-APAP formation is different from the mechanism of NAPQI (49), and CYP2E1 might not be the most efficient P450 for the generation of 3-OH-APAP in vivo (50). Although 3-OH-APAP was much less toxic than APAP, 3-CH3O-APAP was as toxic as APAP in vivo (48). Furthermore, in vitro assays also showed that quinone intermediates in 3-OH-APAP and 3-CH3O-APAP pathway, such as 3-methoxy-acetyl-p-benzoquinone and acetyl-m-aminophenol-o-benzoquinone, were as potent as NAPQI in causing toxicity in isolated hepatocytes (51). In this study, since the relative abundance of 3-CH3O-APAP-G in the 24-h urine of 200 mg/kg treatment and 1-h urine of 400 mg/kg treatment was similar between wild-type and Cyp2e1-null mice, it is possible that 3-CH3O-APAP-G was formed in both mouse lines in comparable rates and the differences after 2 h of 400 mg/kg treatment might be caused by the reduced elimination function in toxicity-afflicted wild-type mice.
Metabolite VIII (3,3′-biacetaminophen)
APAP dimer has not been previously identified as an in vivo metabolite even though the formation of APAP dimer and polymers has been demonstrated in vitro through the reactions catalyzed by horseradish peroxidase (19) or prostaglandin H synthase (52). Interestingly, during the first 24 h of 200 mg/kg treatment and first 1 h of 400 mg/kg treatment, the production of APAP dimer in Cyp2e1-null mice was significantly higher than that in wild-type mice. However, after 4 h of 400 mg/kg treatment, a higher abundance of APAP dimer appeared in the urine of wild-type mice, well correlating to the increased H2O2 level in liver. It is possible that there exist two independent pathways for the biogenesis of APAP dimer in vivo. One is more favorable at the early time points and in Cyp2e1-null mice while the other at the late time points and in wild-type mice. To elucidate the exact mechanism requires further study. One clear implication of the identification of APAP dimer in vivo is that since ROS species are required for the formation of APAP dimer, monitoring its urinary level might be able to provide the clue about the severity of APAP-induced oxidative stress.
Metabolite IX (a benzothiazine compound)
Although the exact structure of metabolite IX was not resolved in this study, both LC-MS/MS analysis and in vitro reaction between Cys-APAP and hydrogen peroxide supported a benzothiazine structure derived from p-aminophenol (the deacetylated APAP). Besides forming as an intermediate compound in the melanin biogenesis (27), benzothiazine compounds are also produced from the metabolism of bromobenzene through the reaction on 2-bromo-3-cysteinylhydroquinone (53). In addition to the structural similarity between hydroquinone (the intermediate metabolite of bromobenzene) and p-aminophenol (which can be metabolized to p-benzoquinone imine), both bromobenzene and p-aminophenol are nephrotoxicants. Since the level of bromobenzene-derived benzothiazine compound represents the formation of highly toxic hydroquinone compounds (53), it will be of interest to examine whether metabolite IX can reflect the formation of reactive intermediates in future studies. Furthermore, the relative abundances of metabolite IX in wild-type and Cyp2e1-null mice were consistent with serum aminotransferase activities, and the time-dependent increase of its presence in wild-type mice indicated a correlation with sustained oxidative stress. Therefore, metabolite IX has the potential to become a biomarker for monitoring the APAP-induced toxicity.
In summary, metabolite profiling of APAP-treated wild-type and Cyp2e1-null mice in this study indicated that in addition to the production of NAPQI, CYP2E1 might also contribute to APAP-induced toxicity through the oxidative stress generated by CYP2E1-mediated APAP metabolism. Combining high-resolution LC-MS, unsupervised PCA and mass isotopomer analysis, metabolomics achieved the classification of urine samples according to the toxic response and resulted in the identification and characterization of novel toxicity-associated APAP metabolites.
Supplementary Material
Acknowledgments
We thank Professor Bernhard Lauterburg of the University of Bern and Dr. Sidney Nelson of the University of Washington for providing APAP metabolite standards. This study was supported by the NCI Intramural Research Program of the NIH. J.R.I is grateful to US Smokeless Tobacco Company for a grant for collaborative research.
The abbreviations used are
- APAP
acetaminophen
- NAPQI
N-acetyl-p-benzoquinone imine
- Cys-APAP
3-cysteinyl-acetaminophen
- NAC-APAP
3-N-acetyl-cysteinyl-acetaminophen
- GS-APAP
3-glutathionyl-acetaminophen
- APAP-G
acetaminophen-O-glucuronide
- APAP-S
acetaminophen-O-sulfate
- SAMP
S-(5-acetylamino-2-hydroxyphenyl)mercaptopyruvic acid
- GSH
reduced glutathione
- GSSG
oxidized glutathione
- P450
cytochrome P450
- PCA
principal components analysis
- MS2
tandem mass spectrometry
- LC-MS
liquid chromatography-mass spectrometry
- UPLC
ultra-performance liquid chromatography
- TOFMS
time-of-flight mass spectrometry
- RT
retention time
References
- 1.Larson AM, Polson J, Fontana RJ, Davern TJ, Lalani E, Hynan LS, Reisch JS, Schiodt FV, Ostapowicz G, Shakil AO, Lee WM. Hepatology. 2005;42(6):1364–1372. doi: 10.1002/hep.20948. [DOI] [PubMed] [Google Scholar]
- 2.Boutis K, Shannon M. J Toxicol Clin Toxicol. 2001;39(5):441–445. doi: 10.1081/clt-100105413. [DOI] [PubMed] [Google Scholar]
- 3.Dahlin DC, Miwa GT, Lu AY, Nelson SD. Proc Natl Acad Sci U S A. 1984;81(5):1327–1331. doi: 10.1073/pnas.81.5.1327. [DOI] [PMC free article] [PubMed] [Google Scholar]
- 4.Cohen SD, Hoivik DJ, Khairallah EA. Acetaminophen-Induced Hepatotoxicity. In: Plaa GL, Hewitt WR, editors. Toxicology of the Liver. 2. Taylor & Francis; 1998. [Google Scholar]
- 5.Raucy JL, Lasker JM, Lieber CS, Black M. Arch Biochem Biophys. 1989;271(2):270–283. doi: 10.1016/0003-9861(89)90278-6. [DOI] [PubMed] [Google Scholar]
- 6.Patten CJ, Thomas PE, Guy RL, Lee M, Gonzalez FJ, Guengerich FP, Yang CS. Chem Res Toxicol. 1993;6(4):511–518. doi: 10.1021/tx00034a019. [DOI] [PubMed] [Google Scholar]
- 7.Lieber CS. Physiol Rev. 1997;77(2):517–544. doi: 10.1152/physrev.1997.77.2.517. [DOI] [PubMed] [Google Scholar]
- 8.Hart SG, Cartun RW, Wyand DS, Khairallah EA, Cohen SD. Fundam Appl Toxicol. 1995;24(2):260–274. doi: 10.1006/faat.1995.1029. [DOI] [PubMed] [Google Scholar]
- 9.Lee SS, Buters JT, Pineau T, Fernandez-Salguero P, Gonzalez FJ. J Biol Chem. 1996;271(20):12063–12067. doi: 10.1074/jbc.271.20.12063. [DOI] [PubMed] [Google Scholar]
- 10.Cheung C, Yu AM, Ward JM, Krausz KW, Akiyama TE, Feigenbaum L, Gonzalez FJ. Drug Metab Dispos. 2005;33(3):449–457. doi: 10.1124/dmd.104.002402. [DOI] [PubMed] [Google Scholar]
- 11.Nicholson JK, Wilson ID. Nat Rev Drug Discov. 2003;2(8):668–676. doi: 10.1038/nrd1157. [DOI] [PubMed] [Google Scholar]
- 12.Fernie AR, Trethewey RN, Krotzky AJ, Willmitzer L. Nat Rev Mol Cell Biol. 2004;5(9):763–769. doi: 10.1038/nrm1451. [DOI] [PubMed] [Google Scholar]
- 13.Chen C, Gonzalez FJ, Idle JR. Drug Metab Rev. 2007;39(2–3):581–597. doi: 10.1080/03602530701497804. [DOI] [PMC free article] [PubMed] [Google Scholar]
- 14.Nicholson JK, Connelly J, Lindon JC, Holmes E. Nat Rev Drug Discov. 2002;1(2):153–161. doi: 10.1038/nrd728. [DOI] [PubMed] [Google Scholar]
- 15.Coen M, Ruepp SU, Lindon JC, Nicholson JK, Pognan F, Lenz EM, Wilson ID. J Pharm Biomed Anal. 2004;35(1):93–105. doi: 10.1016/j.jpba.2003.12.019. [DOI] [PubMed] [Google Scholar]
- 16.Coen M, Lenz EM, Nicholson JK, Wilson ID, Pognan F, Lindon JC. Chem Res Toxicol. 2003;16(3):295–303. doi: 10.1021/tx0256127. [DOI] [PubMed] [Google Scholar]
- 17.Soga T, Baran R, Suematsu M, Ueno Y, Ikeda S, Sakurakawa T, Kakazu Y, Ishikawa T, Robert M, Nishioka T, Tomita M. J Biol Chem. 2006;281(24):16768–16776. doi: 10.1074/jbc.M601876200. [DOI] [PubMed] [Google Scholar]
- 18.Palumbo A, Astarita G, d’Ischia M. Biochem J. 2001;356(Pt 1):105–110. doi: 10.1042/0264-6021:3560105. [DOI] [PMC free article] [PubMed] [Google Scholar]
- 19.Potter DW, Miller DW, Hinson JA. J Biol Chem. 1985;260(22):12174–12180. [PubMed] [Google Scholar]
- 20.Amacher DE. Regul Toxicol Pharmacol. 1998;27(2):119–130. doi: 10.1006/rtph.1998.1201. [DOI] [PubMed] [Google Scholar]
- 21.Bales JR, Sadler PJ, Nicholson JK, Timbrell JA. Clin Chem. 1984;30(10):1631–1636. [PubMed] [Google Scholar]
- 22.Chen C, Meng L, Ma X, Krausz KW, Pommier Y, Idle JR, Gonzalez FJ. J Pharmacol Exp Ther. 2006;318(3):1330–1342. doi: 10.1124/jpet.106.105213. [DOI] [PMC free article] [PubMed] [Google Scholar]
- 23.Kaplowitz N, Aw TY, Ookhtens M. Annu Rev Pharmacol Toxicol. 1985;25:715–744. doi: 10.1146/annurev.pa.25.040185.003435. [DOI] [PubMed] [Google Scholar]
- 24.Hinson JA, Reid AB, McCullough SS, James LP. Drug Metab Rev. 2004;36(3–4):805–822. doi: 10.1081/dmr-200033494. [DOI] [PubMed] [Google Scholar]
- 25.Anandatheerthavarada HK, Addya S, Dwivedi RS, Biswas G, Mullick J, Avadhani NG. Arch Biochem Biophys. 1997;339(1):136–150. doi: 10.1006/abbi.1996.9855. [DOI] [PubMed] [Google Scholar]
- 26.Griffith OW, Meister A. Proc Natl Acad Sci U S A. 1985;82(14):4668–4672. doi: 10.1073/pnas.82.14.4668. [DOI] [PMC free article] [PubMed] [Google Scholar]
- 27.Prota G. Pigment Cell Res. 2000;13(4):283–293. doi: 10.1034/j.1600-0749.2000.130412.x. [DOI] [PubMed] [Google Scholar]
- 28.Snawder JE, Roe AL, Benson RW, Roberts DW. Biochem Biophys Res Commun. 1994;203(1):532–539. doi: 10.1006/bbrc.1994.2215. [DOI] [PubMed] [Google Scholar]
- 29.Zaher H, Buters JT, Ward JM, Bruno MK, Lucas AM, Stern ST, Cohen SD, Gonzalez FJ. Toxicol Appl Pharmacol. 1998;152(1):193–199. doi: 10.1006/taap.1998.8501. [DOI] [PubMed] [Google Scholar]
- 30.Wolf KK, Wood SG, Allard JL, Hunt JA, Gorman N, Walton-Strong BW, Szakacs JG, Duan SX, Hao Q, Court MH, von Moltke LL, Greenblatt DJ, Kostrubsky V, Jeffery EH, Wrighton SA, Gonzalez FJ, Sinclair PR, Sinclair JF. Drug Metab Dispos. 2007;35(7):1223–1231. doi: 10.1124/dmd.107.014738. [DOI] [PubMed] [Google Scholar]
- 31.Sinclair J, Jeffery E, Wrighton S, Kostrubsky V, Szakacs J, Wood S, Sinclair P. Biochem Pharmacol. 1998;55(10):1557–1565. doi: 10.1016/s0006-2952(97)00656-4. [DOI] [PubMed] [Google Scholar]
- 32.Guo GL, Moffit JS, Nicol CJ, Ward JM, Aleksunes LA, Slitt AL, Kliewer SA, Manautou JE, Gonzalez FJ. Toxicol Sci. 2004;82(2):374–380. doi: 10.1093/toxsci/kfh286. [DOI] [PubMed] [Google Scholar]
- 33.Potter WZ, Thorgeirsson SS, Jollow DJ, Mitchell JR. Pharmacology. 1974;12(3):129–143. doi: 10.1159/000136531. [DOI] [PubMed] [Google Scholar]
- 34.Knight TR, Ho YS, Farhood A, Jaeschke H. J Pharmacol Exp Ther. 2002;303(2):468–475. doi: 10.1124/jpet.102.038968. [DOI] [PubMed] [Google Scholar]
- 35.Reid AB, Kurten RC, McCullough SS, Brock RW, Hinson JA. J Pharmacol Exp Ther. 2005;312(2):509–516. doi: 10.1124/jpet.104.075945. [DOI] [PubMed] [Google Scholar]
- 36.Ferret PJ, Hammoud R, Tulliez M, Tran A, Trebeden H, Jaffray P, Malassagne B, Calmus Y, Weill B, Batteux F. Hepatology. 2001;33(5):1173–1180. doi: 10.1053/jhep.2001.24267. [DOI] [PubMed] [Google Scholar]
- 37.Smilkstein MJ, Knapp GL, Kulig KW, Rumack BH. N Engl J Med. 1988;319(24):1557–1562. doi: 10.1056/NEJM198812153192401. [DOI] [PubMed] [Google Scholar]
- 38.Koop DR. Faseb J. 1992;6(2):724–730. doi: 10.1096/fasebj.6.2.1537462. [DOI] [PubMed] [Google Scholar]
- 39.Gorsky LD, Koop DR, Coon MJ. J Biol Chem. 1984;259(11):6812–6817. [PubMed] [Google Scholar]
- 40.Ekstrom G, Ingelman-Sundberg M. Biochem Pharmacol. 1989;38(8):1313–1319. doi: 10.1016/0006-2952(89)90338-9. [DOI] [PubMed] [Google Scholar]
- 41.Shertzer HG, Clay CD, Genter MB, Schneider SN, Nebert DW, Dalton TP. Free Radic Biol Med. 2004;36(5):605–617. doi: 10.1016/j.freeradbiomed.2003.11.013. [DOI] [PubMed] [Google Scholar]
- 42.Giri S, Idle JR, Chen C, Zabriskie TM, Krausz KW, Gonzalez FJ. Chem Res Toxicol. 2006;19(6):818–827. doi: 10.1021/tx0600402. [DOI] [PMC free article] [PubMed] [Google Scholar]
- 43.Chen C, Ma X, Malfatti MA, Krausz KW, Kimura S, Felton JS, Idle JR, Gonzalez FJ. Chem Res Toxicol. 2007;20(3):531–542. doi: 10.1021/tx600320w. [DOI] [PMC free article] [PubMed] [Google Scholar]
- 44.Tomisawa H, Ichimoto N, Takanohashi Y, Ichihara S, Fukazawa H, Tateishi M. Xenobiotica. 1988;18(9):1015–1028. doi: 10.3109/00498258809042224. [DOI] [PubMed] [Google Scholar]
- 45.Eklind KI, Morse MA, Chung FL. Carcinogenesis. 1990;11(11):2033–2036. doi: 10.1093/carcin/11.11.2033. [DOI] [PubMed] [Google Scholar]
- 46.Christen P, Jaussi R, Juretic N, Mehta PK, Hale TI, Ziak M. Ann N Y Acad Sci. 1990;585:331–338. doi: 10.1111/j.1749-6632.1990.tb28065.x. [DOI] [PubMed] [Google Scholar]
- 47.Stern ST, Bruno MK, Hennig GE, Horton RA, Roberts JC, Cohen SD. Toxicol Appl Pharmacol. 2005;202(2):151–159. doi: 10.1016/j.taap.2004.06.030. [DOI] [PubMed] [Google Scholar]
- 48.Forte AJ, Wilson JM, Slattery JT, Nelson SD. Drug Metab Dispos. 1984;12(4):484–491. [PubMed] [Google Scholar]
- 49.Harvison PJ, Guengerich FP, Rashed MS, Nelson SD. Chem Res Toxicol. 1988;1(1):47–52. doi: 10.1021/tx00001a009. [DOI] [PubMed] [Google Scholar]
- 50.Chen W, Koenigs LL, Thompson SJ, Peter RM, Rettie AE, Trager WF, Nelson SD. Chem Res Toxicol. 1998;11(4):295–301. doi: 10.1021/tx9701687. [DOI] [PubMed] [Google Scholar]
- 51.Holme JA, Hongslo JK, Bjorge C, Nelson SD. Biochem Pharmacol. 1991;42(5):1137–1142. doi: 10.1016/0006-2952(91)90299-k. [DOI] [PubMed] [Google Scholar]
- 52.Potter DW, Hinson JA. J Biol Chem. 1987;262(3):974–980. [PubMed] [Google Scholar]
- 53.Monks TJ, Highet RJ, Lau SS. Mol Pharmacol. 1990;38(1):121–127. [PubMed] [Google Scholar]
Associated Data
This section collects any data citations, data availability statements, or supplementary materials included in this article.