

Abstract
Background
Even in the post-genomic era, the identification of candidate genes within loci associated with human genetic diseases is a very demanding task, because the critical region may typically contain hundreds of positional candidates. Since genes implicated in similar phenotypes tend to share very similar expression profiles, high throughput gene expression data may represent a very important resource to identify the best candidates for sequencing. However, so far, gene coexpression has not been used very successfully to prioritize positional candidates.
Methodology/Principal Findings
We show that it is possible to reliably identify disease-relevant relationships among genes from massive microarray datasets by concentrating only on genes sharing similar expression profiles in both human and mouse. Moreover, we show systematically that the integration of human-mouse conserved coexpression with a phenotype similarity map allows the efficient identification of disease genes in large genomic regions. Finally, using this approach on 850 OMIM loci characterized by an unknown molecular basis, we propose high-probability candidates for 81 genetic diseases.
Conclusion
Our results demonstrate that conserved coexpression, even at the human-mouse phylogenetic distance, represents a very strong criterion to predict disease-relevant relationships among human genes.
Author Summary
One of the most limiting aspects of biological research in the post-genomic era is the capability to integrate massive datasets on gene structure and function for producing useful biological knowledge. In this report we have applied an integrative approach to address the problem of identifying likely candidate genes within loci associated with human genetic diseases. Despite the recent progress in sequencing technologies, approaching this problem from an experimental perspective still represents a very demanding task, because the critical region may typically contain hundreds of positional candidates. We found that by concentrating only on genes sharing similar expression profiles in both human and mouse, massive microarray datasets can be used to reliably identify disease-relevant relationships among genes. Moreover, we found that integrating the coexpression criterion with systematic phenome analysis allows efficient identification of disease genes in large genomic regions. Using this approach on 850 OMIM loci characterized by unknown molecular basis, we propose high-probability candidates for 81 genetic diseases.
Introduction
In the last two decades, positional cloning has been remarkably successful in the identification of genes involved in human disorders. More recently, our ability to map genetic disease loci has strikingly increased due to the availability of the entire genome sequence. Nevertheless, once a disease locus has been mapped, the identification of the mutation responsible for the phenotype still represents a very demanding task, because the mapped region may typically contain hundreds of candidates [1]. Accordingly, many phenotypes mapped on the genome by linkage analysis are not yet associated to any validated disease gene (850 OMIM entries for phenotypes with unknown molecular basis had at least one associated disease locus on July 2nd, 2007). Therefore, the definition of strategies that can pinpoint the most likely targets to be sequenced in patients is of critical importance [1]. Many different strategies have been proposed to prioritize genes located in critical map intervals. Some of the methods so far developed rely on the observation that disease genes tend to share common global properties, which can be deduced directly by absolute and comparative sequence analysis [2]. However, most of the available prioritization strategies are based on the widely accepted idea that genes and proteins of living organisms deploy their functions as part of sophisticated functional modules, based on a complex series of physical, metabolic and regulatory interactions [3],[4]. Although this principle has been extensively used even in the pre-genome era to identify the critical players of many different biological phenomena, the present availability of genome-scale information on gene function, protein-protein interactions and gene expression in different experimental models allows unprecedented opportunities for approaching the prioritization problem with greater efficiency.
In theory, the use of functional gene annotations would represent the most straightforward approach for candidate prioritization. However, although this strategy may be very useful in selected cases [5],[6], at the present stage it has clear limitations, either because it overlooks non-annotated genes [6],[7] or because it is not evident how the annotated functions of the candidates relate to the disease phenotype. Therefore, computational methods less biased toward already consolidated knowledge, may have strong advantages [1].
In particular, protein-protein interaction maps and gene coexpression data from microarray experiments represent extremely rich sources of potentially relevant information.
Recently, the direct integration of a very heterogeneous human interactome with a text mining-based map of phenotype similarity has allowed the prediction of high confidence candidates within large disease-associated loci [8].
Although this approach is highly efficient, it is clearly not exhaustive because very close functional relationships between genes and proteins are possible in the absence of direct molecular binding. In addition, the protein-protein interaction space is currently under-sampled and many genuine biological interactions have not yet been identified in experiments. Conversely, high-throughput experiments are known to result in a large fraction of false positives. The consistently low overlap of protein-protein interactions between large-scale experiments, even when the same proteins are considered, is testament to these problems [9]. Finally, many of the known protein-protein interactions have been ascertained through low-throughput experiments and are thus strongly biased towards better-studied proteins [10].
Since genes involved in the same functions tend to show very similar expression profiles, coexpression analysis could be a very powerful approach for inferring functional relationships, which may correlate with similar disease phenotypes. Accordingly, global analyses have shown that genes highly coexpressed across microarray experiments display very similar functional annotation [11]. However, with notable exceptions [12], so far the coexpression criterion has not been employed very successfully for the prediction of genetic disease candidates and has been used to this purpose only in combination with other independent evidence [5],[13].
The noisy nature of high-throughput gene expression datasets may represent one of the possible explanations for this shortcoming. Moreover, even when the coexpression of two genes is reproducibly observed under a high number of experimental conditions, this does not necessarily imply that the genes are functionally related. For instance, extensive meta analysis of microarray data across different species has revealed that neighboring genes are more likely to be coexpressed than genes encoded in distant genomic regions, even if they are not functionally related in any obvious manner [14],[15].
Phylogenetic conservation has been previously proposed as a very strong criterion to identify functionally relevant coexpression links among genes [16],[17]. Indeed, significant coexpression of two or more orthologous genes is very likely due to selective advantage, strongly suggesting a functional relation. Therefore, conserved coexpression could be a much stronger criterion than single species coexpression to relate genes involved in similar disease phenotypes.
In this report we show that conserved coexpression and phenome analysis can be effectively integrated to produce accurate predictions of human disease genes. Using this approach we were able to select a small number of strong candidates for 81 human diseases, corresponding to a wide spectrum of different phenotypes.
Materials and Methods
Figure 1 schematically illustrates our approach.
Figure 1. Identification of candidate disease genes by means of conserved co-expression clusters.

A locus with positional candidates (green bar) associated with a disease of unknown molecular basis (yellow) is screened for one or more candidate genes (green sphere) that appear in a conserved coexpression cluster (purple spheres) together with at least two other genes known to be involved in similar phenotypes (yellow spheres), as defined by the MimMiner similarity score.
Generation of Conserved Coexpression Networks
We have generated two human-mouse conserved coexpression networks (CCN), based on cDNA and oligonucleotide microarray platforms, respectively.
In the first case, the starting data were log-transformed values of human and mouse ratiometric experiments, downloaded from the Stanford Microarray Database (SMD) [18] (4129 experiments for 102296 EST probes for human and 467 experiments for 80595 EST probes for mouse). The resulting network will be referred to as ‘Stanford’ in the following (Text S1).
In the second case (‘Affy’, Text S2), the network was based on previously described series of normal tissue Affymetrix microarray experiments from human [19] (353 experiments corresponding to 65 different tissues for 46241 probe-sets associated to a known gene) and mouse [20] (122 experiments corresponding to 61 tissues for 19692 probe-sets). In the human case, the Affymetrix experiments corresponding to the same tissue were averaged to compensate for the different number of replicates available for the various tissues.
In both cases, we used the same procedure to generate a final CCN. In particular, we first generated single species gene coexpression networks (SCN) and then integrated them on the basis of human-mouse orthology, as detailed below.
SCNs were generated by first calculating the Pearson correlation coefficients of every row in the expression matrix (cDNA probe or Affymetrix probe-set) with all other rows. A directed edge was established from row r1 to row r2 if r2 fell within the top 1% rows in terms of correlation with r1. The threshold was first chosen on the basis of a previous study, showing that such 1% interval is most significantly enriched in terms of functionally relevant coexpression [16]. Moreover, we confirmed that using a more stringent 0.5% threshold results in strongly reduced sensitivity (data not shown).
These directed networks where then converted into undirected SCNs by mapping the rows to the corresponding Entrez Gene identifiers [21]: an edge is established between two Entrez gene IDs G1 and G2 if there is at least one edge from a row assigned to G1 to a row assigned to G2 and vice versa. The correspondence between probe-sets and Entrez gene IDs for the SMD data was established using Unigene (build 190 and 152 for human and mouse, respectively). For Affymetrix data we used the annotation files provided by Affymetrix for each platform.
Finally, CCNs were built from SCNs by mapping every Entrez Gene identifier to the corresponding Homologene cluster (build 55) and retaining only the cases in which a one-to-one correspondence could be established between the human and mouse Entrez gene IDs appearing in the SCNs.
Phenotype Correlation
Genetic disease phenotypes described in OMIM where correlated on the basis of MimMiner [22]. MimMiner assigns a similarity score to all pairs of OMIM phenotype records, based on the text mining analysis of their phenotype descriptions [22]. Two phenotypes were defined to be similar if their score was at least 0.4, because biologically meaningful relationships were mostly detected in phenotype pairs with a similarity score equal or greater than this value [22]. About 1% of all possible pairs of phenotypes included in MimMiner pass this threshold.
Global Properties of the CCNs
The analysis of the CCNs was based on the construction of coexpression clusters, defined as a given gene (the center of the cluster) plus its nearest neighbors in the conserved coexpression network, thus obtaining one cluster for each gene. The prevalence of genes joining functionally related genes in the CCNs was tested by analyzing the prevalence of Gene Ontology terms within coexpression clusters, compared to the same prevalence in randomized coexpression clusters. We counted the number of coexpression clusters for which at least one Gene Ontology term was significantly overrepresented (P-value less than 10−4 with exact Fisher test), and compared this number with the same number averaged over 100 randomized CCNs. This was done separately for the Affy and Stanford networks, and the results are shown in Figure 2A.
Figure 2. Comparison of the Affy and Stanford networks with functional, physical interaction, and disease-related information.

(A) Prevalence of functionally related coexpression clusters (see Materials and Methods). (B) Number of edges of the CCN joining proteins previously shown to physically interact by different techniques, as deduced by the HPRD database. (C) Number of edges of the indicated networks connecting genes involved in Mendelian phenotypes sharing a MimMiner score of 0.4 or higher. In each case, the results for the actual CCNs are compared to the results averaged on 100 randomized CCNs, with error bars representing the standard deviation of the latter.
The overlap between CCNs and protein interaction networks was evaluated by downloading the list of known interactions between human proteins from HPRD [23],[24]. To take into account the different experimental methods on which the HPRD interactions are based and their varying degree of reliability, we analyzed separately in-vivo, in vitro and yeast double hybrid interactions. In each case, separately for the Affy and Stanford networks, we compared the overlap between the CCNs and the protein interaction network to the same overlap averaged over 100 randomized CCNs. The results are shown in Figure 2B.
Finally to verify whether the CCNs were enriched in edges joining genes causing similar phenotypes, we constructed a network of human genes in which an edge was placed between every pair of genes known to be involved in the same disease or in diseases with MimMiner similarity score at least equal to 0.4. The mapping between OMIM phenotypes and genes known to cause them was obtained from Ensembl, version 45 [25]. We then evaluated the overlap between this network and the CCNs, again compared to the same overlap averaged over 100 randomized CCNs (Figure 2C).
Identification of Candidate Genes in Disease Loci
The lists of genes contained in OMIM loci of unknown molecular basis were obtained from Ensembl, version 45 [25]. To identify likely candidates for a given disease-associated genomic locus, we first extracted from the networks disease-relevant conserved coexpression clusters. A cluster was considered relevant to a given disease d if it contained at least two genes experimentally known to cause phenotypes similar to d. These clusters will be called ‘disease clusters’ in the following. The genes of the disease clusters, which are also contained in the map interval of the locus associated to d, were retained for scoring as described below.
Scoring and Estimation of the False Discovery Rate
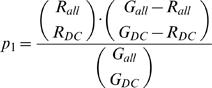
The size of the coexpression clusters and of the loci are very heterogeneous: coexpression clusters contain between 2 and 186 genes while loci associated to OMIM diseases with unknown molecular basis vary between 3 and 2153 genes. Therefore the genes selected in the previous step were assigned a probabilistic score based on the null hypothesis in which the coexpression clusters are random sets of genes. The score is essentially the probability that the two events leading to the identification of a candidate gene for a disease occur by chance. The two events are (1) the presence in a coexpression cluster of at least 2 genes known to be involved in phenotypes similar to the disease in question and (2) the presence in the same coexpression cluster of a gene located within the locus relevant to the disease. First, we computed a P-value p1 for associating a cluster to the given disease by chance. This P-value is given by the cumulative hypergeometric distribution considering: the number RDC of genes linked to similar phenotypes that have been found in the cluster (at least 2 to associate the cluster with the disease); the number Rall of genes in the network that are linked to similar phenotypes; the number GDC of genes in the cluster; and the total number of genes Gall in the network:
 |
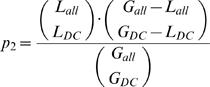
Second, we computed the P-value p2 of the overlap between the disease cluster and the genetic locus associated to the disease. This P-value is given by the cumulative hypergeometric distribution considering: the number LDC of genes in the locus that are also present in the given disease cluster; the number Lall of genes in the locus that are present in the network; and GDC and Gall are defined as above:
 |
In the null hypothesis, associating a cluster with a disease and finding a gene in the cluster that belongs to the appropriate orphan locus are independent events. Thus, the total score for a predicted candidate is given by the product p1 • p2. When a candidate is found in more than one disease cluster, we consider only the lowest (best) score.
The cutoff on such scores was determined by estimating the false discovery rate (FDR) for each possible cutoff using 100 randomized CCNs per dataset: The false discovery rate is defined as the ratio between the average number of predictions made using randomized CCNs and the number of predictions made using the real CCN, with the same cutoff. The cutoffs thus obtained for a 10% FDR were 4.49·10−6 for the Affy and 2.67·10−6 for the Stanford network, respectively.
Precision and Leave-One-Out Procedure
To estimate the precision of our procedure we used a leave-one-out strategy: For every gene experimentally associated to an OMIM phenotype we constructed artificial loci centered on the disease gene, and removed all associations between this particular phenotype and all the genes known to cause it, so as to simulate a phenotype with unknown molecular basis. The association between phenotypes similar to the one under examination and the corresponding genes was instead retained.
In order to take into account the variability of locus sizes we constructed artificial loci of various sizes, by taking the disease gene plus the N closest genes on each side of the chromosome (according to their start position on the chromosome). The artificial loci thus contained up to 2N+1 genes, but could contain fewer genes when the disease gene was close to one of the chromosome ends. In the following discussion, such artificial loci will be denoted as N20, N50, … N500 for locus sizes up to 41, 101 … 1001 genes, respectively. This range of locus sizes was chosen based on the observed size distribution of orphan loci: OMIM loci for diseases with unknown molecular basis contain an average number of about 273 genes (median: 180 genes).
We considered the disease gene as correctly identified if it was selected as a candidate by our method with the same score threshold that we used for the orphan loci. The precision is defined as the ratio between the number of cases with correctly identified disease genes and the number of cases with at least one selected candidate, that is, the fraction of cases with selected candidates in which the disease gene was among the candidate list.
Results
Generation and Global Properties of Two Different Human-Mouse Conserved Coexpression Networks
Conserved coexpression has been previously reported to be an efficient criterion to identify functionally related genes [16],[17]. Therefore, to discover new relationships between human genes with a high potential relevance for disease phenotypes, we produced the two human-mouse gene coexpression networks described above, covering different platforms and experimental conditions. In particular, the Stanford network (supporting file S1) was generated from data based on cDNA platforms, corresponding mostly to experiments performed on tumor cell lines. In contrast, the Affy network (Text S2) was derived from normal tissue data, generated on Affymetrix platforms in two independent studies [19],[20]. The Stanford network has 8512 nodes (genes) and 56397 edges, with an average connectivity of 13.2 edges per node. The Affy network is composed of 12766 nodes and 155403 edges, with an average connectivity of 24.3 edges per node. Both networks contain a large connected component of 2305 and 4122 genes, respectively, with some other small connected components containing only a few nodes.
As expected from previous studies on gene coexpression networks [26], the two networks are topologically similar to other biological networks, characterized by the existence of a few highly connected nodes (hubs), but they show a connectivity distribution more similar to an exponential law than to a scale-free one (data not shown). More importantly, if compared with 100 random permutations, both networks show a strong prevalence of edges between genes that are annotated to the same Gene Ontology (GO) keyword (Figure 2A). This confirms that human-mouse conserved coexpression is a valuable criterion to identify functionally related genes. Accordingly, both networks show a highly significant overlap with protein-protein interactions reported in the Human Protein Reference Database (HPRD) [23],[24] (Figure 2B).
Since many genes, such as those involved in basic cellular functions, should be coexpressed regardless of the particular experimental situation, we would expect the two networks to have many common links. Indeed, they share 2305 edges, between the 7332 common nodes, which represents a striking overlap (the randomized Affy networks had on average 88.4 edges in common with the Stanford network, with a standard deviation of 8.7). On the other hand, the large number of specific links that characterize the two networks indicates that they provide highly complementary information.
Finally, to evaluate the capability of conserved coexpression to link genes involved in similar disease phenotypes, we measured in both networks the prevalence of links between genes associated to phenotypes with similar descriptions [22]. Interestingly, both networks showed a strong enrichment, if compared with the average number obtained from the randomized networks (Figure 2C). We concluded that the two networks represent complementary resources that could efficiently predict disease-relevant relationships among human genes.
Integration of Coexpression and Phenotypic Information to Identify Likely Candidate Genes in Disease Loci
The high prevalence of links between genes involved in similar disease phenotypes, observed in both networks, suggests that they could provide valuable information to identify likely candidates in mapped disease loci. Therefore, we devised an algorithm that integrates our CCNs with phenotype and mapping information to predict candidate disease genes in large genomic regions (Figure 1). As detailed in Materials and Methods, the procedure is based on the extraction from the network of the disease clusters, which we consider to be associated to a given disease since they contain at least two genes involved in similar phenotypes. The genes that are present in both the OMIM phenotype loci and the corresponding disease clusters are considered as candidates and assigned a score based on the size of the locus and of the disease cluster. Randomized runs allowed us to select a score threshold corresponding to a 10% FDR.
To evaluate how our procedure could perform on the loci characterized by unknown molecular basis, we applied a leave-one-out strategy to all the Ensembl genes associated to at least one OMIM disease ID, by constructing artificial loci of variable size around each gene. We then measured the fraction of artificial loci for which we obtained at least one candidate (Figure 3A), the average number of candidates found for these loci (Figure 3B) and the precision (Figure 3C), defined as explained in Materials and Methods. Of the 1762 disease genes contained in OMIM, we could analyze 1426, whose associated phenotypes are present in the MimMiner similarity matrix.
Figure 3. Performance of the identification of candidate disease genes as determined by a leave-one-out strategy.

Artificial loci of different sizes were constructed around known disease genes as explained in the text. (A) Fraction of the artificial loci for which it was possible to identify at least one candidate gene, as a function of the locus size. (B) Average number of candidates in the loci for which at least one candidate was identified, as a function of the locus size. (C) Precision as a function of the locus size. Precision is determined as the ratio between the number of loci whose candidate list contained the starting disease gene and the number of loci with candidates. Filled triangles indicate the results obtained with the Affy network, while empty boxes refer to the Stanford network.
The precision obtained obviously decreases when the size of the artificial loci is increased. However, it is interesting to notice that, while for the smallest artificial loci the precision was excellent (about 68% for both networks), even with the largest artificial loci it was still remarkable (37.5% for the Affy and 29.1% for the Stanford networks, respectively). For N90 (artificial loci with a maximum of 181 genes, very close to the median size of 180 genes for OMIM phenotype loci with unknown molecular basis), for example, the leave-one-out validation yielded at least one candidate for 47.8% (Affy) and 12.7% (Stanford) of the disease loci (Figure 3A). In these cases, an average of 3.67 (Affy) and 2.17 (Stanford) candidates were returned (Figure 3B), that contained the true disease gene in 49.3% (Affy) and 43.6% (Stanford) of the cases (Figure 3C). That is, for both networks, when candidates were returned, the very short candidate lists contained the disease-causing gene with a probability of over 40%.
We next determined how our method performs compared to other existing approaches. This comparison was based on the enrichment in correctly identified disease genes (by leave-one-out) with respect to randomized networks. In our case the fold enrichment is defined as the ratio between number of disease genes correctly recalled in the leave-one out procedure and the same number averaged on 100 randomized CCNs. For this evaluation we used the N90 artificial loci (see Materials and Methods), which are closest in size to the actual orphan loci (median size 180). Fold enrichment values were computed for several published methods by Lage et al [8] (see their Supplementary material). It must be noticed that the exact definition of the fold enrichment depends on the method under consideration, thus comparison must be taken with caution. However, Table 1 shows that our methods compares favorably with many previously published ones: when considering that, as discussed above, the use of gene expression data allows a less biased analysis compared to most other methods, we conclude that our approach provides a significant and original contribution to the identification of disease genes.
Table 1. Fold enrichment of different methods for candidate gene prioritization.
| Method | Data Source | Fold Enrichment |
| Lage et al. [8] | PPI | 23.1a |
| Perez-Iratxeta et al. [35] | FA | 19.4a |
| Conserved coexpression (Affy network) | GE | 14.4 |
| Freudenberg and Propping [36] | FA | 13.3a |
| Conserved coexpression (Stanford network) | GE | 10.0 |
| Oti et al. [10] | PPI | 10.0a |
| Adie et al. [37] | SBF | 5.6a |
| Turner et al. [6] | FA | 5.2a |
| Franke et al. [5] | FA, GE, PPI | 3.6a |
PPI, protein-protein interaction; FA, functional annotation; GE, gene expression; SBF, sequence-based features (e.g., sequence length).
Values taken from the supplementary material of Lage et al. [8].
Prediction of Candidates for Orphan Disease Loci
The above results indicate that conserved coexpression can be efficiently combined with phenotype correlation data to provide high confidence candidates within genetic disease loci. Therefore, we applied our procedure to 850 OMIM phenotype entries with at least one mapped disease locus but unknown molecular basis. In Table 2 we provide the list of all the 321 candidates (gene-locus pairs) obtained with 10% FDR. We obtained predictions for 81 loci, 67 of which where only from the Affy network, 5 only from the Stanford and 9 from both. Interestingly, in 4 of the latter cases, the list of candidates from the two networks contained at least one common gene (Table 2).
Table 2. List of the candidate genes found for 81 OMIM loci with unknown molecular basis.
| OMIM ID | Disease and Locus | Locus Size | HUGO | Ensembl ID | Status | Net. | Disease Cluster Size | P-Value |
| 119540 | Cleft palate, isolated; 2q32 | 75 | COL3A1 | ENSG00000168542 | 1*(i) | S | 22 | 1.16E-06 |
| COL5A2 | ENSG00000204262 | 1*(i) | S | 22 | 1.16E-06 | |||
| 121210 | Febrile convulsions, familial, 1; 8q13-q21 | 188 | C8orf46 | ENSG00000169085 | 1 | A | 143 | 4.12E-10 |
| EFCBP1 | ENSG00000123119 | 1 | A | 143 | 4.12E-10 | |||
| RALYL | ENSG00000184672 | 1 | A | 143 | 4.12E-10 | |||
| STMN2 | ENSG00000104435 | 1 | A | 143 | 4.12E-10 | |||
| GDAP1 | ENSG00000104381 | 1 | A | 139 | 1.79E-09 | |||
| C8orf34 | ENSG00000165084 | 1 | A | 110 | 2.95E-08 | |||
| STAU2 | ENSG00000040341 | 1 | A | 173 | 3.08E-08 | |||
| 130080 | Ehlers-Danlos syndrome, type VIII; 12p13 | 277 | A2M | ENSG00000175899 | 1 | S | 50 | 4.79E-11 |
| VWF | ENSG00000110799 | 1 | A | 99 | 9.97E-10 | |||
| C1S | ENSG00000182326 | 1 | S | 87 | 1.25E-09 | |||
| MFAP5 | ENSG00000197614 | 1 | A | 111 | 1.90E-09 | |||
| EMP1 | ENSG00000134531 | 1 | A | 72 | 2.37E-09 | |||
| CD163 | ENSG00000177575 | 1 | A | 44 | 3.34E-09 | |||
| TNFRSF1A | ENSG00000067182 | 1 | A | 61 | 4.34E-09 | |||
| TSPAN9 | ENSG00000011105 | 1 | S | 112 | 5.28E-09 | |||
| CSDA | ENSG00000060138 | 1 | A | 55 | 9.95E-09 | |||
| LTBR | ENSG00000111321 | 1 | A | 73 | 1.70E-06 | |||
| CD9 | ENSG00000010278 | 1 | S;A | 49 | 2.34E-06 | |||
| 142700 | Acetabular dysplasia; 13q22 | 36 | KLF5 | ENSG00000102554 | 1 | A | 54 | 1.18E-06 |
| 145410 | Hypertelorism with esophageal abnormality and hypospadias; 22q11.2 | 271 | KLHL22 | ENSG00000185214 | 1 | A | 15 | 1.84E-07 |
| MAPK1 | ENSG00000100030 | 1 | A | 15 | 1.84E-07 | |||
| MICAL3 | ENSG00000099972 | 1 | A | 15 | 1.84E-07 | |||
| 154275 | Malignant hyperthermia, susceptibility to, 2; 17q11.2-q24 | 881 | CACNB1 | ENSG00000067191 | 3$(ii) | A | 37 | 1.06E-06 |
| CACNG1 | ENSG00000108878 | 3$(ii) | A | 37 | 1.06E-06 | |||
| SCN4A | ENSG00000007314 | 1 | A | 37 | 1.06E-06 | |||
| 156232 | Mesomelic dysplasia, Kantaputra type; 2q24-q32 | 296 | HOXD10 | ENSG00000128710 | 2 | A | 13 | 1.80E-07 |
| HOXD8 | ENSG00000175879 | 1 | A | 13 | 1.80E-07 | |||
| GRB14 | ENSG00000115290 | 1 | A | 63 | 3.14E-07 | |||
| HOXD11 | ENSG00000128713 | 1 | A | 63 | 3.14E-07 | |||
| HOXD3 | ENSG00000128652 | 1 | A | 63 | 3.14E-07 | |||
| 156600 | Microcoria, congenital; 13q31-q32 | 99 | DCT | ENSG00000080166 | 1 | A | 18 | 4.06E-08 |
| SLITRK6 | ENSG00000184564 | 1 | A | 18 | 4.06E-08 | |||
| 162820 | Neutrophil chemotactic response; 7q22-qter | 712 | EPHB6 | ENSG00000106123 | 1 | A | 46 | 6.04E-07 |
| EPHA1 | ENSG00000146904 | 1 | A | 54 | 1.08E-06 | |||
| 163000 | Nevi flammei, familial multiple; 5q13-q22 | 327 | AGGF1 | ENSG00000164252 | 2*(iii) | A | 77 | 3.72E-08 |
| RASA1 | ENSG00000145715 | 2#(iii) | A | 77 | 3.72E-08 | |||
| 164210 | Hemifacial microsomia; 14q32 | 414 | BTBD7 | ENSG00000011114 | 1 | S | 109 | 2.15E-07 |
| DICER1 | ENSG00000100697 | 1 | S | 109 | 2.15E-07 | |||
| EIF5 | ENSG00000100664 | 1 | S | 109 | 2.15E-07 | |||
| JAG2 | ENSG00000184916 | 1 | S | 109 | 2.15E-07 | |||
| PAPOLA | ENSG00000090060 | 1 | S | 109 | 2.15E-07 | |||
| PPP2R5C | ENSG00000078304 | 1 | S | 109 | 2.15E-07 | |||
| VRK1 | ENSG00000100749 | 1 | S | 109 | 2.15E-07 | |||
| 177720 | Pseudohyperkalemia, familial, 1, due to red cell leak; 16q23-q24 | 170 | CA5A | ENSG00000174990 | 1 | A | 11 | 1.56E-07 |
| 180020 | Retinal cone dystrophy 1; 6q25-q26 | 133 | PLEKHG1 | ENSG00000120278 | 1 | A | 18 | 1.10E-09 |
| SYTL3 | ENSG00000164674 | 1 | A | 18 | 1.10E-09 | |||
| 181430 | Scapuloperoneal myopathy; 12q15-q23.1 | 215 | MYF6 | ENSG00000111046 | 3 | A | 104 | 8.24E-09 |
| PHLDA1 | ENSG00000139289 | 1 | A | 134 | 3.50E-08 | |||
| LUM | ENSG00000139329 | 1 | A | 90 | 3.66E-07 | |||
| 183600 | Split-hand/foot malformation 1; 2q31 | 126 | HOXD10 | ENSG00000128710 | 1 | A | 27 | 8.16E-10 |
| HOXD11 | ENSG00000128713 | 1 | A | 27 | 8.16E-10 | |||
| HOXD3 | ENSG00000128652 | 1 | A | 27 | 8.16E-10 | |||
| HOXD8 | ENSG00000175879 | 1 | A | 27 | 8.16E-10 | |||
| HOXD9 | ENSG00000128709 | 1 | A | 27 | 8.16E-10 | |||
| HOXD13 | ENSG00000128714 | 2 | A | 28 | 2.67E-07 | |||
| 185000 | Stomatocytosis I; 9q34.1 | 135 | LCN2 | ENSG00000148346 | 1 | A | 35 | 3.34E-07 |
| 203650 | Alopecia-mental retardation syndrome 1; 3q26.3-q27.3 | 150 | ABCC5 | ENSG00000114770 | 1 | S | 23 | 6.51E-06 |
| LIPH | ENSG00000163898 | 2 | S | 23 | 6.51E-06 | |||
| 213200 | Spinocerebellar ataxia, autosomal recessive 2; 9q34-qter | 290 | CACNA1B | ENSG00000148408 | 1 | A | 31 | 2.00E-06 |
| GRIN1 | ENSG00000176884 | 1 | A | 50 | 3.38E-06 | |||
| 213600 | Basal ganglia calcification, idiopathic, 1; 14q | 1215 | GPHN | ENSG00000171723 | 1 | A | 61 | 2.11E-06 |
| 214900 | Cholestasis-lymphedema syndrome; 15q | 1074 | CYP1A2 | ENSG00000140505 | 1 | A | 73 | 2.66E-06 |
| LIPC | ENSG00000166035 | 1 | A | 73 | 2.66E-06 | |||
| 218400 | Craniometaphyseal dysplasia, autosomal recessive; 6q21-q22 | 215 | GJA1 | ENSG00000152661 | 1 | S | 65 | 8.67E-07 |
| 225000 | Rosselli-gulienetti syndrome; 11q23-q24 | 314 | BACE1 | ENSG00000186318 | 1 | S | 65 | 4.88E-07 |
| CRYAB | ENSG00000109846 | 1 | S | 65 | 4.88E-07 | |||
| TAGLN | ENSG00000149591 | 1 | S | 65 | 4.88E-07 | |||
| 255160 | Myopathy, hyaline body, autosomal recessive; 3p22.2-p21.32 | 84 | CMYA1 | ENSG00000168334 | 1 | A | 119 | 4.01E-18 |
| HHATL | ENSG00000010282 | 1 | A | 119 | 4.01E-18 | |||
| SCN5A | ENSG00000183873 | 1 | A | 83 | 1.74E-09 | |||
| 259450 | Bruck syndrome 1; 17p12 | 37 | MYOCD | ENSG00000141052 | 1 | A | 67 | 3.43E-06 |
| PMP22 | ENSG00000109099 | 1 | A | 68 | 3.64E-06 | |||
| 268700 | Saccharopinuria; 7q31.3 | 39 | AASS | ENSG00000008311 | 2#(iv) | A | 141 | 9.48E-15 |
| SLC13A1 | ENSG00000081800 | 1*(iv) | A | 88 | 1.80E-09 | |||
| TSPAN12 | ENSG00000106025 | 1*(iv) | A | 56 | 3.35E-07 | |||
| 300046 | Mental retardation, X-linked 23; Xq23-q24 | 116 | ACSL4 | ENSG00000068366 | 2 | A | 36 | 2.38E-06 |
| WDR44 | ENSG00000131725 | 1 | A | 36 | 2.38E-06 | |||
| 300148 | Mental retardation, epileptic seizures, hypogonadism and hypogenitalism, microcephaly, and obesity; Xp22.13-p21.1 | 117 | PDHA1 | ENSG00000131828 | 1 | A | 40 | 1.03E-09 |
| 300195 | Alport syndrome, mental retardation, midface hypoplasia, and elliptocytosis; Xq22.3 | 40 | COL4A5 | ENSG00000188153 | 2#(v) | A | 20 | 3.85E-06 |
| 300324 | Mental retardation, X-linked 53; Xq22.2-q26 | 327 | ACSL4 | ENSG00000068366 | 2 | A | 19 | 1.41E-06 |
| ARHGEF6 | ENSG00000129675 | 2 | A | 19 | 1.41E-06 | |||
| 300489 | Spinal muscular atrophy, distal, x-linked recessive; Xq13.1-q21 | 182 | ITGB1BP2 | ENSG00000147166 | 1 | A | 60 | 2.41E-06 |
| SH3BGRL | ENSG00000131171 | 1 | A | 26 | 3.16E-06 | |||
| 309610 | Prieto X-linked mental retardation syndrome; Xp11-q21 | 481 | ATRX | ENSG00000085224 | 2 | S | 24 | 6.25E-08 |
| HUWE1 | ENSG00000086758 | 1 | S | 24 | 6.25E-08 | |||
| OGT | ENSG00000147162 | 1 | S | 24 | 6.25E-08 | |||
| USP9X | ENSG00000124486 | 1 | S | 24 | 6.25E-08 | |||
| MAGED1 | ENSG00000179222 | 1 | A | 21 | 1.13E-07 | |||
| MAGED2 | ENSG00000102316 | 1 | A | 21 | 1.13E-07 | |||
| DIAPH2 | ENSG00000147202 | 1 | S | 17 | 2.28E-06 | |||
| CRSP2 | ENSG00000180182 | 1 | S | 107 | 6.20E-06 | |||
| RNF12 | ENSG00000131263 | 1 | S | 107 | 6.20E-06 | |||
| UTX | ENSG00000147050 | 1 | S | 107 | 6.20E-06 | |||
| 310440 | Myopathy, X-linked, with excessive autophagy; Xq28 | 151 | SLC6A8 | ENSG00000130821 | 1 | A | 76 | 8.25E-11 |
| SRPK3 | ENSG00000184343 | 1 | A | 62 | 1.12E-09 | |||
| IL9R | ENSG00000124334 | 1 | A | 79 | 6.05E-09 | |||
| DNASE1L1 | ENSG00000013563 | 1 | A | 29 | 6.40E-08 | |||
| BGN | ENSG00000182492 | 1 | S | 112 | 7.32E-08 | |||
| 311510 | Parkinsonism, early-onset, with mental retardation; Xq28 | 151 | BCAP31 | ENSG00000185825 | 1 | S | 26 | 3.48E-07 |
| IRAK1 | ENSG00000184216 | 1 | S | 26 | 3.48E-07 | |||
| SSR4 | ENSG00000180879 | 1 | S | 26 | 3.48E-07 | |||
| RAB39B | ENSG00000155961 | 1 | A | 66 | 2.02E-06 | |||
| 314580 | Wieacker syndrome; Xq13-q21 | 182 | ITGB1BP2 | ENSG00000147166 | 1 | A | 87 | 5.02E-08 |
| PHKA1 | ENSG00000067177 | 1 | A | 87 | 5.02E-08 | |||
| MAGEE1 | ENSG00000198934 | 1 | A | 144 | 1.89E-07 | |||
| APOOL | ENSG00000155008 | 1 | A | 54 | 2.97E-06 | |||
| 600131 | Epilepsy, childhood absence, 1; 8q24 | 247 | NIBP | ENSG00000167632 | 1 | A | 139 | 1.38E-07 |
| LYNX1 | ENSG00000180155 | 1 | A | 173 | 4.55E-07 | |||
| BAI1 | ENSG00000181790 | 1 | A | 88 | 8.59E-07 | |||
| 600175 | Spinal muscular atrophy, distal, congenital nonprogressive; 12q23-q24 | 445 | HSPB8 | ENSG00000152137 | 2 | A | 108 | 1.88E-07 |
| MYBPC1 | ENSG00000196091 | 1 | A | 108 | 1.88E-07 | |||
| MYL2 | ENSG00000111245 | 1 | A | 99 | 2.33E-06 | |||
| 600593 | Craniosynostosis, Adelaide type; 4p16 | 160 | MSX1 | ENSG00000163132 | 1 | A | 28 | 6.29E-07 |
| 600624 | Cone-rod dystrophy 1; 18q21.1-q21.3 | 148 | SERPINB2 | ENSG00000197632 | 1 | A | 63 | 3.75E-06 |
| SERPINB4 | ENSG00000057149 | 1 | A | 63 | 3.75E-06 | |||
| SERPINB5 | ENSG00000206075 | 1 | A | 63 | 3.75E-06 | |||
| SERPINB7 | ENSG00000166396 | 1 | A | 63 | 3.75E-06 | |||
| 600792 | Deafness, neurosensory, autosomal recessive 5; 14q12 | 43 | COCH | ENSG00000100473 | 2 | A | 31 | 1.36E-06 |
| FOXG1B | ENSG00000176165 | 1 | A | 31 | 1.36E-06 | |||
| 600964 | Refsum disease with increased pipecolic acidemia; 10pter-p11.2 | 312 | PHYH | ENSG00000107537 | 2 | A | 46 | 3.04E-06 |
| 600977 | Cone-rod dystrophy 5; 17p13-p12 | 319 | RCVRN | ENSG00000109047 | 1*( vi) | A | 12 | 1.04E-06 |
| PITPNM3 | ENSG00000091622 | 1*( vi) | A | 10 | 3.62E-06 | |||
| 601202 | Cataract, anterior polar, 2; 17p13 | 282 | RCVRN | ENSG00000109047 | 1 | A | 12 | 3.53E-07 |
| 601251 | Retinal cone dystrophy 2; 17p | 494 | RCVRN | ENSG00000109047 | 1*(vii) | A | 12 | 4.20E-07 |
| PITPNM3 | ENSG00000091622 | 1*(vii) | A | 10 | 2.65E-06 | |||
| 601362 | Digeorge syndrome/velocardiofacial syndrome spectrum of malformation 2; 10p14-p13 | 71 | GATA3 | ENSG00000107485 | 2 | A | 29 | 1.75E-07 |
| 601676 | Acute insulin response; 1p31 | 156 | ANGPTL3 | ENSG00000132855 | 1 | A | 46 | 4.21E-08 |
| CTH | ENSG00000116761 | 1 | A | 46 | 4.21E-08 | |||
| CRYZ | ENSG00000116791 | 1 | A | 37 | 1.84E-07 | |||
| 601764 | Convulsions, benign familial infantile, 1; 19q | 1002 | ATP1A3 | ENSG00000105409 | 1 | A | 100 | 2.71E-08 |
| FXYD7 | ENSG00000142290 | 1 | A | 100 | 2.71E-08 | |||
| SCN1B | ENSG00000105711 | 2$(viii) | A | 100 | 2.71E-08 | |||
| APLP1 | ENSG00000105290 | 1 | A | 82 | 6.25E-08 | |||
| CA11 | ENSG00000063180 | 1 | A | 82 | 6.25E-08 | |||
| TTYH1 | ENSG00000167614 | 1 | A | 82 | 6.25E-08 | |||
| LRRC4B | ENSG00000131409 | 1 | A | 125 | 4.11E-07 | |||
| MAG | ENSG00000105695 | 1 | A | 125 | 4.11E-07 | |||
| TMEM145 | ENSG00000167619 | 1 | A | 125 | 4.11E-07 | |||
| ZNF536 | ENSG00000198597 | 1 | A | 125 | 4.11E-07 | |||
| ZNF8 | ENSG00000083842 | 1 | A | 173 | 7.17E-07 | |||
| CPT1C | ENSG00000169169 | 1 | A | 115 | 8.94E-07 | |||
| CADM4 | ENSG00000105767 | 1 | A | 73 | 9.65E-07 | |||
| LIN7B | ENSG00000104863 | 1 | A | 139 | 1.05E-06 | |||
| PLD3 | ENSG00000105223 | 1 | A | 139 | 1.05E-06 | |||
| SPTBN4 | ENSG00000160460 | 1 | A | 139 | 1.05E-06 | |||
| GRIK5 | ENSG00000105737 | 1 | A | 88 | 3.73E-06 | |||
| 601846 | Vacuolar neuromyopathy; 19p13.3 | 238 | ITGB1BP3 | ENSG00000077009 | 1 | A | 119 | 2.44E-14 |
| NRTN | ENSG00000171119 | 1 | A | 108 | 2.89E-13 | |||
| GNG7 | ENSG00000176533 | 1 | A | 144 | 2.41E-10 | |||
| PRTN3 | ENSG00000196415 | 1 | A | 113 | 1.20E-09 | |||
| MKNK2 | ENSG00000099875 | 1 | A | 45 | 2.27E-07 | |||
| TRIP10 | ENSG00000125733 | 1 | A | 45 | 2.27E-07 | |||
| 602067 | Cardiomyopathy, dilated, 1f; 6q23 | 74 | AHI1 | ENSG00000135541 | 1 | A | 144 | 3.32E-14 |
| EYA4 | ENSG00000112319 | 1 | A | 134 | 9.27E-13 | |||
| TCF21 | ENSG00000118526 | 1 | A | 33 | 3.69E-12 | |||
| HEBP2 | ENSG00000051620 | 1 | A | 72 | 2.44E-06 | |||
| 603165 | Dermatitis, atopic; 1q21 | 334 | ANXA9 | ENSG00000143412 | 1 | A | 72 | 2.24E-09 |
| ECM1 | ENSG00000143369 | 1 | A | 72 | 2.24E-09 | |||
| FLG | ENSG00000143631 | 2 | A | 72 | 2.24E-09 | |||
| LOR | ENSG00000203782 | 1 | A | 72 | 2.24E-09 | |||
| S100A14 | ENSG00000189334 | 1 | A | 72 | 2.24E-09 | |||
| SPRR1B | ENSG00000169469 | 1 | A | 72 | 2.24E-09 | |||
| 603204 | Epilepsy, nocturnal frontal lobe, type 2; 15q24 | 97 | LINGO1 | ENSG00000169783 | 1 | A | 68 | 2.45E-08 |
| SCAMP5 | ENSG00000198794 | 1 | A | 51 | 9.65E-08 | |||
| 603511 | Muscular dystrophy, limb-girdle, type 1d; 7q | 1069 | ASB10 | ENSG00000146926 | 1 | A | 72 | 8.28E-09 |
| ASB15 | ENSG00000146809 | 1 | A | 72 | 8.28E-09 | |||
| FLNC | ENSG00000128591 | 3(ix) | A | 72 | 8.28E-09 | |||
| PPP1R3A | ENSG00000154415 | 1 | A | 72 | 8.28E-09 | |||
| PDK4 | ENSG00000004799 | 1 | A | 120 | 8.73E-09 | |||
| MYLC2PL | ENSG00000106436 | 1 | A | 119 | 9.20E-08 | |||
| CD36 | ENSG00000135218 | 1 | A | 144 | 1.13E-07 | |||
| EXOC4 | ENSG00000131558 | 1 | A | 144 | 1.13E-07 | |||
| EPHA1 | ENSG00000146904 | 1 | A | 26 | 2.89E-07 | |||
| FOXP2 | ENSG00000128573 | 1 | A | 26 | 2.89E-07 | |||
| 603786 | Stargardt disease 4; 4p | 361 | APBB2 | ENSG00000163697 | 1 | S | 77 | 2.34E-06 |
| FAM114A1 | ENSG00000197712 | 1 | S | 77 | 2.34E-06 | |||
| UGDH | ENSG00000109814 | 1 | S | 77 | 2.34E-06 | |||
| 604288 | Cardiomyopathy, dilated, 1h; 2q14-q22 | 278 | ACVR2A | ENSG00000121989 | 1 | A | 134 | 2.24E-08 |
| HNMT | ENSG00000150540 | 1 | A | 134 | 2.24E-08 | |||
| 604364 | Epilepsy, partial, with variable foci; 22q11-q12 | 474 | CACNG2 | ENSG00000166862 | 1 | A | 73 | 1.18E-07 |
| SEZ6L | ENSG00000100095 | 1 | A | 73 | 1.18E-07 | |||
| SLC25A18 | ENSG00000182902 | 1 | A | 73 | 1.18E-07 | |||
| GANZ | ENSG00000128266 | 1 | A | 51 | 8.91E-07 | |||
| C22orf25 | ENSG00000183597 | 1 | A | 39 | 1.31E-06 | |||
| 604454 | Welander distal myopathy; wdm; 2p13 | 111 | HK2 | ENSG00000159399 | 1 | A | 107 | 1.01E-13 |
| ANTXR1 | ENSG00000169604 | 1 | S;A | 98 | 1.75E-06 | |||
| ANXA4 | ENSG00000196975 | 1 | A | 73 | 3.04E-06 | |||
| 604499 | Hyperlipidemia, combined, 2; 11p | 637 | F2 | ENSG00000180210 | 1 | A | 103 | 1.02E-06 |
| HPX | ENSG00000110169 | 1 | A | 103 | 1.02E-06 | |||
| SAA4 | ENSG00000148965 | 1 | A | 103 | 1.02E-06 | |||
| 604781 | Ichthyosis, nonlamellar and nonerythrodermic, congenital, autosomal recessive; 19p13.2-p13.1 | 434 | ABHD9 | ENSG00000105131 | 1 | A | 57 | 4.18E-14 |
| CASP14 | ENSG00000105141 | 1 | A | 57 | 4.18E-14 | |||
| CYP4F22 | ENSG00000171954 | 1 | A | 57 | 4.18E-14 | |||
| KIAA1543 | ENSG00000076826 | 1 | A | 33 | 5.44E-10 | |||
| 604801 | Muscular dystrophy, congenital, 1b; 1q42 | 194 | ACTA1 | ENSG00000143632 | 2 | A | 119 | 1.66E-16 |
| CABC1 | ENSG00000163050 | 1 | A | 119 | 1.66E-16 | |||
| NID1 | ENSG00000116962 | 1 | S | 112 | 4.04E-08 | |||
| C1orf198 | ENSG00000119280 | 1 | S | 68 | 6.50E-07 | |||
| ABCB10 | ENSG00000135776 | 1 | S | 98 | 6.70E-07 | |||
| 605021 | Myoclonic epilepsy, infantile; 16p13 | 366 | A2BP1 | ENSG00000078328 | 1 | A | 100 | 3.94E-08 |
| CASKIN1 | ENSG00000167971 | 1 | A | 100 | 3.94E-08 | |||
| MAPK8IP3 | ENSG00000138834 | 1 | A | 100 | 3.94E-08 | |||
| SYNGR3 | ENSG00000127561 | 1 | A | 139 | 8.45E-07 | |||
| FLYWCH1 | ENSG00000059122 | 1 | A | 173 | 1.72E-06 | |||
| 605285 | Neuropathy, hereditary motor and sensory, russe type; 10q23.2 | 26 | SNCG | ENSG00000173267 | 1 | A | 32 | 5.27E-09 |
| 605480 | Systemic lupus erythematosus, susceptibility to; 4p16-p15.2 | 239 | CRMP1 | ENSG00000072832 | 1 | A | 51 | 1.21E-06 |
| KCNIP4 | ENSG00000185774 | 1 | A | 51 | 1.21E-06 | |||
| LGI2 | ENSG00000153012 | 1 | A | 51 | 1.21E-06 | |||
| NSG1 | ENSG00000168824 | 1 | A | 52 | 1.32E-06 | |||
| PPP2R2C | ENSG00000074211 | 1 | A | 52 | 1.32E-06 | |||
| 605582 | Cardiomyopathy, dilated, 1k; 6q12-q16 | 209 | ME1 | ENSG00000065833 | 3$(x) | A | 76 | 9.60E-08 |
| TPBG | ENSG00000146242 | 1 | A | 134 | 4.83E-07 | |||
| 605642 | Thyroid carcinoma, papillary, with papillary renal neoplasia; 1q21 | 334 | MRPL9 | ENSG00000143436 | 1 | A | 9 | 1.17E-06 |
| PRKAB2 | ENSG00000131791 | 1 | A | 58 | 2.97E-06 | |||
| 605711 | Multiple mitochondrial dysfunctions syndrome; 2p14-p13 | 142 | MCEE | ENSG00000124370 | 1 | A | 54 | 1.28E-06 |
| 605751 | Convulsions, benign familial infantile, 2; 16p12-q12 | 407 | GNAO1 | ENSG00000087258 | 1 | A | 173 | 4.17E-08 |
| MT3 | ENSG00000087250 | 1 | A | 173 | 4.17E-08 | |||
| SEZ6L2 | ENSG00000174938 | 1 | A | 84 | 2.67E-07 | |||
| ITFG1 | ENSG00000129636 | 1 | A | 159 | 1.14E-06 | |||
| USP31 | ENSG00000103404 | 1 | A | 159 | 1.14E-06 | |||
| CE110 | ENSG00000103540 | 1 | A | 157 | 2.84E-06 | |||
| PRKCB1 | ENSG00000166501 | 1 | A | 157 | 2.84E-06 | |||
| 605809 | Myasthenia, familial infantile, 1; 17p13 | 282 | hCG_1776018 | ENSG00000188265 | 1 | A | 32 | 1.86E-06 |
| CHRNB1 | ENSG00000170175 | 2£(xi) | A | 68 | 3.01E-06 | |||
| ENO3 | ENSG00000108515 | 1 | A | 68 | 3.01E-06 | |||
| MYH1 | ENSG00000109061 | 1 | A | 68 | 3.01E-06 | |||
| 606070 | Myopathy, distal 2; 5q | 1116 | MYOT | ENSG00000120729 | 2 | A | 120 | 2.33E-09 |
| THBS4 | ENSG00000113296 | 1 | A | 120 | 2.33E-09 | |||
| DBN1 | ENSG00000113758 | 1 | S | 45 | 3.10E-08 | |||
| LOX | ENSG00000113083 | 1 | S | 45 | 3.10E-08 | |||
| LOC493869 | ENSG00000164294 | 1 | S | 45 | 3.10E-08 | |||
| SLIT3 | ENSG00000184347 | 1 | S | 45 | 3.10E-08 | |||
| SPARC | ENSG00000113140 | 1 | S | 45 | 3.10E-08 | |||
| HSPB3 | ENSG00000169271 | 1 | A | 114 | 5.19E-08 | |||
| MEF2C | ENSG00000081189 | 1 | A | 114 | 5.19E-08 | |||
| AFAP1L1 | ENSG00000157510 | 1 | A | 144 | 6.16E-08 | |||
| EDIL3 | ENSG00000164176 | 1 | A | 144 | 6.16E-08 | |||
| FGF1 | ENSG00000113578 | 1 | A | 144 | 6.16E-08 | |||
| GABRG2 | ENSG00000113327 | 1 | A | 144 | 6.16E-08 | |||
| SCAMP1 | ENSG00000085365 | 1 | A | 144 | 6.16E-08 | |||
| CTNNA1 | ENSG00000044115 | 1 | S | 84 | 7.06E-08 | |||
| EGR1 | ENSG00000120738 | 1 | S | 84 | 7.06E-08 | |||
| IL6ST | ENSG00000134352 | 1 | S | 84 | 7.06E-08 | |||
| NR2F1 | ENSG00000175745 | 1 | S | 84 | 7.06E-08 | |||
| PCDHGA12 | ENSG00000081853 | 1 | S | 84 | 7.06E-08 | |||
| PPIC | ENSG00000168938 | 1 | S | 84 | 7.06E-08 | |||
| VCAN | ENSG00000038427 | 1 | S | 84 | 7.06E-08 | |||
| GABRP | ENSG00000094755 | 1 | A | 62 | 9.02E-08 | |||
| SPINK5 | ENSG00000133710 | 1 | A | 120 | 9.28E-08 | |||
| SYNPO | ENSG00000171992 | 1 | S | 65 | 4.99E-07 | |||
| EFNA5 | ENSG00000184349 | 1 | S | 75 | 5.90E-07 | |||
| PDGFRB | ENSG00000113721 | 1 | S | 75 | 5.90E-07 | |||
| PAM | ENSG00000145730 | 1 | S | 112 | 1.27E-06 | |||
| REEP5 | ENSG00000129625 | 1 | S | 112 | 1.27E-06 | |||
| LAEVR | ENSG00000172901 | 1 | A | 44 | 1.35E-06 | |||
| MAP1B | ENSG00000131711 | 1 | S | 98 | 2.10E-06 | |||
| P4HA2 | ENSG00000072682 | 1 | S | 98 | 2.10E-06 | |||
| DPYSL3 | ENSG00000113657 | 1 | S | 90 | 2.34E-06 | |||
| NR3C1 | ENSG00000113580 | 1 | S | 64 | 2.39E-06 | |||
| GFM2 | ENSG00000164347 | 1 | A | 68 | 2.53E-06 | |||
| U384 | ENSG00000048162 | 1 | A | 68 | 2.53E-06 | |||
| CKMT2 | ENSG00000131730 | 1 | A | 68 | 3.90E-06 | |||
| 606257 | Stature quantitative trait locus 3; 12p11.2-q14 | 548 | KRT1 | ENSG00000167768 | 1 | A | 72 | 1.32E-06 |
| KRT2 | ENSG00000172867 | 1 | A | 72 | 1.32E-06 | |||
| KRT71 | ENSG00000139648 | 1 | A | 72 | 1.32E-06 | |||
| KRT8 | ENSG00000170421 | 1 | A | 72 | 1.32E-06 | |||
| PP11 | ENSG00000111405 | 1 | A | 72 | 1.32E-06 | |||
| 606483 | Charcot-Marie-Tooth disease, dominant intermediate A; 10q24.1-q25.1 | 179 | SFRP5 | ENSG00000120057 | 1 | A | 69 | 1.61E-06 |
| 606545 | Ichthyosis, lamellar, 5; 17p13.2-p13.1 | 210 | ALOX12B | ENSG00000179477 | 2 | A | 58 | 1.78E-17 |
| ALOXE3 | ENSG00000179148 | 2 | A | 58 | 1.78E-17 | |||
| GGT6 | ENSG00000167741 | 1 | A | 58 | 1.78E-17 | |||
| ENO3 | ENSG00000108515 | 1 | A | 71 | 1.65E-16 | |||
| SOX15 | ENSG00000129194 | 1 | A | 41 | 3.05E-10 | |||
| MYH2 | ENSG00000125414 | 1 | A | 65 | 1.35E-09 | |||
| CLDN7 | ENSG00000181885 | 1 | A | 186 | 5.49E-07 | |||
| 606708 | Split-hand/foot malformation 5; 2q31 | 126 | HOXD10 | ENSG00000128710 | 1 | A | 13 | 4.55E-07 |
| HOXD8 | ENSG00000175879 | 1 | A | 13 | 4.55E-07 | |||
| HOXD11 | ENSG00000128713 | 1 | A | 63 | 1.67E-06 | |||
| HOXD3 | ENSG00000128652 | 1 | A | 63 | 1.67E-06 | |||
| HOXD13 | ENSG00000128714 | 2$(xii) | A | 28 | 2.08E-06 | |||
| 606744 | Seckel syndrome 2; 18p11.31-q11.2 | 169 | VAPA | ENSG00000101558 | 1 | A | 36 | 3.68E-06 |
| 607086 | Aortic aneurysm, familial thoracic 1; 11q23.3-q24 | 250 | TAGLN | ENSG00000149591 | 1 | A | 92 | 8.74E-07 |
| MCAM | ENSG00000076706 | 1 | A | 138 | 1.83E-06 | |||
| 607088 | Spinal muscular atrophy, distal, autosomal recessive, 3; 11q13 | 354 | ACTN3 | ENSG00000204633 | 1 | A | 108 | 2.28E-10 |
| PYGM | ENSG00000068976 | 1 | A | 108 | 2.28E-10 | |||
| EHBP1L1 | ENSG00000173442 | 1 | A | 87 | 5.07E-08 | |||
| LRP16 | ENSG00000133315 | 1 | A | 144 | 5.11E-08 | |||
| P2RY2 | ENSG00000175591 | 1 | A | 120 | 1.87E-07 | |||
| CCND1 | ENSG00000110092 | 1 | S | 98 | 3.99E-07 | |||
| SERPINH1 | ENSG00000149257 | 1 | S;A | 98 | 3.99E-07 | |||
| PLCB3 | ENSG00000149782 | 1 | A | 52 | 1.03E-06 | |||
| PDE2A | ENSG00000186642 | 1 | S | 65 | 1.72E-06 | |||
| FOLR2 | ENSG00000165457 | 1 | A | 85 | 1.82E-06 | |||
| UCP3 | ENSG00000175564 | 1 | A | 85 | 1.82E-06 | |||
| CTTN | ENSG00000085733 | 1 | S | 79 | 1.84E-06 | |||
| CD248 | ENSG00000174807 | 1 | A | 72 | 2.05E-06 | |||
| DGAT2 | ENSG00000062282 | 1 | A | 75 | 2.55E-06 | |||
| ARHGEF17 | ENSG00000110237 | 1 | S | 84 | 2.68E-06 | |||
| 607221 | Epilepsy, partial, with pericentral spikes; 4p15 | 86 | KCNIP4 | ENSG00000185774 | 1 | A | 143 | 1.65E-07 |
| LGI2 | ENSG00000153012 | 1 | A | 51 | 2.31E-07 | |||
| 607936 | Exfoliative ichthyosis, autosomal recessive, ichthyosis bullosa of siemens-like; 12q13 | 355 | KRT1 | ENSG00000167768 | 2 | A | 57 | 6.70E-20 |
| KRT2 | ENSG00000172867 | 2 | A | 57 | 6.70E-20 | |||
| KRT8 | ENSG00000170421 | 1 | A | 57 | 6.70E-20 | |||
| KRT84 | ENSG00000161849 | 1 | A | 57 | 6.70E-20 | |||
| SDR-O | ENSG00000170426 | 1 | A | 57 | 6.70E-20 | |||
| KRT71 | ENSG00000139648 | 1 | A | 52 | 1.55E-19 | |||
| PP11 | ENSG00000111405 | 1 | A | 61 | 1.06E-18 | |||
| VDR | ENSG00000111424 | 1 | A | 61 | 1.06E-18 | |||
| KRT4 | ENSG00000170477 | 1 | A | 71 | 1.97E-15 | |||
| KRT76 | ENSG00000185069 | 1 | A | 67 | 2.51E-13 | |||
| RARG | ENSG00000172819 | 1 | A | 76 | 2.38E-11 | |||
| GLS2 | ENSG00000135423 | 1 | A | 33 | 4.03E-09 | |||
| SLC38A4 | ENSG00000139209 | 1 | A | 33 | 4.03E-09 | |||
| HOXC13 | ENSG00000123364 | 1 | A | 117 | 4.15E-09 | |||
| KRT82 | ENSG00000161850 | 1 | A | 41 | 8.03E-07 | |||
| 608096 | Epilepsy, familial temporal lobe; 12q22-q23.3 | 163 | ANKS1B | ENSG00000185046 | 1 | A | 143 | 1.04E-06 |
| 608224 | Deafness, autosomal dominant nonsyndromic sensorineural 41; 12q24.32-qter | 71 | POLE | ENSG00000177084 | 1 | A | 19 | 1.00E-06 |
| ULK1 | ENSG00000177169 | 1 | A | 19 | 1.00E-06 | |||
| 608318 | Coronary heart disease, susceptibility to, 4; 14q32 | 414 | SERPINA10 | ENSG00000140093 | 1 | A | 9 | 1.25E-06 |
| 608423 | Muscular dystrophy, limb-girdle, type 1f; 7q32.1-q32.2 | 71 | FAM40B | ENSG00000128578 | 1 | A | 113 | 4.50E-11 |
| FLNC | ENSG00000128591 | 2(ix) | S;A | 112 | 3.44E-08 | |||
| LEP | ENSG00000174697 | 1 | A | 24 | 1.45E-06 | |||
| 608762 | Epilepsy, idiopathic generalized, susceptibility to, 3; 9q32-q33 | 161 | GOLGA1 | ENSG00000136935 | 1 | A | 173 | 4.49E-06 |
| 608816 | Myoclonic epilepsy, juvenile, 3; 6p21 | 395 | PACSIN1 | ENSG00000124507 | 1 | A | 173 | 1.01E-07 |
The column ‘status’ reviews the current knowledge about the association of the candidate with the disease. In particular, 1 = gene not previously associated with the disease; 2 = gene involved in mendelian phenotype sharing a MimMiner similarity score of 0.4 or higher with the phenotypic description of the locus; 3 = gene previously considered as a candidate for clinical similarity, but with a MimMiner similarity score to the locus lower than 0.4. Moreover, genes annotated with “#” represent the actual disease gene, because mutations have been found in patients; genes annotated with “£” have been excluded by refining the map interval; genes annotated with “*” could be excluded because mutations have been found in a different gene of the same locus; genes annotated with “$” are at the moment excluded because they have been screened but no mutations considered to be relevant have been found. The above statements are supported by the indicated references: i = [38]; ii = [39]; iii = [40]; iv = [41]; v = [42]; vi = [43]; vii = [44]; viii = [45]; ix = [46]; x = [47]; xi = [48]; xii = [49]. The column “Net.” indicates the networks from which the candidate was predicted: A = Affy; S = Stanford.
Notably, for three OMIM phenotypes (163000, familial multiple nevi flammei; 268700, saccharopinuria; 300195; AMMECR1) our predictions include the actual disease genes that, although not yet correctly annotated in OMIM, have been found to be mutated in patients (see Table 2).
For 22 loci, at least one of the candidates obtained from either network was already known to be involved in phenotypes similar to those described for the locus. These genes represent the most obvious candidates and our results should be considered as further, independent evidence for their possible involvement in the disease. However, it must be noted that some of them were previously excluded, either by the direct identification of crossovers or by the negative results of mutation screenings. Nevertheless, since mutations have most likely been searched only within the annotated exons, we think that the decision to definitively rule out the involvement of such candidates should be taken cautiously. Moreover, even silent exonic mutations, although often considered innocuous polymorphisms, can have severe effects on proteins by disrupting splicing patterns [27],[28].
In most cases only few candidates are given for a locus, thus providing extremely focused working hypotheses for the identification of the actual disease genes, which in many cases are made even stronger by the available sequence or functional information.
For instance, one of the two candidates provided for the OMIM phenotype entry 607221 (partial epilepsy with pericentral spikes, located on 4p15) corresponds to KCNIP4 (Figure 4). This protein has been show to specifically modulate the activity of Kv4 A-type potassium channels [29], which are well known regulators of membrane excitability [30] and have been recently involved in epilepsy [31]. Another interesting example is given by the 605285 phenotype entry (hereditary motor and sensory neuropathy, Russe type, mapped to 10q23.2, a locus comprising only 26 candidate genes). The only prediction for this locus is gamma-synuclein (SNCG), which is a very strong candidate both for the low P-value and for the known role of synucleins in neurodegenerative disorders [32].
Figure 4. Example of identification of candidate disease genes.

Identification of KCNIP4 (green) in the genomic locus 4p15 (containing 86 genes; orange), associated with partial epilepsy with pericentral spikes (OMIM ID 607221). KCNIP4 was found in a disease-related cluster composed of LOC399947 and its nearest neighbors (red and purple spheres, respectively) that contains 5 other genes known to be involved in similar phenotypes (yellow spheres). A second candidate for this disease was found in another disease-associated cluster (not shown; see Table 2).
Even when the number of candidates for a particular locus is substantially higher, our results may provide a strong restriction of the experimental search field, which can be further narrowed by additional evidences. For instance, the phenotype with OMIM ID 130080 (Ehlers-Danlos syndrome, type VIII), is mapped to 12p13, containing 277 genes. In this case, the Affy and Stanford networks provide 8 and 4 candidates, respectively. Interestingly, the candidate with the lowest associated P-value is the Alpha-2-macroglobulin precursor (A2M), whose absence was previously reported in a patient with Ehlers-Danlos syndrome [33]. A second interesting protein for this locus is CD9 that is the only candidate provided by both networks and that is known to regulate collagen matrix organization by interacting with Beta1 integrin [34].
In general, given the highly stringent criteria that we adopted and considering that the starting data underlying the two networks are completely independent, we propose that the 4 common candidates (Table 2) should be considered as those having the highest priority for experimental validation.
Since a recent study has identified high confidence candidate genes by integrating protein-protein interaction with phenotypic information [8], we evaluated the number of common predictions, and found that a candidate is proposed by both approaches for 7 loci. In 5 cases the candidate proposed by Lage et al. did not overlap with our predictions. The only, remarkable exception was Filamin C (FLNC), which was found as a candidate on chromosome 7q for both the 608423 (limb-girdle muscular dystrophy type 1F) and the 603511 (limb-girdle muscular dystrophy type 1D) OMIM phenotype entries. Interestingly, the FLNC gene has been previously implicated in myopathy, but mutations have not been reported in families mapping to the above loci. Thus, our results can be considered as further supporting evidence, pointing to the actual involvement of this gene in limb-girdle muscular dystrophy.
Discussion
In the present report we have shown that the integration of massive gene expression data with phenotype similarity maps can allow to efficiently identify high-probability candidates for many orphan human genetic disease loci, even when these comprise hundreds of genes.
The comparison of the two different networks clearly showed that the Affy network is characterized by a much better signal/noise ratio than the Stanford network. Although this may be partially due to the different source material (normal tissues in the first case, mostly tumor cell lines in the second case) we think that this could also depend on the higher technical standards reached by oligonucleotide-based platforms. Nevertheless, it is also important to notice that the analysis of the Stanford network allowed the prediction of many candidates that were not obtained from the Affy network, indicating that different datasets can result in complementary predictions.
Interestingly, in both cases the gene coexpression criterion proved to be much more effective than it could be expected from previous work, where it has been mostly used in combination with other high-throughput information sources. We think that these results strongly underscore two critical points. The first is the importance of using a restrictive filter to select biologically relevant coexpression links, such as our phylogenetic filter selecting links which are under selective pressure and therefore more likely to imply functional relationships. The second is the usefulness of systematic phenotype analysis methods, which may capture disease similarities that could easily escape human operator-based approaches.
Although very significant under the statistical point of view, the overlapping between conserved-coexpression links and physical protein-protein interaction data appeared to be rather limited in absolute terms, strengthening the idea that these criteria may cover partially overlapping subsets of the functional interaction space. Our results strongly suggest that, in most of the cases, requiring the concordance of coexpression data and protein-protein interaction data may worsen, instead of improving, the performances of both methods. Therefore, we envisage the independent use of both types of evidence to predict functional relationships and candidate disease genes. However, in the limited cases for which these approaches provide convergent results, they can be used as strong additive evidence.
In conclusion, we propose that our method and our list of candidates will provide a useful support for the identification of new disease-relevant genes.
Supporting Information
Stanford human-mouse conserved coexpression network. Each row contains a link between two Entrez-Gene identifiers.
(0.66 MB TXT)
Affy human-mouse conserved coexpression network. Each row contains a link between two Entrez-Gene identifiers.
(1.89 MB TXT)
Acknowledgments
The graphical representation of the network was obtained with BioLayout Express 3D (http://www.biolayout.org).
Footnotes
The authors have declared that no competing interests exist.
This work was funded by the Regione Piemonte CIPE Program to LS and by the Italian Ministry of University and Research through the FIRB program to FDC and PP.
References
- 1.van Driel MA, Brunner HG. Bioinformatics methods for identifying candidate disease genes. Hum Genomics. 2006;2:429–432. doi: 10.1186/1479-7364-2-6-429. [DOI] [PMC free article] [PubMed] [Google Scholar]
- 2.Lopez-Bigas N, Ouzounis CA. Genome-wide identification of genes likely to be involved in human genetic disease. Nucleic Acids Res. 2004;32:3108–3114. doi: 10.1093/nar/gkh605. [DOI] [PMC free article] [PubMed] [Google Scholar]
- 3.Barabasi AL, Oltvai ZN. Network biology: understanding the cell's functional organization. Nat Rev Genet. 2004;5:101–113. doi: 10.1038/nrg1272. [DOI] [PubMed] [Google Scholar]
- 4.Oti M, Brunner HG. The modular nature of genetic diseases. Clin Genet. 2007;71:1–11. doi: 10.1111/j.1399-0004.2006.00708.x. [DOI] [PubMed] [Google Scholar]
- 5.Franke L, Bakel H, Fokkens L, de Jong ED, Egmont-Petersen M, et al. Reconstruction of a functional human gene network, with an application for prioritizing positional candidate genes. Am J Hum Genet. 2006;78:1011–1025. doi: 10.1086/504300. [DOI] [PMC free article] [PubMed] [Google Scholar]
- 6.Turner FS, Clutterbuck DR, Semple CA. POCUS: mining genomic sequence annotation to predict disease genes. Genome Biol. 2003;4:R75. doi: 10.1186/gb-2003-4-11-r75. [DOI] [PMC free article] [PubMed] [Google Scholar]
- 7.Perez-Iratxeta C, Bork P, Andrade MA. Association of genes to genetically inherited diseases using data mining. Nat Genet. 2002;31:316–319. doi: 10.1038/ng895. [DOI] [PubMed] [Google Scholar]
- 8.Lage K, Karlberg EO, Storling ZM, Olason PI, Pedersen AG, et al. A human phenome-interactome network of protein complexes implicated in genetic disorders. Nat Biotechnol. 2007;25:309–316. doi: 10.1038/nbt1295. [DOI] [PubMed] [Google Scholar]
- 9.von Mering C, Krause R, Snel B, Cornell M, Oliver SG, et al. Comparative assessment of large-scale data sets of protein-protein interactions. Nature. 2002;417:399–403. doi: 10.1038/nature750. [DOI] [PubMed] [Google Scholar]
- 10.Oti M, Snel B, Huynen MA, Brunner HG. Predicting disease genes using protein-protein interactions. J Med Genet. 2006;43:691–698. doi: 10.1136/jmg.2006.041376. [DOI] [PMC free article] [PubMed] [Google Scholar]
- 11.Eisen MB, Spellman PT, Brown PO, Botstein D. Cluster analysis and display of genome-wide expression patterns. Proc Natl Acad Sci U S A. 1998;95:14863–14868. doi: 10.1073/pnas.95.25.14863. [DOI] [PMC free article] [PubMed] [Google Scholar]
- 12.Mootha VK, Lepage P, Miller K, Bunkenborg J, Reich M, et al. Identification of a gene causing human cytochrome c oxidase deficiency by integrative genomics. Proc Natl Acad Sci U S A. 2003;100:605–610. doi: 10.1073/pnas.242716699. [DOI] [PMC free article] [PubMed] [Google Scholar]
- 13.Rossi S, Masotti D, Nardini C, Bonora E, Romeo G, et al. TOM: a web-based integrated approach for identification of candidate disease genes. Nucleic Acids Res. 2006;34:W285–292. doi: 10.1093/nar/gkl340. [DOI] [PMC free article] [PubMed] [Google Scholar]
- 14.Spellman P, Rubin G. Evidence for large domains of similarly expressed genes in the Drosophila genome. J Biol. 2002;1:5. doi: 10.1186/1475-4924-1-5. [DOI] [PMC free article] [PubMed] [Google Scholar]
- 15.Fukuoka Y, Inaoka H, Kohane IS. Inter-species differences of coexpression of neighboring genes in eukaryotic genomes. BMC Genomics. 2004;5:4. doi: 10.1186/1471-2164-5-4. [DOI] [PMC free article] [PubMed] [Google Scholar]
- 16.Pellegrino M, Provero P, Silengo L, Di Cunto F. CLOE: identification of putative functional relationships among genes by comparison of expression profiles between two species. BMC Bioinformatics. 2004;5:179. doi: 10.1186/1471-2105-5-179. [DOI] [PMC free article] [PubMed] [Google Scholar]
- 17.Stuart JM, Segal E, Koller D, Kim SK. A Gene-Coexpression Network for Global Discovery of Conserved Genetic Modules. Science. 2003;302:249–255. doi: 10.1126/science.1087447. [DOI] [PubMed] [Google Scholar]
- 18.Gollub J, Ball CA, Binkley G, Demeter J, Finkelstein DB, et al. The Stanford Microarray Database: data access and quality assessment tools. Nucleic Acids Res. 2003;31:94–96. doi: 10.1093/nar/gkg078. [DOI] [PMC free article] [PubMed] [Google Scholar]
- 19.Roth RB, Hevezi P, Lee J, Willhite D, Lechner SM, et al. Gene expression analyses reveal molecular relationships among 20 regions of the human CNS. Neurogenetics. 2006;7:67–80. doi: 10.1007/s10048-006-0032-6. [DOI] [PubMed] [Google Scholar]
- 20.Su AI, Wiltshire T, Batalov S, Lapp H, Ching KA, et al. A gene atlas of the mouse and human protein-encoding transcriptomes. Proc Natl Acad Sci U S A. 2004;101:6062–6067. doi: 10.1073/pnas.0400782101. [DOI] [PMC free article] [PubMed] [Google Scholar]
- 21.Maglott D, Ostell J, Pruitt KD, Tatusova T. Entrez Gene: gene-centered information at NCBI. Nucleic Acids Res. 2007;35:D26–D31. doi: 10.1093/nar/gkl993. [DOI] [PMC free article] [PubMed] [Google Scholar]
- 22.van Driel MA, Bruggeman J, Vriend G, Brunner HG, Leunissen JA. A text-mining analysis of the human phenome. Eur J Hum Genet. 2006;14:535–542. doi: 10.1038/sj.ejhg.5201585. [DOI] [PubMed] [Google Scholar]
- 23.Peri S, Navarro JD, Amanchy R, Kristiansen TZ, Jonnalagadda CK, et al. Development of human protein reference database as an initial platform for approaching systems biology in humans. Genome Res. 2003;13:2363–2371. doi: 10.1101/gr.1680803. [DOI] [PMC free article] [PubMed] [Google Scholar]
- 24.Mishra GR, Suresh M, Kumaran K, Kannabiran N, Suresh S, et al. Human protein reference database–2006 update. Nucleic Acids Res. 2006;34:D411–D414. doi: 10.1093/nar/gkj141. [DOI] [PMC free article] [PubMed] [Google Scholar]
- 25.Hubbard TJ, Aken BL, Beal K, Ballester B, Caccamo M, et al. Ensembl 2007. Nucleic Acids Res. 2007;35:D610–D617. doi: 10.1093/nar/gkl996. [DOI] [PMC free article] [PubMed] [Google Scholar]
- 26.Jordan IK, Marino-Ramirez L, Wolf YI, Koonin EV. Conservation and coevolution in the scale-free human gene coexpression network. Mol Biol Evol. 2004;21:2058–2070. doi: 10.1093/molbev/msh222. [DOI] [PubMed] [Google Scholar]
- 27.Faustino NA, Cooper TA. Pre-mRNA splicing and human disease. Genes Dev. 2003;17:419–437. doi: 10.1101/gad.1048803. [DOI] [PubMed] [Google Scholar]
- 28.Pagani F, Raponi M, Baralle FE. Synonymous mutations in CFTR exon 12 affect splicing and are not neutral in evolution. Proc Natl Acad Sci U S A. 2005;102:6368–6372. doi: 10.1073/pnas.0502288102. [DOI] [PMC free article] [PubMed] [Google Scholar]
- 29.Morohashi Y, Hatano N, Ohya S, Takikawa R, Watabiki T, et al. Molecular cloning and characterization of CALP/KChIP4, a novel EF-hand protein interacting with presenilin 2 and voltage-gated potassium channel subunit Kv4. J Biol Chem. 2002;277:14965–14975. doi: 10.1074/jbc.M200897200. [DOI] [PubMed] [Google Scholar]
- 30.Birnbaum SG, Varga AW, Yuan LL, Anderson AE, Sweatt JD, et al. Structure and function of Kv4-family transient potassium channels. Physiol Rev. 2004;84:803–833. doi: 10.1152/physrev.00039.2003. [DOI] [PubMed] [Google Scholar]
- 31.Singh B, Ogiwara I, Kaneda M, Tokonami N, Mazaki E, et al. A Kv4.2 truncation mutation in a patient with temporal lobe epilepsy. Neurobiol Dis. 2006;24:245–253. doi: 10.1016/j.nbd.2006.07.001. [DOI] [PubMed] [Google Scholar]
- 32.George JM. The synucleins. Genome Biol. 2002;3:REVIEWS3002. doi: 10.1186/gb-2001-3-1-reviews3002. [DOI] [PMC free article] [PubMed] [Google Scholar]
- 33.Mahour GH, Song MK, Adham NF, Rinderknecht H. Alpha2-macroglobulin deficiency in a patient with Ehlers-Danlos syndrome. Pediatrics. 1978;61:894–897. [PubMed] [Google Scholar]
- 34.Scherberich A, Moog S, Haan-Archipoff G, Azorsa DO, Lanza F, et al. Tetraspanin CD9 is associated with very late-acting integrins in human vascular smooth muscle cells and modulates collagen matrix reorganization. Arterioscler Thromb Vasc Biol. 1998;18:1691–1697. doi: 10.1161/01.atv.18.11.1691. [DOI] [PubMed] [Google Scholar]
- 35.Perez-Iratxeta C, Wjst M, Bork P, Andrade MA. G2D: a tool for mining genes associated with disease. BMC Genet. 2005;6:45. doi: 10.1186/1471-2156-6-45. [DOI] [PMC free article] [PubMed] [Google Scholar]
- 36.Freudenberg J, Propping P. A similarity-based method for genome-wide prediction of disease-relevant human genes. Bioinformatics. 2002;18(Suppl 2):S110–115. doi: 10.1093/bioinformatics/18.suppl_2.s110. [DOI] [PubMed] [Google Scholar]
- 37.Adie EA, Adams RR, Evans KL, Porteous DJ, Pickard BS. Speeding disease gene discovery by sequence based candidate prioritization. BMC Bioinformatics. 2005;6:55. doi: 10.1186/1471-2105-6-55. [DOI] [PMC free article] [PubMed] [Google Scholar]
- 38.Leoyklang P, Suphapeetiporn K, Siriwan P, Desudchit T, Chaowanapanja P, et al. Heterozygous nonsense mutation SATB2 associated with cleft palate, osteoporosis, and cognitive defects. Hum Mutat. 2007;28:732–738. doi: 10.1002/humu.20515. [DOI] [PubMed] [Google Scholar]
- 39.Sudbrak R, Golla A, Hogan K, Powers P, Gregg R, et al. Exclusion of malignant hyperthermia susceptibility (MHS) from a putative MHS2 locus on chromosome 17q and of the alpha 1, beta 1, and gamma subunits of the dihydropyridine receptor calcium channel as candidates for the molecular defect. Hum Mol Genet. 1993;2:857–862. doi: 10.1093/hmg/2.7.857. [DOI] [PubMed] [Google Scholar]
- 40.Eerola I, Boon LM, Mulliken JB, Burrows PE, Dompmartin A, et al. Capillary malformation-arteriovenous malformation, a new clinical and genetic disorder caused by RASA1 mutations. Am J Hum Genet. 2003;73:1240–1249. doi: 10.1086/379793. [DOI] [PMC free article] [PubMed] [Google Scholar]
- 41.Sacksteder KA, Biery BJ, Morrell JC, Goodman BK, Geisbrecht BV, et al. Identification of the alpha-aminoadipic semialdehyde synthase gene, which is defective in familial hyperlysinemia. Am J Hum Genet. 2000;66:1736–1743. doi: 10.1086/302919. [DOI] [PMC free article] [PubMed] [Google Scholar]
- 42.Jonsson JJ, Renieri A, Gallagher PG, Kashtan CE, Cherniske EM, et al. Alport syndrome, mental retardation, midface hypoplasia, and elliptocytosis: a new X linked contiguous gene deletion syndrome? J Med Genet. 1998;35:273–278. doi: 10.1136/jmg.35.4.273. [DOI] [PMC free article] [PubMed] [Google Scholar]
- 43.Udar N, Yelchits S, Chalukya M, Yellore V, Nusinowitz S, et al. Identification of GUCY2D gene mutations in CORD5 families and evidence of incomplete penetrance. Hum Mutat. 2003;21:170–171. doi: 10.1002/humu.9109. [DOI] [PubMed] [Google Scholar]
- 44.Freund CL, Gregory-Evans CY, Furukawa T, Papaioannou M, Looser J, et al. Cone-rod dystrophy due to mutations in a novel photoreceptor-specific homeobox gene (CRX) essential for maintenance of the photoreceptor. Cell. 1997;91:543–553. doi: 10.1016/s0092-8674(00)80440-7. [DOI] [PubMed] [Google Scholar]
- 45.Moulard B, Buresi C, Malafosse A. Study of the voltage-gated sodium channel beta 1 subunit gene (SCN1B) in the benign familial infantile convulsions syndrome (BFIC). Hum Mutat. 2000;16:139–142. doi: 10.1002/1098-1004(200008)16:2<139::AID-HUMU6>3.0.CO;2-J. [DOI] [PubMed] [Google Scholar]
- 46.Vorgerd M, van der Ven PF, Bruchertseifer V, Lowe T, Kley RA, et al. A mutation in the dimerization domain of filamin c causes a novel type of autosomal dominant myofibrillar myopathy. Am J Hum Genet. 2005;77:297–304. doi: 10.1086/431959. [DOI] [PMC free article] [PubMed] [Google Scholar]
- 47.Sylvius N, Tesson F, Gayet C, Charron P, Benaiche A, et al. A new locus for autosomal dominant dilated cardiomyopathy identified on chromosome 6q12-q16. Am J Hum Genet. 2001;68:241–246. doi: 10.1086/316929. [DOI] [PMC free article] [PubMed] [Google Scholar]
- 48.Christodoulou K, Tsingis M, Deymeer F, Serdaroglu P, Ozdemir C, et al. Mapping of the familial infantile myasthenia (congenital myasthenic syndrome type Ia) gene to chromosome 17p with evidence of genetic homogeneity. Hum Mol Genet. 1997;6:635–640. doi: 10.1093/hmg/6.4.635. [DOI] [PubMed] [Google Scholar]
- 49.Garcia-Ortiz JE, Banda-Espinoza F, Zenteno JC, Galvan-Uriarte LM, Ruiz-Flores P, et al. Split hand malformation, hypospadias, microphthalmia, distinctive face and short stature in two brothers suggest a new syndrome. Am J Med Genet A. 2005;135:21–27. doi: 10.1002/ajmg.a.30696. [DOI] [PubMed] [Google Scholar]
Associated Data
This section collects any data citations, data availability statements, or supplementary materials included in this article.
Supplementary Materials
Stanford human-mouse conserved coexpression network. Each row contains a link between two Entrez-Gene identifiers.
(0.66 MB TXT)
Affy human-mouse conserved coexpression network. Each row contains a link between two Entrez-Gene identifiers.
(1.89 MB TXT)