Abstract
A number of rapid identification methods have been developed to improve the accuracy for diagnosis of tuberculosis and to speed up the presumptive identification of Mycobacterium species. Most of these methods have been validated for a limited group of microorganisms only. Here, Raman spectroscopy was compared to 16S rRNA sequencing for the identification of Mycobacterium tuberculosis complex strains and the most frequently found strains of nontuberculous mycobacteria (NTM). A total of 63 strains, belonging to eight distinct species, were analyzed. The sensitivity of Raman spectroscopy for the identification of Mycobacterium species was 95.2%. All M. tuberculosis strains were correctly identified (7 of 7; 100%), as were 54 of 57 NTM strains (94%). The differentiation between M. tuberculosis and NTM was invariably correct for all strains. Moreover, the reproducibility of Raman spectroscopy was evaluated for killed mycobacteria (by heat and formalin) versus viable mycobacteria. The spectra of the heat-inactivated bacteria showed minimal differences compared to the spectra of viable mycobacteria. Therefore, the identification of mycobacteria appears possible without biosafety level 3 precautions. Raman spectroscopy provides a novel answer to the need for rapid species identification of cultured mycobacteria in a clinical diagnostic setting.
Mycobacteria cause a variety of infections in humans. Classically defined lung tuberculosis (TB) is predominantly caused by M. tuberculosis complex. The number of new cases is estimated at nine million per year worldwide, and the disease causes more than two millions deaths annually (17). In addition, the incidence of pulmonary disease caused by nontuberculous mycobacteria (NTM) appears to be increasing worldwide (1, 6). The clinical features of NTM-derived pulmonary disease are in some cases indistinguishable from those of tuberculosis. Because the treatment and the epidemiology of NTM-derived infections differ significantly from TB caused by M. tuberculosis complex bacteria, the timely and correct identification of causative organisms is mandatory for diagnosis, therapy, and control.
Conventional approaches to the diagnosis of mycobacterial infection rely on tests that are far from optimal. For example, sputum smear microscopy is insensitive, laborious, and time-consuming. Culture is technically complex and time-consuming, has a sensitivity of only 80 to 85%, and is scarcely available in high-prevalence settings. Chest radiography is nonspecific and not widely implemented either. Tuberculin skin testing is imprecise, and the results are often nonspecific (3). In the last decade, a number of rapid diagnostic tests have been developed in an effort to improve the diagnostic accuracy for TB and to speed up presumptive identification. PCR and other molecular amplification techniques are the most prominent among these new tools. Although promising, none are more than adjunctive to the diagnosis of TB, since the sensitivities of these tests vary widely. The most reliable results are found when tests are applied to smear-positive specimens (2, 13). In addition, these tests are specific for the detection of particular microorganisms and not applicable for diagnosing a wide spectrum of causative agents.
Several commercial techniques are now available for species identification of M. tuberculosis complex and NTM. These techniques are fast but expensive and limited to selected, frequently encountered species, as is the case for the reverse line blot assay (e.g., INNO-LiPA Mycobacteria; Innogenetics, Ghent, Belgium; GenoType Mycobacterium CM/AS; Hain Lifesience GmbH, Nehren, Germany), the Amplicor nucleic acid amplification test (Roche Diagnostic Systems, Inc., Branchburg, NJ), and the Gen-Probe Amplified Mycobacterium tuberculosis direct test (Gen-Probe, San Diego, CA) (2).
For more rarely encountered Mycobacterium isolates, DNA sequencing of the 16S rRNA gene is mostly used at mycobacteria reference laboratories. However, at peripheral laboratories the implementation of 16S rRNA gene sequencing in routine practice has many drawbacks, such as high cost, complexity, and the lack of peer-reviewed databases and clear unambiguous interpretations.
In view of these limitations, there is a continuing need for fast, simple alternatives that can be readily applied to cultured bacteria from clinical material, enabling the identification of a wide spectrum of microorganisms.
Vibrational spectroscopies (infrared and Raman spectroscopy) have been developed for the rapid identification of clinically important microorganisms (11). Important features of these methods are the relative ease by which measurements can be performed, the limited amount of sample handling involved, the small amounts of biomass required and the high degree of reproducibility. Fourier transform infrared spectroscopy proved to be a convenient approach for classifying NTM at the species level (15). However, the identification of M. tuberculosis complex has not yet been evaluated.
Raman spectroscopy is an optical method, enabling spectroscopic fingerprints to be obtained from biological samples in a few seconds. These fingerprints represent the molecular composition of a sample and are therefore ideally suited for identification of a microorganism at both the species and the strain level (7, 9, 10).
In general, viable microorganisms are used for identification by Raman spectroscopy. To work with viable M. tuberculosis complex, a biosafety level 3 containment is required. To bypass this specific requirement, various methods to kill mycobacteria have been described in the literature, such as heat and formalin inactivation. However, the effect of the inactivation on the spectroscopic fingerprints of mycobacteria has not been reported previously.
Here we present the results of the first study on the use of Raman spectroscopy for the identification of M. tuberculosis complex and the most frequently encountered NTM species.
The aim of the present study was (i) to evaluate the reproducibility of the Raman spectroscopy for killed mycobacteria versus viable mycobacteria and (ii) to compare the performance of this method to identification on the basis of 16S rRNA sequencing.
MATERIALS AND METHODS
Strains.
In a pilot study, a set of 12 strains representing six different, frequently encountered NTM species was used to evaluate the effect of two inactivation methods on species discrimination and spectroscopic reproducibility. The set included M. avium, M. chelonae, M. gordonae, M. xenopi, M. kansasii, and M. malmoense. Of each species two different strains were included. In this pilot study only NTM requiring biosafety level 2 precautions were used.
In the subsequent identification study a collection of 63 Mycobacterium strains, comprising eight different Mycobacterium species, was tested: M. tuberculosis (7), M. avium (9), M. chelonae (4), M. gordonae (5), M. xenopi (6), M. kansasii (9), M. malmoense (10), and M. lentiflavum (13). These strains represent a variety of the NTM species most frequently isolated from humans in The Netherlands, as well as M. tuberculosis. Furthermore, 13 M. lentiflavum strains that were recently isolated from patients in Zambia were included (4). All strains were identified to the species level by 16S rRNA gene sequencing and reverse line blot assay (INNO-LiPA Mycobacterium system; Immunogenetics, Ghent, Belgium) (8). M. lentiflavum was identified at the species level by 16S rRNA gene sequencing only. Cultures were stored at −80°C in a 10% glycerol containing medium until use.
As a reference method for identification we used the 16S rRNA sequence. This method has proven to be very useful for identification and taxonomy of mycobacteria (8) and is applied in many tuberculosis reference laboratories (5, 16). In recent years, several new Mycobacterium species have been identified by 16S rRNA sequencing that could not have been identified by conventional methods. In the recently published new diagnostic criteria for nontuberculous mycobacterial diseases by the American Thoracic Society, 16S rRNA sequencing of mycobacteria is one of the recommended methods for identification (6). Therefore, this method was also used as the gold standard in the present study.
Culture.
A loop (1 μl) of biomass was taken from a Mycobacterium culture on Middlebrook 7H10 agar or Löwenstein-Jensen medium and suspended in a mycobacterium growth indicator tube (MGIT; Becton-Dickinson Microbiology Systems, Cockeysville, MD). The vials were incubated in a semi-automated incubation system (Bactec MGIT 960 system). This system continuously measures the oxygen levels in the culture vials, and a change in the oxygen concentration over a preset threshold is an indication of bacterial growth. Vials positive for microbial growth were indicated by the incubation system.
Inactivation methods.
In the pilot study, two inactivation methods for mycobacteria (heating at 80°C for 20 min and suspension in 10% formalin for at least 1 h) were compared to the direct application of Raman spectroscopy to viable mycobacteria. Positive cultures (all in 7 ml of MGIT medium) of all 12 strains used in this part of the study were centrifuged for 15 min at 3,660 × g, and the sediment was divided into three equal portions. One-third of the sediment was suspended in 1.0 ml of normal saline and stored at 4°C (in case of viable mycobacteria); one-third was suspended in 1 ml of 10% formalin and stored at 4°C; and the find one-third was suspended in 1 ml of normal saline, heated for 20 min at 80°C, and thereafter stored at 4°C. To check whether the bacteria had truly been inactivated, 500 μl of the heated and formalin-inactivated suspensions was inoculated in an MGIT culture tube and incubated at 37°C for 12 weeks.
In the identification study, all Mycobacterium cultures were heat killed, and Raman measurements were performed directly or after storage at 4°C for less than 2 days.
Raman spectroscopy.
Before Raman measurements were performed, the samples were washed three times with aquadest (prepared in-house). The sediment was suspended in 10 μl of aquadest, and 4 μl was transferred to a fused silica glass slide and air dried, resulting in small pellets of biomass.
Raman spectra were collected by using a model 2500 High-Performance Raman Module (River Diagnostics BV, Rotterdam, The Netherlands), coupled to a custom-built inverted microscope stage, with an automated XY-stage (River Diagnostics) and operated using RiverICon software, version 1.63 (River Diagnostics). The microscope contained a custom-designed microscope objective with a numerical aperture of 0.7, optimized for Raman experiments in the 750- to 1,000-nm wavelength region, which focused laser light emitted by the 2500 High-Performance Raman Module in the samples on the fused silica slide. The objective also collected Raman scattered light from the samples. Samples were excited using laser light from a 785-nm diode laser (Sacher Lasertechnik, Marburg, Germany), delivering approximately 150 mW to the sample. The spectrometer was calibrated according to the manufacturer's guidelines.
Automated data collection and signal pretreatment was performed by using the RiverICon software, requiring approximately 1 min per sample. Pretreatment consisted of correction for the signal contribution of the fused silica substrate and scaling of all spectra using the extended multiplicative signal correction approach described by Martens and Stark (12). Briefly, all spectra were fitted to a representative Mycobacterium reference spectrum using a seventh-order polynomial to correct for various spectral backgrounds.
Identification and hierarchical cluster analysis (HCA).
The similarity between samples was calculated by using the squared Pearson correlation coefficient (R2) between the representative spectra and then multiplied by 100 to be expressed as percentages (14).
To evaluate the possibilities for species identification, a leave-one-out approach was used. In this approach, the R2 of a sample to all other measured samples was calculated. The predicted species of a sample was assumed to be identical to the species of the sample with which the highest correlation occurred. This procedure was repeated for all measured samples, and a cross-table of the original and predicted species was prepared. HCA of spectra was performed by using the pairwise similarity matrix as the distance matrix in combination with Ward's cluster algorithm.
Reproducibility of Raman spectroscopic measurements.
In the pilot study all strains were cultured three times. The similarity between the spectra obtained from these replicates was used to evaluate the reproducibility of the Raman procedure compared to the interspecies similarity. Ideally, the intrastrain similarity is smaller than the intraspecies similarity. To determine the intrastrain Raman reproducibility, we used the spectra obtained from the three parallel cultures of one isolate. First, the pairwise correlation coefficients between these three spectra were calculated (between spectra 1 and 2, between spectra 1 and 3, and between spectra 2 and 3). The mean of these three correlation coefficients is a measure of the intrastrain reproducibility.
To determine the interspecies similarity, we calculated the mean spectrum of the first two isolates belonging to the same species. Then, the pairwise correlation coefficients between this spectrum and the spectra of the other isolates in the pilot study were calculated. The mean value of these correlation coefficients is a measure for the similarity between the first species and all other species present in the study.
Data analysis.
All data analysis algorithms were programmed by using MATLAB version 7.1 (The Mathworks, Natick, MA) and the PLS toolbox 2.0 (Eigenvector Research, Inc., Manson, WA). To compare the intrastrain and interspecies similarities, an unpaired Student t test was used. A P value of <0.05 was considered significant.
RESULTS
Pilot study. (i) Comparison of Raman spectroscopy spectra for inactivated and viable mycobacteria.
For biosafety reasons, the inactivation procedures were validated prior to further experiments. None of the heat-killed or formalin-inactivated Mycobacterium suspensions revealed growth in a liquid culture after incubation for 12 weeks.
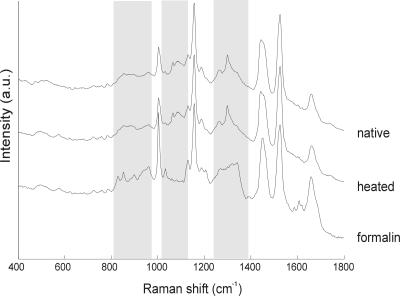
As a typical example, the Raman spectra of a M. kansasii isolate after inactivation by formalin or heating in comparison to the procedure without inactivation are shown in Fig. 1. No significant changes in the Raman spectra were seen after inactivation by heating, whereas formalin inactivation had a major influence on the Raman spectra.
FIG. 1.
Raman spectra of M. kansasii after inactivation with formalin and heating in comparison to the procedure without inactivation. Shaded areas indicate spectral region in which significant effects of formalin inactivation can be observed. a.u., arbitrary units.
In general, the Raman spectra from the formalin-inactivated samples were significantly different from those of the viable samples. There were some samples of which the formalin treatment did not induce major changes in the Raman spectra (data not shown). As the most robust approach, heat inactivation was selected as the method of choice for an evaluation of species identification capabilities of Raman spectroscopy.
(ii) Classification of heat-killed and viable mycobacteria.
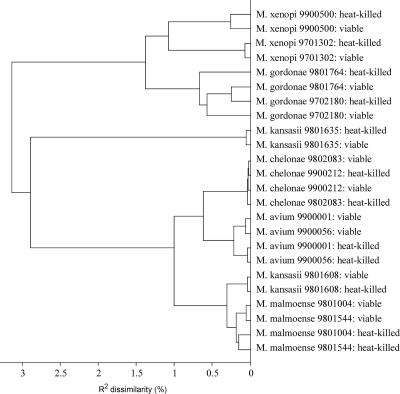
An HCA of the spectra obtained from the isolates used in the pilot study is shown in Fig. 2. This figure represents spectra obtained from both viable and heat-killed mycobacteria. It was possible to obtain good discrimination between the different species used in the pilot study. For all isolates, spectra obtained from viable and heat-killed samples showed few dissimilarities, indicating that the overall classification is not influenced by the pretreatment.
FIG. 2.
Dendrogram of HCA of Raman spectra of the isolates used in the pilot study. Numbers refer to isolates of the collection of the national tuberculosis reference laboratory at the National Institute for Public Health and the Environment.
(iii) Reproducibility.
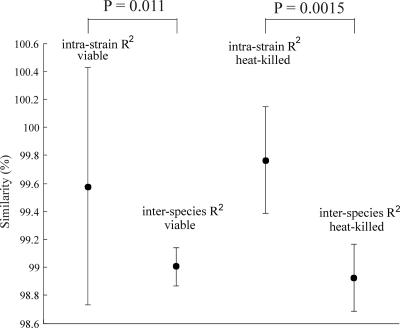
In Fig. 3 the mean intrastrain similarity between replicate cultures of one isolate and the mean interspecies similarity between isolates of different species are given for both viable and heat-killed mycobacteria. To obtain a reliable discrimination between the different species, the intrastrain similarity should preferably be as high as possible, whereas the interspecies similarity should be much lower.
FIG. 3.
Average intrastrain and interspecies similarities between spectra obtained from six native and heat-killed Mycobacterium species. The error bars show the 95% confidence intervals.
For all isolates the intrastrain similarity was significantly higher than the interspecies similarity with a P value of 0.011 when only the viable samples were included and a P value of 0.0015 for the heat-killed samples.
Identification study. (i) Raman spectra of mycobacteria.
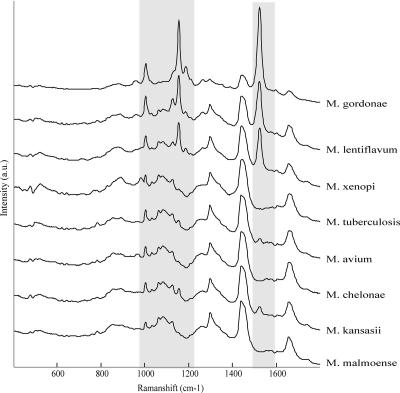
Representative Raman spectra for the eight Mycobacterium species used in the identification study are shown in Fig. 4. The main differences were found in the intensity of the peaks at 1,150 and 1,520 cm−1, due to carotenoids. Intense peaks were found for M. gordonae, M. xenopi, and M. lentiflavum due to pigmentation of these species.
FIG. 4.
Representative Raman spectra from the eight Mycobacterium species used in the identification study. a.u., arbitrary units.
(ii) Classification of mycobacteria based on Raman spectroscopy.
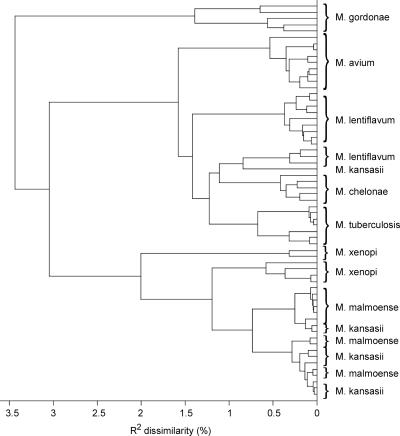
Figure 5 shows the dendrogram resulting from HCA performed on the Raman spectra in the identification set. The M. tuberculosis, M. gordonae, M. avium, and M. chelonae isolates formed separate species-specific clusters. For both M. lentiflavum and M. xenopi, two clusters were found. The spectra of M. malmoense and M. kansasii overlap, but subclusters on the species level can be found.
FIG. 5.
Dendrogram resulting from hierarchical cluster analysis of Raman spectra of the isolates used in the identification.
(iii) Identification.
For species identification, the R2 value was calculated for each isolate spectrum with every other isolate spectrum in the data set. Each isolate to be classified was matched to the isolate in the data set with the highest R2 value. The species identity of the isolate with which the highest R2 occurred determined the species of the tested isolate. The species identification obtained by 16S rRNA gene sequencing was used as the gold standard. This leave-one-out approach simulates the situation in a diagnostic setting where a new measurement is compared to an existing database.
The overall sensitivity of this model was 95.2% (60 of 63 strains, see Table 1 for more details). The differentiation between M. tuberculosis and NTM was correct for all strains. Within the group of NTM isolates, three strains were misidentified: M. xenopi was misidentified as M. malmoense, M. kansasii was misidentified as M. lentiflavum, and M. gordonae was misidentified as M. lentiflavum.
TABLE 1.
Classification of Mycobacterium species by 16S rRNA sequencing and Raman spectroscopy
| Strain detected by 16S rRNA sequencing | No. of strains (%) detected by Raman spectroscopya
|
||||||||
|---|---|---|---|---|---|---|---|---|---|
| M. tuberculosis | M. avium | M. chelonae | M. gordonae | M. kansasii | M. malmoense | M. xenopi | M. lentiflavum | Total | |
| M. tuberculosis | 7 (100) | 7 | |||||||
| M. avium | 9 (100) | 9 | |||||||
| M. chelonae | 4 (100) | 4 | |||||||
| M. gordonae | 4 (80) | 1 (20) | 5 | ||||||
| M. kansasii | 8 (88.9) | 1 (11.1) | 9 | ||||||
| M. malmoense | 10 (100) | 10 | |||||||
| M. xenopi | 1 (16.7) | 5 (83.3) | 6 | ||||||
| M. lentiflavum | 13 (100) | 13 | |||||||
| Total | 7 | 9 | 4 | 4 | 8 | 11 | 5 | 15 | 63 |
The diagonal shows the number of strains predicted as the correct species (percentages of prediction are presented in parentheses). Numbers out of the diagonal represent misclassified strains.
DISCUSSION
Our Raman measurements indicate that efficient discrimination between Mycobacterium species can be made. Isolates belonging to a single species were grouped correctly into different clusters, corresponding to M. tuberculosis, the most relevant clinical species of NTM, and M. lentiflavum. Overall, correct species identification was achieved in 95.2% of the samples within 3 h of a positive signal of the automated culture system. The differentiation between M. tuberculosis and NTM was 100% accurate. Since the treatment of NTM disease differs significantly from the treatment of TB, both the rapidity and the accuracy of this new assay are important assets.
The spectra of the strains inactivated by heat killing showed minimal differences compared to the spectra of viable mycobacteria. Therefore, identification of mycobacteria was possible without biosafety level 3 precautions during Raman measurements.
For 60 of the 63 Mycobacterium strains analyzed, Raman spectroscopic identification corresponded to the molecular identification test. None of the three misidentifications can currently be explained. We suggest that although the DNA identification methods grouped these bacteria within single species, there still are considerable phenotypic differences between strains in a single species. More detailed DNA sequencing of bacteria subgrouped by Raman may confirm this hypothesis. Further Raman studies with Mycobacterium isolates may reveal the accuracy of the method in discriminating more species. An extended spectral database containing more spectra of other M. tuberculosis complex and NTM strains with a larger number of isolates per species has to be established, as was already performed for other microorganisms (7, 10, 11). In addition, in our study only seven M. tuberculosis strains were analyzed. The Raman spectroscopy correctly classified all strains, but larger studies are necessary to confirm and extend these results. Future research will be based on extending the number of strains in the reference database.
Fourier-transform infrared microspectroscopy was successfully used recently to differentiate NTM at the species level (15). To our knowledge, however, our data prove for the first time that Raman spectroscopy can be used for the identification of mycobacteria, including M. tuberculosis complex. In addition to enabling rapid identification, vibrational spectroscopic techniques require virtually no sample handling or consumables and are, therefore, very cost-effective. This is in sharp contrast to other rapid identification techniques. Although regarded as the gold standard, 16S rRNA sequencing is not appropriate for routine analysis due to its complexity and high costs.
We conclude that Raman spectroscopy holds much promise as a rapid, accurate, and easy-to-use alternative for the identification of clinically relevant Mycobacterium species.
Footnotes
Published ahead of print on 3 January 2008.
REFERENCES
- 1.American Thoracic Society. 1997. Diagnosis and treatment of disease caused by nontuberculous mycobacteria. Am. J. Respir. Crit. Care Med. 156S1-S25. [DOI] [PubMed] [Google Scholar]
- 2.American Thoracic Society. 1997. Rapid diagnostic tests for tuberculosis: what is the appropriate use? Am. J. Respir. Crit. Care Med. 1551804-1814. [DOI] [PubMed] [Google Scholar]
- 3.American Thoracic Society and Centers for Disease Control and Prevention. 2000. Diagnostic standards and classification of tuberculosis in adults and children. Am. J. Respir. Crit. Care Med. 1611376-1395. [DOI] [PubMed] [Google Scholar]
- 4.Buijtels, P. C., P. L. Petit, H. A. Verbrugh, A. van Belkum, and D. van Soolingen. 2005. Isolation of nontuberculous mycobacteria in Zambia: eight case reports. J. Clin. Microbiol. 436020-6026. [DOI] [PMC free article] [PubMed] [Google Scholar]
- 5.Edwards, U., T. Rogall, H. Blocker, M. Emde, and E. C. Bottger. 1989. Isolation and direct complete nucleotide determination of entire genes: characterization of a gene coding for 16S rRNA. Nucleic Acids Res. 177843-7853. [DOI] [PMC free article] [PubMed] [Google Scholar]
- 6.Griffith, D. E., T. Aksamit, B. A. Brown-Elliott, A. Catanzaro, C. Daley, F. Gordin, S. M. Holland, R. Horsburgh, G. Huitt, M. F. Iademarco, M. Iseman, K. Olivier, S. Ruoss, C. F. von Reyn, R. J. Wallace, Jr., and K. Winthrop. 2007. An official ATS/IDSA statement: diagnosis, treatment, and prevention of nontuberculous mycobacterial diseases. Am. J. Respir. Crit. Care Med. 175367-416. [DOI] [PubMed] [Google Scholar]
- 7.Ibelings, M. S., K. Maquelin, H. P. Endtz, H. A. Bruining, and G. J. Puppels. 2005. Rapid identification of Candida spp. in peritonitis patients by Raman spectroscopy. Clin. Microbiol. Infect. 11353-358. [DOI] [PubMed] [Google Scholar]
- 8.Kirschner, P., and E. C. Bottger. 1998. Species identification of mycobacteria using rDNA sequencing. Methods Mol. Biol. 101349-361. [DOI] [PubMed] [Google Scholar]
- 9.Maquelin, K., L. Dijkshoorn, T. J. van der Reijden, and G. J. Puppels. 2006. Rapid epidemiological analysis of Acinetobacter strains by Raman spectroscopy. J. Microbiol. Methods 64126-131. [DOI] [PubMed] [Google Scholar]
- 10.Maquelin, K., C. Kirschner, L. P. Choo-Smith, N. A. Ngo-Thi, T. van Vreeswijk, M. Stammler, H. P. Endtz, H. A. Bruining, D. Naumann, and G. J. Puppels. 2003. Prospective study of the performance of vibrational spectroscopies for rapid identification of bacterial and fungal pathogens recovered from blood cultures. J. Clin. Microbiol. 41324-329. [DOI] [PMC free article] [PubMed] [Google Scholar]
- 11.Maquelin, K., C. Kirschner, L. P. Choo-Smith, B. N. van den, H. P. Endtz, D. Naumann, and G. J. Puppels. 2002. Identification of medically relevant microorganisms by vibrational spectroscopy. J. Microbiol. Methods 51255-271. [DOI] [PubMed] [Google Scholar]
- 12.Martens, H., and E. Stark. 1991. Extended multiplicative signal correction and spectral interference subtraction: new preprocessing methods for near infrared spectroscopy. J. Pharm. Biomed. Anal. 9625-635. [DOI] [PubMed] [Google Scholar]
- 13.Nahid, P., M. Pai, and P. C. Hopewell. 2006. Advances in the diagnosis and treatment of tuberculosis. Proc. Am. Thorac. Soc. 3103-110. [DOI] [PMC free article] [PubMed] [Google Scholar]
- 14.Paerson, K. 1909. Determination of the coefficient of correlation. Science 3023-25. [DOI] [PubMed] [Google Scholar]
- 15.Rebuffo-Scheer, C. A., C. Kirschner, M. Staemmler, and D. Naumann. 2007. Rapid species and strain differentiation of non-tubercoulous mycobacteria by Fourier-transform infrared microspectroscopy. J. Microbiol. Methods 68282-290. [DOI] [PubMed] [Google Scholar]
- 16.Rogall, T., J. Wolters, T. Flohr, and E. C. Bottger. 1990. Towards a phylogeny and definition of species at the molecular level within the genus Mycobacterium. Int. J. Syst. Bacteriol. 40323-330. [DOI] [PubMed] [Google Scholar]
- 17.World Health Organization. 2006. Global tuberculosis control: surveillance, planning, financing: WHO report 2006. World Health Organization, Geneva, Switzerland.


