

Abstract
In Alzheimer’s disease increasing evidence attributes synaptic and cognitive deficits to soluble oligomers of amyloid β protein (Aβ), even prior to the accumulation of amyloid plaques, neurofibrillary tangles, and neuronal cell death. Here we show that within 1–2 hours picomolar concentrations of cell-derived, soluble Aβ induce specific alterations in pre- and postsynaptic morphology and connectivity in cultured hippocampal neurons. Clusters of presynaptic vesicle markers decreased in size and number at glutamatergic but not GABAergic terminals. Dendritic spines also decreased in number and became dysmorphic, as spine heads collapsed and/or extended long protrusions. Simultaneous time-lapse imaging of axon-dendrite pairs revealed that shrinking spines sometimes became disconnected from their presynaptic varicosity. Concomitantly, miniature synaptic potentials decreased in amplitude and frequency. Spine changes were prevented by blockers of nAChRs and NMDARs. Washout of Aβ within the first day reversed these spine changes. Further, spine changes reversed spontaneously by two days, because neurons acutely developed resistance to continuous Aβ exposure. Thus, rapid Aβ-induced synapse destabilization may underlie transient behavioral impairments in animal models, and early cognitive deficits in Alzheimer’s patients.
Introduction
Until recently, it was widely believed that Alzheimer’s disease (AD) resulted from extensive accumulation of insoluble, fibrillar forms of amyloid beta (Aβ), a peptide proteolytically derived from the transmembrane domain of the amyloid precursor protein (APP). Such fibrillar forms of Aβ are the principle component of amyloid plaques, and are known to be neurotoxic to cultured cells. Now, however, increasing evidence suggests that the progressive cognitive decline in AD may be caused by soluble, oligomeric forms of Aβ. Furthermore, it is proposed that such deficits, particularly early in the disease, stem not from cell death per se, but rather from damage to synapses (Selkoe, 2006;Tanzi, 2005). Indeed, soluble oligomeric Aβ colocalizes with synapses within one hour in neuronal cultures (Deshpande, et al., 2006;Lacor, et al., 2004).
Most excitatory synapses in the mammalian brain form contacts onto dendritic spines. Alterations in spine number and shape are associated with cognitive deficits in neuropsychiatric disorders and mental retardation syndromes (Blanpied and Ehlers, 2004). Dendritic spine loss has been documented in AD and in animal models, but previous studies associated such spine loss with late stages of the disease when amyloid plaques are present (Baloyannis, et al., 1992;Davidsson and Blennow, 1998;Einstein, et al., 1994;Ferrer and Gullotta, 1990;Moolman, et al., 2004;Probst, et al., 1983;Spires, et al., 2005). However, recent studies in young TG2576 transgenic mice expressing the APP-Swedish mutation observed reduced spine density prior to plaque deposition, suggesting that soluble forms of Aβ might confer synaptotoxic changes (Jacobsen, et al., 2006;Lanz, et al., 2003). This would be consistent with the finding that infusion of oligomeric Aβ into brain induced rapid and transient impairments in cognitive performance in rodents (Cleary, et al., 2005).
Here we explored the hypothesis that soluble, oligomeric Aβ induces morphological changes at synapses. We used cultured rat hippocampal neurons to examine the consequences of exposure to low concentrations of soluble cell-derived Aβ. To focus our studies on established synapses, rather than developing synapses, we cultured neurons for 3 weeks prior to experimental manipulations. We kept concentrations of Aβ below 100pM to better mimic the levels of Aβ to which human AD brains might reasonably be exposed (Bateman, et al., 2006;Pitschke, et al., 1998). In addition, we exclusively used soluble Aβ derived from a CHO cell line (7PA2) that expresses APP carrying the V717F mutation. This cell line secretes high levels of monomeric and small oligomeric Aβ, without larger insoluble aggregates (Walsh, et al., 2002b). Our results indicate that low levels of soluble Aβ rapidly alter dendritic spine morphology and uncouple dendritic spines from their nerve terminals.
RESULTS
Soluble Aβ Affects Excitatory but Not Inhibitory Nerve Terminals
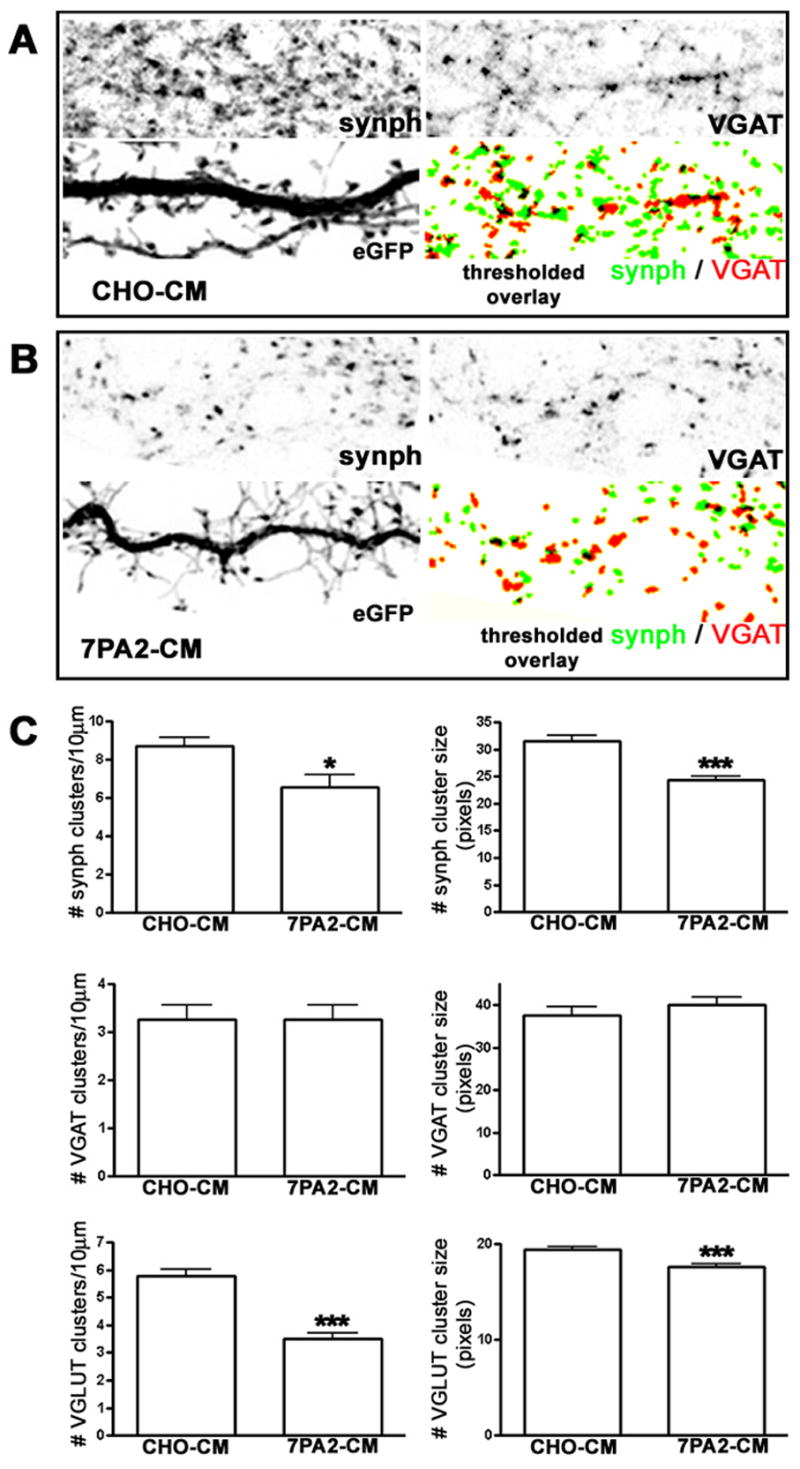
Decreased synapse density, as measured by reduced numbers of puncta for the vesicle marker synaptophysin, is well documented in AD (Masliah, 2000;Selkoe, 2002). To assess whether soluble Aβ might have direct effects on the distribution of presynaptic markers, we incubated three-week old hippocampal cultures with conditioned medium from CHO cells stably expressing the APP V717F mutation (7PA2-CM) containing 80pM Aβ and quantified the size and density of puncta stained for either synaptophysin, to label all nerve terminals, Vesicular Glutamate Transporter (VGLUT), to specifically label excitatory glutamatergic terminals, or Vesicular GABA Transporter (VGAT), to specifically label inhibitory GABAergic terminals. We found that within one hour the size and number of synaptophysin clusters decreased significantly after incubation with 7PA2-CM, as compared to incubation with control medium from untransfected CHO cells (CHO-CM; Fig. 1). Interestingly, glutamatergic but not GABAergic synapses were affected: VGAT clusters were unaltered, but VGLUT clusters showed a nearly 40% decrease in number, and those that remained showed a 10% decrease in area compared to control cultures (Fig. 1). These data indicate that excitatory nerve terminals are selectively vulnerable to rapid changes induced by the Aβ conditioned medium (7PA2-CM). Since dendritic spines are the main postsynaptic sites for excitatory synapses in the mammalian brain, we next investigated whether we could detect a similar drop in their numbers following exposure to 7PA2-CM.
Figure 1.
Rapid Effects of Soluble Amyloid-β on Dendritic Spine Stability and Morphology
Changes in dendritic spine number and morphology were detectable within one hour of incubation with 7PA2-CM (Fig. 2A–F). Spine number was significantly reduced by incubation with 7PA2-CM containing 40pM or 80pM Aβ (Fig. 2), average length of remaining protrusions increased 35%, and spine head width decreased 22–28%. Spine numbers did not decrease with exposure to 7PA2-CM containing 4pM Aβ, but their morphology was significantly affected, with protrusions becoming longer and thinner on average (Fig. 2C, G–I).
Figure 2.

Changes in Spine Number and Morphology are Mediated by Soluble Aβ, not Soluble APP
Because 7PA2-CM might contain soluble forms of APP (sAPP), in addition to various oligomers of Aβ, we incubated neurons with 7PA2-CM that was first immunodepleted using antibodies that recognize either Aβ (monoclonal antibody 82E1; (Qi-Takahara, et al., 2005) or sAPP (monoclonal antibodies 1G7 and 5A3; (Koo and Squazzo, 1994). Effects on spine number and morphology were completely prevented when soluble Aβ was immunodepleted, but not when sAPP was immunodepleted (Fig. S1). Because 82E1 is specific for the amino terminus of Aβ, preincubation with this antibody did not deplete any sAPP from the conditioned medium. In addition, no changes in spine number or shape were observed when hippocampal neurons were incubated with 7PA2-CM derived from cells that were incubated with the γ-secretase inhibitor LY-411,575 (10nM, 16 hr) to block Aβ production (Fig. S2). Together, these results demonstrate a direct and specific involvement of low levels of cell-derived soluble Aβ in the rapid alterations in spine number and morphology.
Aβ-Induced Effects on Dendritic Spine Number and Morphology are Transient
To assess whether the rapid effects on postsynaptic structure represent early stages of neurotoxicity, we incubated rat hippocampal neurons with 7PA2-CM continuously for one or two days. Such prolonged incubations did not induce detectable neuronal cell death (data not shown). After one day morphological changes in dendrites were still present (see below, Fig. 4). However, to our surprise, by two days dendritic spines spontaneously recovered their shape and partially their number (Fig. 3). To exclude a possible reduction in Aβ efficacy or concentration we incubated “virgin” hippocampal neurons, which had never seen 7PA2-CM, for two hours with medium from neurons that had been incubated with 7PA2-CM for 2 days. Such “neuronally conditioned” 7PA2-CM was still able to affect the stability and morphology of dendritic spines (Fig. 3), indicating that Aβ efficacy was preserved.
Figure 4.
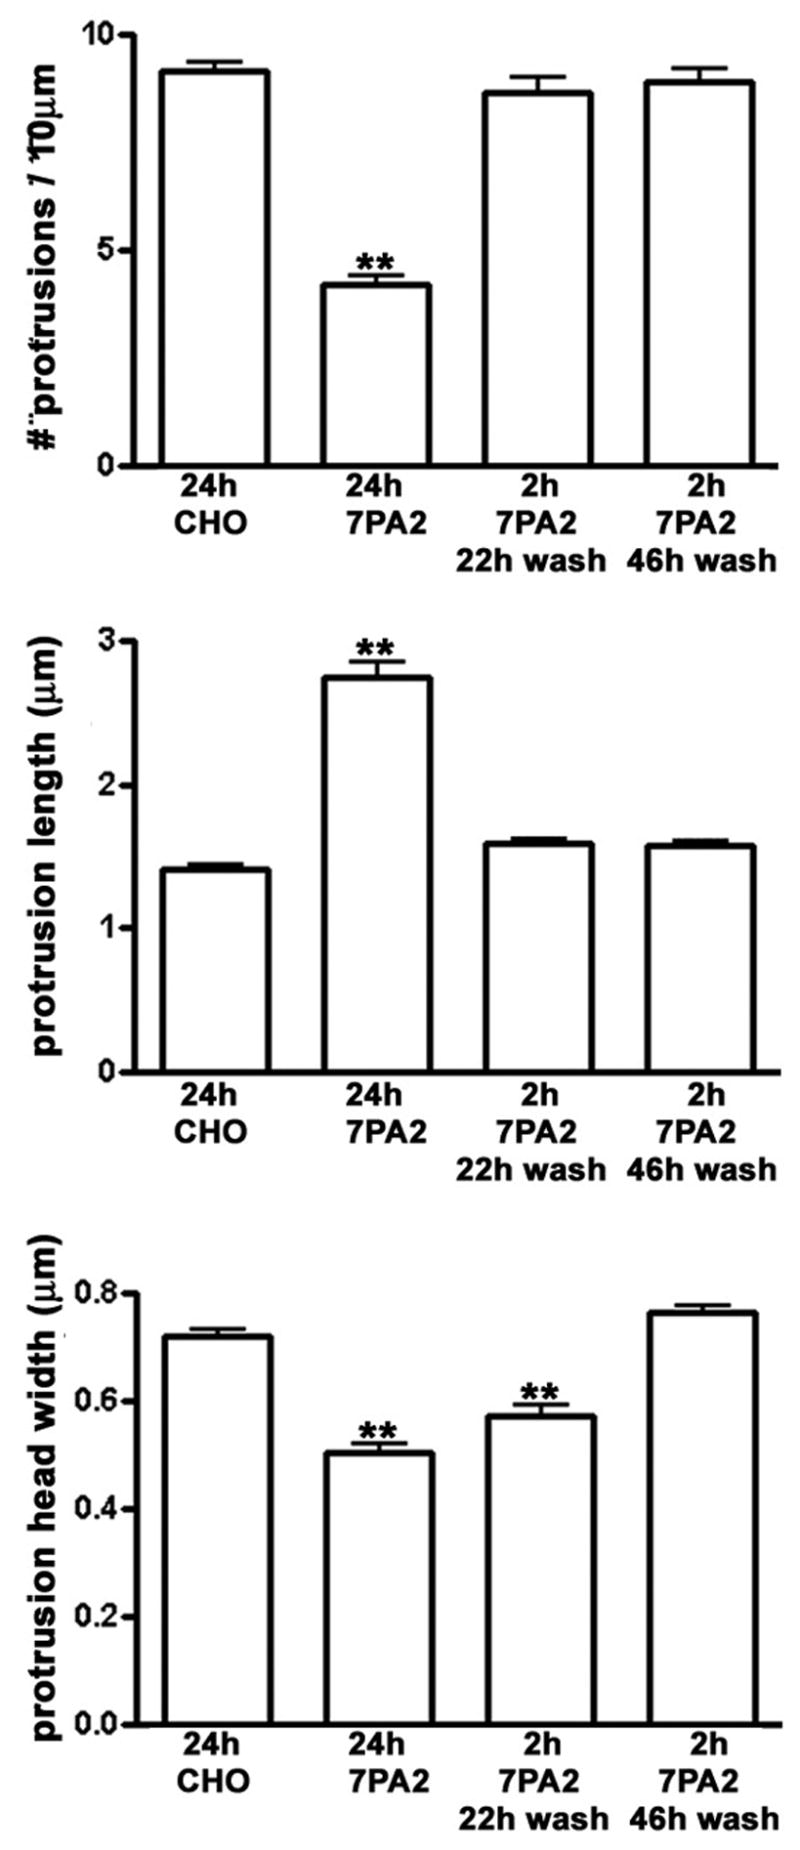
Figure 3.
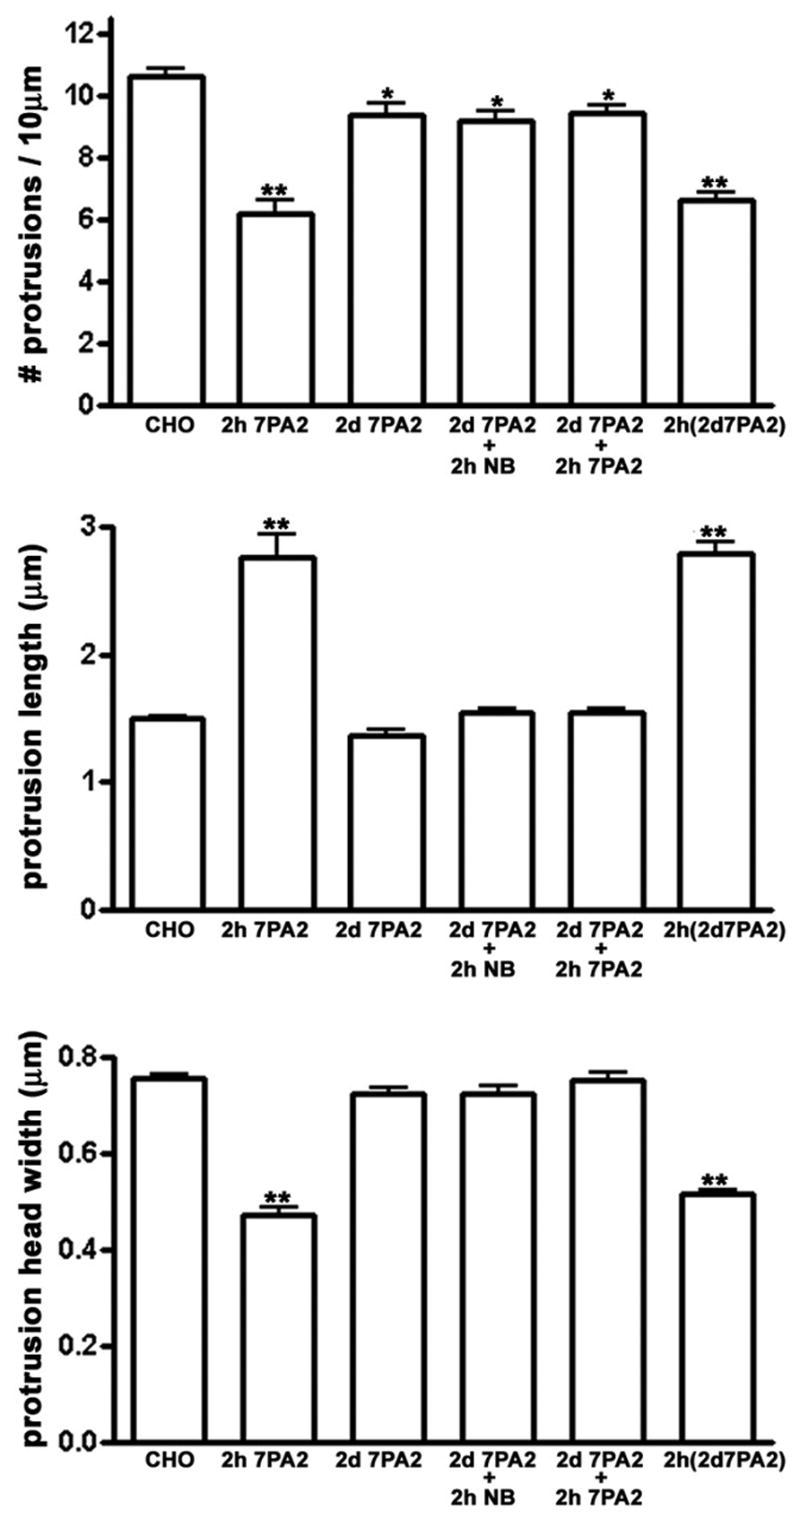
An alternative explanation for spontaneous morphological recovery might be that neurons developed resistance to soluble Aβ. Indeed, we detected no effect on spine morphology or number when we re-applied fresh 7PA2-CM for 2 hours to neurons that had already been exposed continuously for 2 days to 7PA2-CM and had spontaneously recovered their normal dendrite morphology (Fig. 3). These results suggest that over two days cultured neurons spontaneously reverse the Aβ-induced morphological changes and develop resistance to a second brief exposure to Aβ.
Reversal of Spine Changes by Removal of Aβ
Although changes in spine number and morphology reversed spontaneously within two days, we asked whether such changes could be reversed more quickly by removal of Aβ. Cultures were incubated in the presence of 80 pM 7PA2-CM for 2 hr, then the medium was replaced by exchanging half the medium 5 times with regular neuronal culture medium and incubation continued for one or two days. Under these conditions we observed that spine number and length returned to control levels one day later (Fig. 4); spine head width was significantly greater, but still less than control values. Within two days of washout all three parameters were indistinguishable from control.
Time-lapse Imaging of Aβ Effects on Individual Dendritic Spines
The rapid nature of Aβ-induced effects enabled us to use time-lapse imaging to monitor structural changes and assess turnover at individual dendritic spines in living neurons. A stack of images was acquired in the z-dimension every 4–15 min for 4–48 hr; quantitative analyses were conducted over a period of 10–13 hours after the start of the stimulus. In control neurons new spines appeared at a low rate (0.012 ±0.006 spines/μm/hr), and spines were lost at a slightly lower rate (0.008 ± 0.003 spines/μm/hr), resulting in a small net gain in spine density over 10–13 hours. In 7PA2-CM treated neurons, however, spine loss was greatly accelerated (0.09 ± 0.05 spines/μm/hr) and new spine growth greatly reduced (0.001 ± 0.001 spines/μm/hr), resulting in a large net loss of spines (see Table 1 for these rates expressed as percentages of total spines).
Table 1.
Aβ affects dendritic spine and filopodia turn-over
| CHO CM | 7PA2 CM | |
|---|---|---|
| % new spines | 3.2 ± 1.1 | 0.2 ± 0.2** |
| % spine loss | 1.5 ± 0.5 | 30 ± 5.9** |
| % filopodia outgrowth | 3.4 ± 0.7 | 34 ± 2.9*** |
| filopodia half-life (min) | 4.7 ± 0.7 | 222 ± 30** |
p < 0.01, and
p < 0.001 indicate values significantly different using Student’s t-test. Percentages were calculated over a period of 10.8 ± 4.5 hrs (CHO CM) and 13 ± 4.3 hrs (7PA2 CM). no. of filopodia used to measure filopodia half life: CHO CM=12; 7PA2 CM= 79. no. of dendritic regions used to calculate percentages: CHO CM=8 (no. of cells 6); 7PA2 CM=10 (no. of cells=8).
In control neurons few spines displayed either rapid elongation or overall shrinkage (Fig. 5A1; Supplemental Movie S1) although most exhibited the typical ‘morphing’ behavior of the spine head (Calabrese and Halpain, 2005;Dunaevsky, et al., 1999;Fischer, et al., 1998). In contrast, within 13 hours of incubation with 7PA2-CM, 34% of existing spines elongated into thin filopodial-like protrusions (Table 1). However, another 30% shrunk in size, or disappeared altogether (Table 1). We conclude, therefore, that soluble Aβ induces at least two types of morphological changes in spines, resulting in either spine elongation or spine shortening. Although protrusion elongation and shortening are seemingly opposite structural modifications, they both were accompanied by a reduction in spine head diameter (Fig. 5A2,3). Both effects could be observed on the same dendrite (Fig. 5A2,3; see Supplemental Fig. S3 for additional examples), and occasionally multiple changes occurred sequentially in individual spines, wherein outgrowth was followed later by collapse (Fig. S3B, open arrow). Overall the dendritic protrusions appear to become more dynamic in the 7PA2 treated neurons as compared to control (Supplemental Movies S2 and S3).
Figure 5.
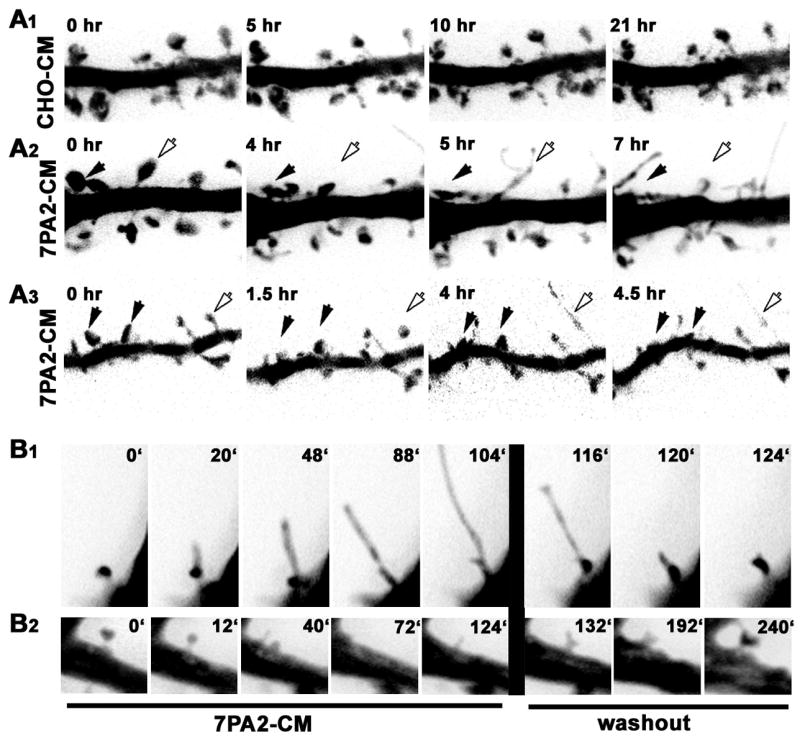
Outgrowth of filopodial-like protrusions occurred infrequently in control neurons at this stage of development. However, on the rare occasions when we observed formation of a filopodial-like protrusion in control neurons, their half-lives on average were much shorter than those induced in response to 7PA2-CM (Table 1). This suggests that the long, filopodial-like protrusions seen in cultures incubated with 7PA2-CM are distinct from the transient filopodia normally seen on developing dendrites (Ziv and Smith, 1996). Time-lapse imaging during washout showed that elongated, filopodial-like protrusions recovered a more normal spine-like morphology (Fig. 5B1), and that collapsed spines recovered at their original locations (Fig. 5B2).
Simultaneous Aβ-Induced Changes in Pre- and Postsynaptic Structures Revealed by Time-lapse
Together, the above observations indicate that both presynaptic and postsynaptic structures undergo rapid morphological changes in response to low concentrations of soluble Aβ. This results in reduced numbers and size of nerve terminals, shrinkage and complete collapse of some spines, and abnormal elongation of other spines. To investigate the relationship among these morphological responses, we performed time-lapse imaging on connected pairs of spines and their nerve terminals. Postsynaptic neurons were labeled with the cell filler eGFP. Presynaptic neurons were labeled with mRFP-synaptophysin, which allowed us to more clearly identify the location of synaptic varicosities than when using a cell filler. Once ‘green’ labeled dendrites having adjacent ’red’ labeled varicosities were identified, cultures were incubated with either control CHO-CM or 7PA2-CM containing 80pM Aβ, and images in each fluorescence channel were collected at intervals of 4–15 min for 5–36 hours.
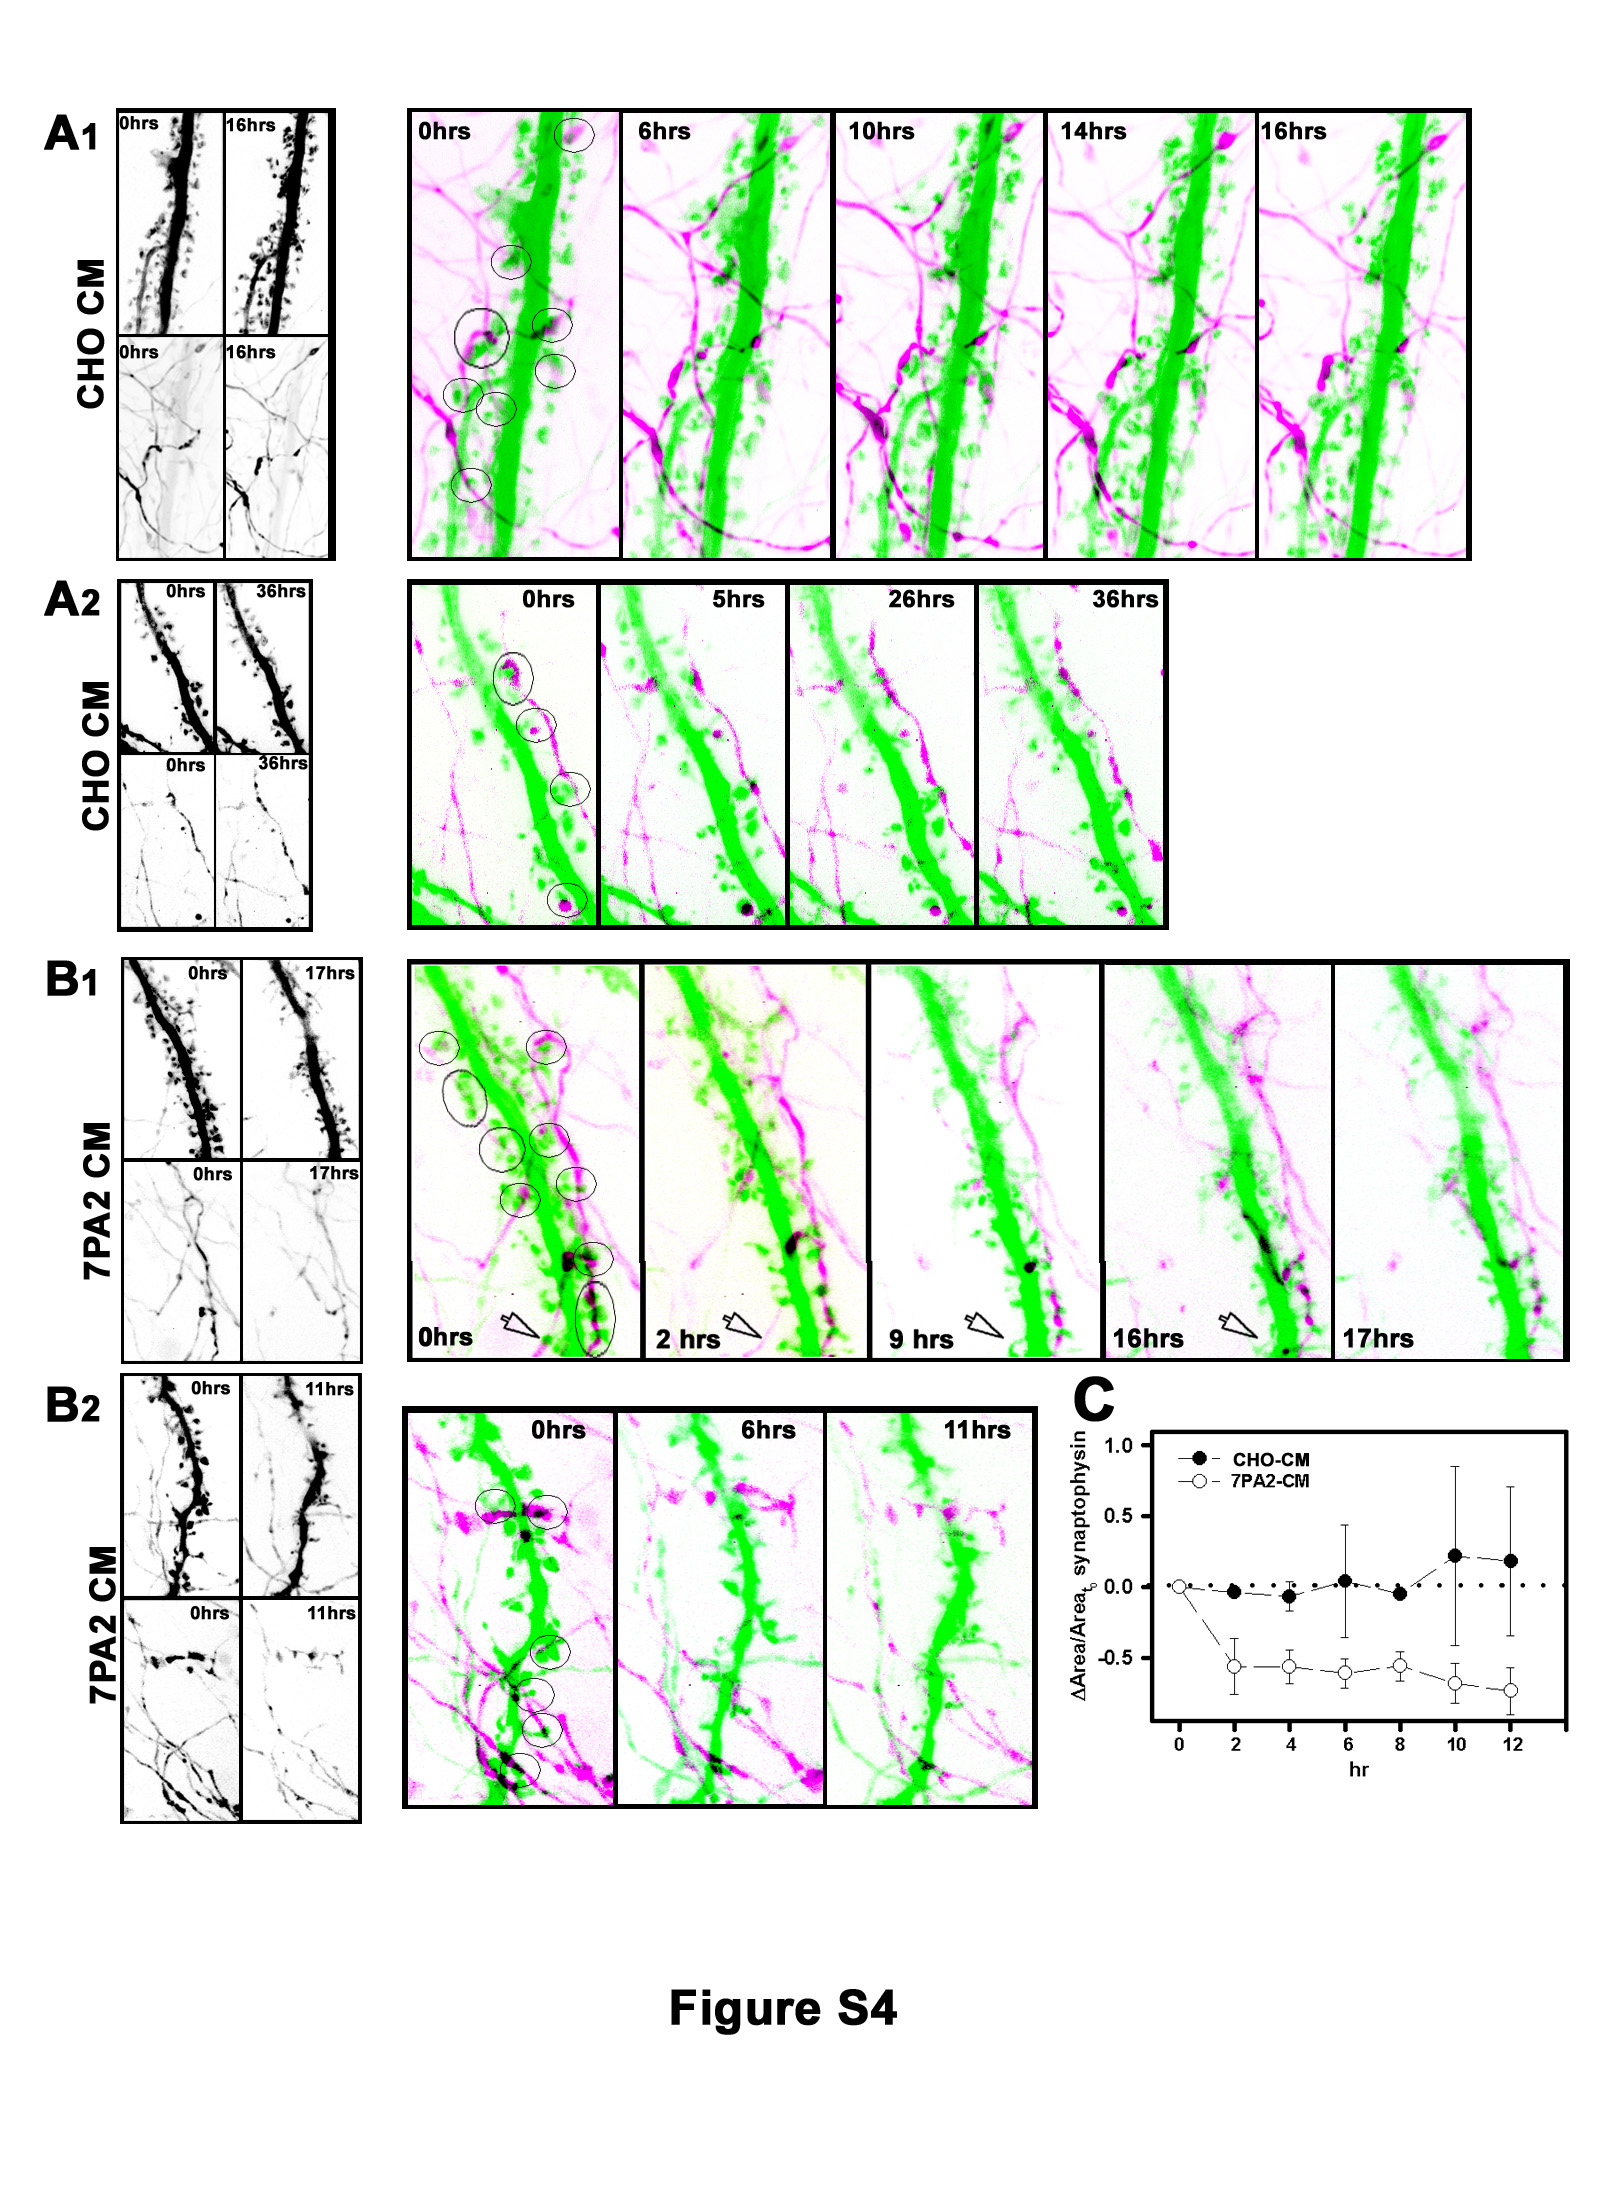
In control cultures incubated with CHO-CM, mRFP-synaptophysin fluorescence in nerve terminals and along axons persisted over many hours (Fig. S4A1,2; Supplemental Movies S4 and S5). Although the fluorescence intensity of individual synaptophysin clusters would sometimes wax and wane over time, and clusters sometimes translocated, we rarely observed a persistent loss of signal under control conditions. In contrast, within 2 hours after adding 7PA2-CM we observed that synaptophysin fluorescence typically began to fade in most regions and sometimes became undetectable (Fig. S4B1,2; Supplemental Movies S6, S7; see Fig. S4C for quantification). These data from living neurons expressing exogenous synaptophysin are consistent with results from fixed specimens stained for endogenous synaptophysin (see Fig. 1).
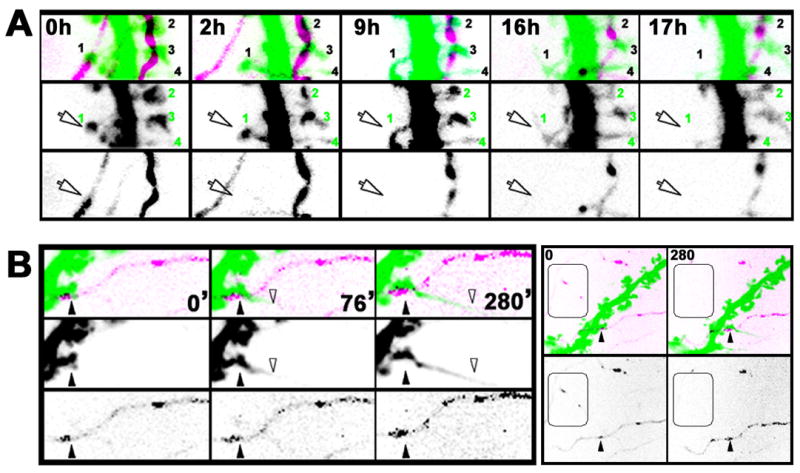
Of the 31 fluorescently labeled spine/nerve terminal pairs we identified in Aβ-treated cultures (111μm total length of dendrites analyzed from 3 postsynaptic neurons), 3 out of 31 spines (10%) were observed to spatially disconnect from their adjacent presynaptic varicosity prior to or concomitant with spine collapse (Fig. 6A, arrow; see also Fig. S5 for additional examples and Supplemental Movies S8, S9, and S10). In three additional pairs we observed either transient spine detachment or it appeared that a spine detached from only one of the two terminals to which it was connected. The remaining spines appeared to remain connected to their presynaptic varicosity during this time frame. Such spines either shrunk in head width only (15 of 31; 48%; Fig. 6A), elongated (6 of 31; 19%; Fig. 6B), or showed no significant change (4 out of 31; 12 %). In contrast, during our recordings of neurons exposed to control CHO-CM (n = 25 spine/nerve terminal pairs from 3 postsynaptic neurons), which were imaged at 10 min intervals for up to 48 hours, we never observed spatial separation of presynaptic varicosities from adjacent spines. These results suggest that a physical uncoupling of synapses may be one consequence of exposure to soluble Aβ.
Figure 6.
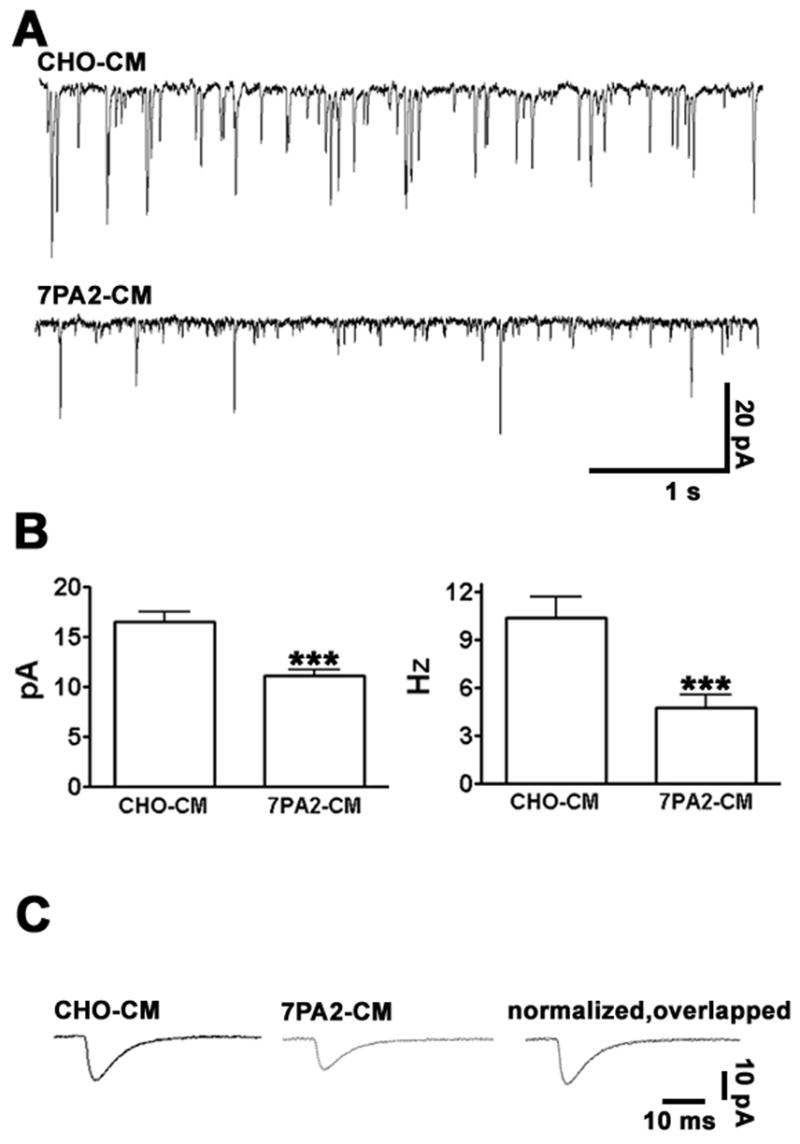
Synaptic Strength is Rapidly Decreased by Soluble Aβ
Given the dramatic effects on synaptic morphology induced by soluble Aβ described above, we next evaluated whether these translated into functional deficits at hippocampal synapses. Miniature excitatory postsynaptic currents (mEPSCs) were recorded 2–3 hours after incubation in the presence of CHO-CM or 7PA2-CM. As predicted from the observed decrease in the numbers of both presynaptic synaptophysin clusters and postsynaptic dendritic spines, we observed that both the frequency and amplitude of mEPSCs was significantly reduced in 7PA2 treated cells (Fig. 7A, B). Despite these decreases, the time constants for excitatory currents were not significantly changed (Fig. 7C), indicating that the properties of the remaining excitatory receptors were unaltered. Together, our data demonstrate that soluble Aβ induces within hours both morphological and functional changes at excitatory synapses.
Figure 7.
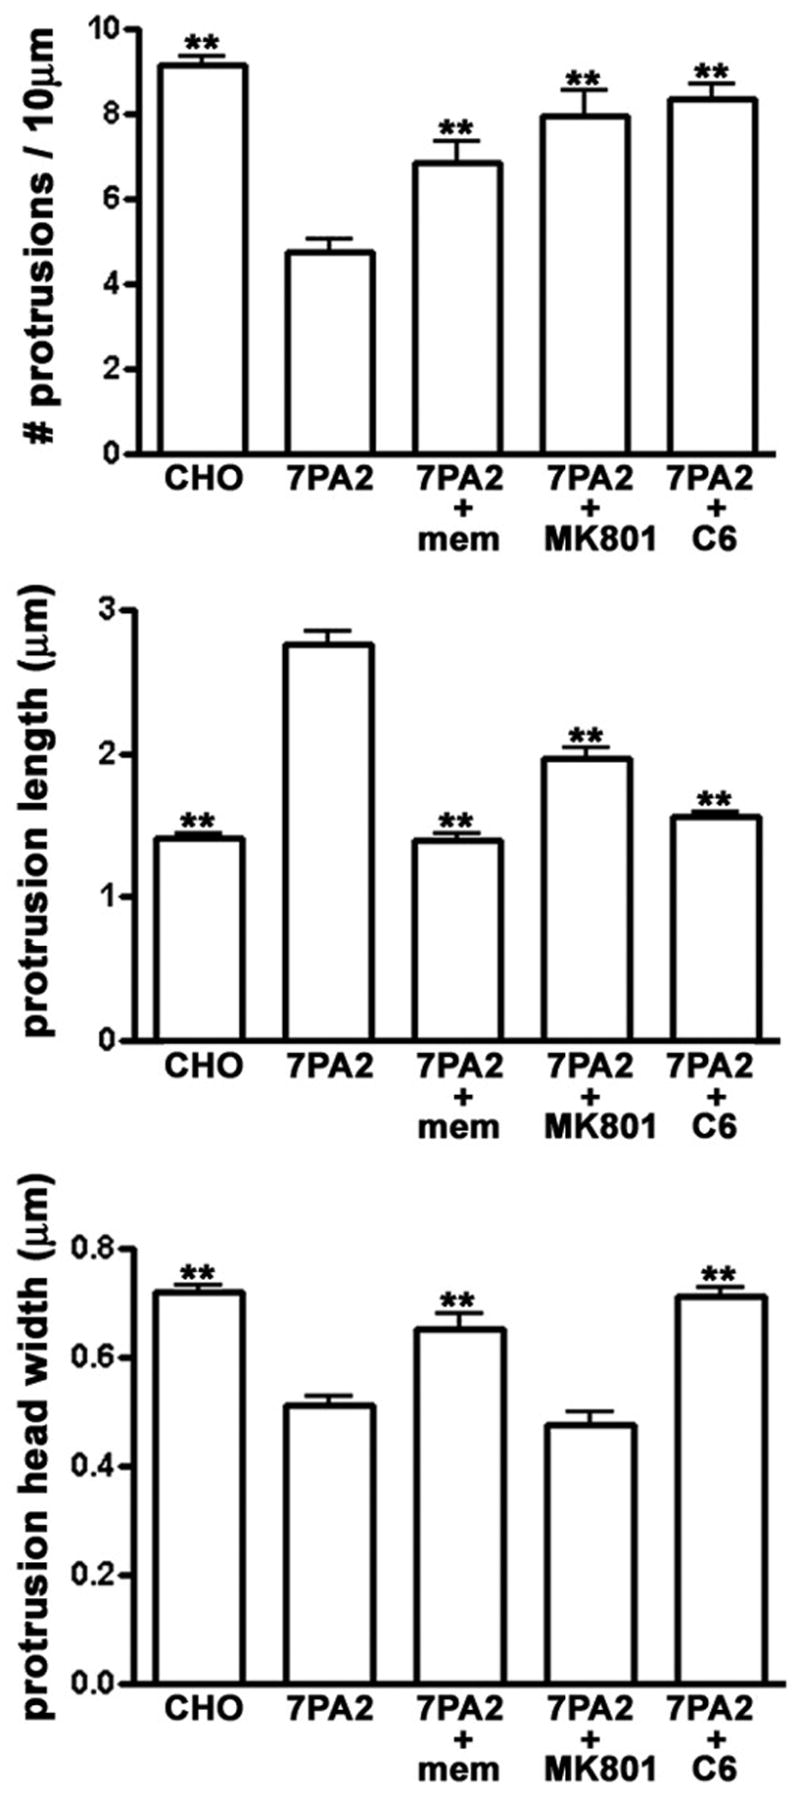
AChR and NMDAR Blockers Attenuate Aβ-Induced Effects on Spine Morphology
Nicotinic acetylcholine receptors (nAchRs) and NMDA receptors (NMDARs) have been implicated in AD pathology, (D’Andrea and Nagele, 2006;Oddo and LaFerla, 2006;Sonkusare, et al., 2005). To test whether these receptors mediate the rapid effects of soluble Aβ on dendritic spines, we incubated hippocampal neurons for 2 hours with 7PA2-CM in the presence or absence of the noncompetitive NMDAR antagonists memantine (1μM) or MK801 (20μM), or the nAChR antagonist hexamethonium (C6; 100 μM). All three compounds significantly attenuated the effects of Aβ on spine morphology (Fig. 8), although, at the concentrations used, only C3 completely prevented changes in all three morphological parameters (spine density, spine length, and spine width).
Figure 8.
Discussion
Two decades of genetic, biochemical, and animal model studies led researchers to formulate the amyloid hypothesis, which states that abnormal accumulation of Aβ is the principal factor responsible for Alzheimer’s disease. More recently, new evidence suggests that soluble forms of Aβ, rather than the fibrillar forms visible as amyloid plaques, hold the key to understanding AD brain pathology (Small and Cappai, 2006; Walsh, et al., 2002b). To date, many studies of molecular mechanisms underlying AD have focused on neuronal cell death as an endpoint, because extensive neuronal cell loss occurs as AD progresses. However, because early AD is now thought to be a disease of the synapses (Selkoe, 2006;Tanzi, 2005), in the present study we focused on synaptic changes elicited by soluble forms of AD. Using cultured hippocampal neurons as a model system, we show that low concentrations of soluble natural Aβ induce extremely rapid changes in synaptic stability, morphology, and physiology. Several aspects of our experimental design and observations are of note.
Firstly, we used medium from genetically engineered CHO cells (7PA2 cells) as a source of Aβ (see Experimental Procedures). These cells were previously shown to secrete all natural derivatives of APP metabolism, including monomers, SDS-stable low-n oligomers, and soluble APP, but no detectable Aβ fibrils (Podlisny, et al., 1995;Walsh, et al., 2002b). Exposure of brain tissue to low concentrations of this medium inhibited the induction of LTP in vivo (Walsh, et al., 2002a) and in hippocampal slices (Townsend, et al., 2006;Wang, et al., 2002), and induced cognitive deficits in vivo (Cleary, et al., 2005). Walsh et al. (2002a) and Cleary et al. (2005) presented evidence that low-n oligomers of Aβ, not monomers or soluble fragments of APP, are responsible for the observed deficits on LTP and behavior. Townsend et al (2006) demonstrated that trimers of soluble Aβ were more potent than dimers or tetramers at inhibiting LTP, although all three forms had detectable effects. As in these previous studies, we show here that Aβ, not sAPP, is responsible for synaptic alterations induced by 7PA2-CM. We have not identified the precise form of Aβ responsible for these effects; however, we observed that the effective Aβ concentrations were similar to those typically found in the cerebral spinal fluid of AD patients (Bateman, et al., 2006;Mehta, et al., 2000;Motter, et al., 1995;Pitschke, et al., 1998).
Secondly, we found that clusters of the presynaptic vesicle protein synaptophysin were reduced in size and number in response to Aβ. The glutamatergic marker VGLUT was similarly affected, but the GABAergic marker VGAT was not, suggesting that Aβ exposure might alter the ratio of excitatory to inhibitory synaptic drive in hippocampal neurons, thereby shifting the circuits to a more quiescent state. Numerous studies have documented reductions in presynaptic vesicle clusters in AD brains (Ishibashi, et al., 2006;Masliah, 2000;Sze, et al., 1997), and a recent study suggested that cholinergic and glutamatergic neurons are more affected than GABAergic neurons in AD transgenic mice (Bell, et al., 2006). The differential effect of soluble Aβ we report here on VGLUT versus VGAT is consistent with the idea the GABAergic terminals are selectively spared in AD.
Thirdly, the time course of the Aβ-induced changes was very rapid. Within 1–2 hours we detected reductions in the numbers and size of clusters of presynaptic markers and in the numbers and size of postsynaptic spines. The strength of excitatory synaptic potentials was reduced within 2–3 hours. This time frame approximates the rapid LTP inhibition and cognitive disruption induced by 7PA2-CM. Inhibition of LTP occurred within 1 hour of administering 7PA2-CM in vivo or in slices (Townsend, et al., 2006;Walsh, et al., 2002a;Wang, et al., 2002); and impairment of cognition occurred within 1 day of administering 7PA2-CM in vivo (Cleary, et al., 2005). Thus, the Aβ-induced alterations in synaptic morphology described here could potentially represent a cellular substrate for impaired synaptic plasticity.
Although our experiments were carried out in dissociated neuronal cultures, it is apparent that similar effects on synaptic morphology occur in more complex neural tissue. Using multiphoton microscopy in organotypic slices, Shrestha et al. (2006) reported spine loss and elongation after 7 days of exposure to high concentrations of synthetic Aβ, and Hsieh et al. (2006), reported spine shrinkage and AMPA receptor loss after 3 days of APP overexpression. Our experiments indicate that Aβ potentially alters synaptic morphology in vivo even more rapidly.
Some of the spine changes we observe in response to a natural form of Aβ are similar to those seen using high concentrations of soluble, synthetic Aβ of a type called ADDLs (Lacor, et al., 2007). It is interesting that the synthetic ADDLs and our cell-derived Aβ both induced rapid synaptic changes, since the nature of the Aβ oligomers are thought to be different in these two preparations. ADDLs are composed mainly of larger Aβ aggregates of 50–100 kDa (Lacor, et al., 2007), while the major species contained in 7PA2-CM are dimers and trimers of Aβ (Mr = 8–12 kDa), with lower amounts of higher-order multimers (Cleary, et al., 2005). This suggests that multiple species of Aβ oligomers might be synaptotoxic. On the other hand, it is worth noting that ADDLs were applied at Aβ concentrations four orders of magnitude higher than what we used in this study for natural Aβ. It therefore seems possible that tiny amounts of low-order oligomers of Aβ within the ADDL preparation might contribute to the effects of ADDLs.
The rapid time course of changes we detected enabled us to apply time-lapse imaging methods to investigate the effects of Aβ at individual synapses. Furthermore, we simultaneously imaged both pre- and postsynaptic structures at single synapses. Recordings of individual synapses revealed that Aβ induced some spines to elongate and other spines to shrink, even along the same dendrite, indicating that these seemingly opposite morphological effects do not segregate according to cell subtype. Mechanisms underlying these variable effects remain to be determined.
We observed that collapsing spines sometimes became spatially uncoupled from their presynaptic varicosity prior to shrinkage, suggesting that at some synapses Aβ may destabilize the adhesion between pre- and postsynaptic elements. To our knowledge, this is the first experimental observation of an apparent spatial uncoupling, although it could turn out to be common in disorders involving synapse loss. Interestingly, we so far never observed synaptic uncoupling at spines that elongated. Perhaps the degree to which synapse adhesion is disrupted determines the fate of the spine; i.e., spines that remain connected to their presynaptic terminal either are stable or adopt an elongated morphology, while spines that disconnect become more vulnerable to collapse. Synapse uncoupling is probably not a prerequisite for spine collapse per se, since in other studies we observed a dramatic decrease in spine numbers with no concomitant loss of synaptophysin clusters (Calabrese and Halpain, 2005).
A fourth interesting aspect of this study concerns reversibility. The effects on spine morphology induced by a 2 hour incubation with soluble Aβ could be washed out by replacement with fresh medium. Therefore, if similar Aβ-dependent damage to synapses occurs during AD, then strategies to remove soluble Aβ could prove effective in attenuating this form of synaptotoxicity. Of further significance is the observation that the effects on spine number and shape spontaneously reversed within two days. Cognitive disruption in rats given ventricular injections of 7PA2-CM was similarly transient (Cleary, et al., 2005). In our cell culture model we discovered that Aβ effects on spines were transient not because Aβ lost its efficacy, but because the cultures developed resistance to its effects. If this observation applies to AD, then neurons must eventually either lose their resistance or succumb to rising Aβ concentrations, and thereby undergo more permanent injury. Indeed, we found that continuous incubation in the presence of 7PA2 medium for 10 days induced extensive spine loss, indicating that in our system the neurons’ resistance to Aβ is only temporary (data not shown). Nevertheless, enhancement of an intrinsic resistance mechanism could represent a novel strategy for therapies to combat early AD.
Two strategies already used clinically to enhance cognitive function in AD involve partial blockade of NMDA receptors using memantine (Rogawski and Wenk, 2003) or enhancement of cholinergic transmission using acetylcholinesterase inhibitors (Lleo, et al., 2006). The precise molecular targets of these pathways remain unknown, and AD-related studies in simple model systems present a complex picture. We found that blockade of NMDA receptors using either MK-801 or memantine attenuated the Aβ-induced changes in spine number or morphology, consistent with the idea that excess NMDA receptor activation contributes to Aβ synaptotoxicity. Furthermore, the loss and shrinkage of spines we observe is consistent with a recent study that demonstrated increased endocytosis of NMDA receptors in response to Aβ (Snyder, et al., 2005). That NMDA receptor internalization was partly dependent on activation of α7-nicotinic receptors is also consistent with our observation that a nicotinic antagonist prevented Aβ-induced changes in spine morphology. The relationship among spine shape, nicotinic and glutamate receptor activity and trafficking, and Aβ effects remain to be fully elucidated. Cell culture models provide an experimentally accessible means to probe these important mechanisms.
Experimental Methods
Preparation of Natural Aβ
Natural Aβ was prepared according to Walsh et al. (2002a). Briefly, regular CHO cells (control Chinese hamster ovary cells) or CHO cells expressing APP V717F mutation (referred as 7PA2 cells) were grown to confluency. Neurobasal medium (plus B27) was conditioned by incubation for 16hrs with the cells, then cleared of cells and debris (200 × g, 10 min, 4°C), flash frozen in aliquots and kept at −80°C prior to application to neuronal cultures. Total Aβ concentration was established by Enzyme-linked immunosorbent assay (ELISA) for Aβ using monoclonal antibody Ab9 as capture (Levites et al 2006) and biotin-coupled 4G8 (Signet Labs, Dedham, MA) as reporter.
Immunodepletion assays
Media were incubated for 4hrs with anti-mouse IgG-conjugated agarose beads (American Qualex) bound to monoclonal antibody 82E1 against Aβ N-terminus (Qi-Takahara, et al., 2005), or monoclonal antibodies 1G7 and 5A3 against the extracellular domain of APP (Koo and Squazzo, 1994) (see Fig. S1). In medium, 1G7 and 5A3 recognize specifically sAPP. Excess antibody was removed by additional 2 hr incubation with unloaded beads, and excess beads were removed. All procedures were carried out at 4 °C. Control samples consisted of medium incubated with unconjugated beads. All media samples were applied to neuronal cultures in a blind fashion, such that the persons applying the compounds and collecting and analyzing the morphological data were not aware of the identity of the medium.
Hippocampal culture and transfection
Hippocampal cultures were prepared according to Calabrese and Halpain (2005) at a density of 300 cells/mm2 and maintained in neurobasal medium (GIBCO), supplemented with B27 (Invitrogen) and 0.5 mM L-glutamine (Sigma). Neurons were transfected at 20 days in vitro (DIV) using calcium phosphate precipitation, with pEGFP-N1 (Clontech). Solutions and the range of cDNA concentrations were chosen according to Kohrmann et al. (1999). Cells were incubated with the transfection mixture for 3 hrs in a 5% CO2 incubator at 37°C, washed twice with prewarmed HBS solution (in mM: 135 NaCl, 4 KCl,1 Na2HPO4, 2 CaCl2, 1 MgCl2, 10 glucose, and 20 HEPES, [pH, 7.35]) and replaced in the medium in which they had been growing before transfection. Cells were fixed or used for live cell-imaging experiments within two days post-transfection. mRFP-Synaptophysin, a gift from C. Garner, was electroporated into newly dissociated neurons prior to plating onto coverslips, using the Amaxa Biosystems Nucleofector Kit, using the manufacturer’s recommended protocol. Conditioned medium from 7PA2 cells was diluted with regular neuronal cell culture medium to achieve the desired final concentration of Aβ. An equivalent volume of conditioned medium from control CHO cells was applied in parallel to control hippocampal cultures.
Immunocytochemistry
Cultures were fixed with 3.7% formaldehyde in phosphate-buffered saline (PBS) plus 120 mM sucrose for 20 min at 37°C. Then they were incubated in 20 mM glycine for 5 min, rinsed and permeabilized with 0.2% Triton X-100 for 5 min at room temperature, and blocked for 30 min with 2% bovine serum albumin (BSA). Mouse monoclonal anti-synaptophysin antibody at 1:200 (clone SVP-38, Sigma), rabbit polyclonal VGLUT and VGAT antibodies at 1:1000 (Synaptic Systems) were incubated for 1 hr at room temperature, and, following rinsing, were incubated with AlexaFluor-568-conjugated secondary antibody (Molecular Probes) for 45 min at 37°C.
Image Acquisition and Quantitative Analysis
Fluorescence images were collected using an Olympus Fluoview 500 confocal microscope by sequential illumination using the 488 line of an argon laser, the HeNe Green 543 laser, and the HeNe Red 633 laser. Sequential acquisition eliminated bleed-through. A stack of images was acquired in the z dimension at optical slice thickness of 0.4 μm to cover entire neurons, using a 60× 1.4 NA Plan APO oil immersion objective and optical zoom 2. All morphometric measurements were analyzed with MetaMorph imaging software (Universal Imaging Corporation, West Chester, PA). Three representative dendrites were selected randomly per neuron. Protrusion length was defined as the distance between the base and the top of the protrusion head; width was measured across the thickest portion of the spine head. Quantification of the area of clusters containing synaptophysin, VGLUT, or VGAT immunofluorescence was determined using a routine in Metamorph that calculate automatically the area of thresholded objects. The density of such thresholded clusters containing synaptophysin, VGLUT, or VGAT immunofluorescence was calculated manually considering only the clusters that appeared to be in close apposition to the selected dendritic regions.
Time-lapse recording
Neurons were cultured and transfected on Lab-Tek II chambered coverglass (155409; Nalgene Nunc International). GFP and mRFP emissions from transfected neurons were imaged at 37°C with an Olympus IX-70 laser-scanning confocal microscope equipped with temperature-controlled chamber delivering 5% CO2, (Solent Scientific, Portsmouth, UK). Images were collected at 60× with a 1.5 Optivar using an Orca ER camera (Hamamatsu). Z-stack images were acquired every 4–15 min for long-term imaging of spine dynamics.
Electrophysiology and mEPSC Analysis
Whole-cell voltage-clamp recordings were performed with an Axopatch 200B amplifier from eGFP-expressing neurons; recordings were obtained after switching to DIC optics. Coverslips were placed into a perfusion chamber (Warner Instruments). The external recording solution was (mM): 155 NaCl, 3.5 KCl, 2 CaCl2, 1.5 MgSO4, 10 glucose, 10 HEPES (pH 7.4). The osmolarity was 300–305 mOsm. The pipette solution contained (mM): 130 K-gluconate, 10 KCl, 10 HEPES, 2 MgCl2, 0.5 EGTA, 2 ATP, 1 GTP (pH 7.4). Miniature EPSCs were recorded in the presence of 1 μ TTX and 50 μM bicuculline at −70 mV holding potential. The solution was allowed to perfuse into cells during whole-cell recording for 3 min, prior to recording spontaneous postsynaptic currents for 5–10 min. Only cells with stable access resistance were included in the data analysis. The electrode resistance after back-filling was 4–6 MΩ. Recordings were digitized using a Digidata 1320A interface and the Pclamp8 (Axon Instruments, Union City CA) software package. Data for mEPSC analysis were sampled at a rate of 20 kHz and filtered at 2 kHz. Synaptic events were detected and analyzed (amplitude, kinetics, frequency) off-line using a peak detection program (Mini Analysis program, Synaptosoft, Decatur NJ). The mean frequency (number of events/duration) and amplitude of the synaptic events were computed after automatic detection of a series of at least 1000 events.
Reagents
Pharmacological compounds were obtained from the following sources: memantine, MK801, and C6 (used respectively at 1, 20, and 100 μM; Sigma); LY-450139 (10 nM, LY411575 was the kind gift from Todd Golde and Abdul Fauq of the Mayo Clinic, Jacksonville, FL).
Data Analysis
Statistical calculations (Student’s t test, one-way ANOVA) were performed using GraphPad Prism. Significance was set at p < 0.05. Dendritic spine density was calculated using 30 to 100 dendritic regions per experimental group. Dendritic spine length and head width were calculated using 300 to 3000 dendritic spines per experimental group.
Supplementary Material
Fig. S1. Soluble Aβ, not Soluble APP, Affects the Stability and Morphology of Dendritic Spines.
Aβ specificity of the effects of 7PA2-CM was examined by depleting the medium of specific APP metabolites using immunoaffinity beads (see Methods). Morphological parameters were quantified in a blind fashion (i.e., all CHO-CM and 7PA2-CM-derived samples were encoded, applied to hippocampal cultures, and images were collected and analyzed before the identity of the medium was decoded). Sample groups shown in the bar graph (left to right): CHO; 7PA2; 7PA2 incubated with unloaded affinity beads; 7PA2 immunodepleted using antibodies 1G7 and 5A3 against APP; 7PA2 immunodepleted using antibody 82E1 specific to Aβ. Results indicate that Aβ is responsible for the morphological effects on dendritic spines. Data are expressed as mean ± SEM; (asterisks indicate values significantly different from control (CHO), **p < 0.01, one-way ANOVA, followed by Dunnett’s posthoc test).
Fig. S2. APP Cleavage by γ-secretase is Required for 7PA2 Medium to Alter Dendritic Spine Morphology.
Hippocampal neurons were incubated with CHO-CM or 7PA2-CM treated with or without ?-secretase inhibitor (LY-411,575 10nM for 16hrs) to block Aβ production. Data are expressed as mean ± SEM; (asterisks indicate values significantly different from CHO, **p < 0.01, one-way ANOVA, followed by Dunnett’s posthoc test).
Fig. S3. Time -lapse Imaging of Aβ Effects on Dendritic Spines
(A) Shown are additional examples of dendritic regions from control (CHO-CM) and Aβ-treated neurons (7PA2-CM, containing 80pM Aβ ) that were imaged for the indicated times. Neurons express eGFP as a cell filler. ‘Washout’ indicates the time point at which medium was replaced multiple times to reduce the Aβ concentration, as described in Methods. Open arrows indicate some examples of spines that elongate; closed arrow indicates example of a spine that collapses.
(B) Example to illustrate a single dendritic protrusion that undergoes sequential elongation and collapse (open arrow).
Fig. S4. Soluble Aβ Decreases Average Synaptophysin Fluorescence in Living Neurons.
Time-lapse series from cultures doubly transfected to express eGFP (green) in dendrites and mRFP-synaptophysin (magenta) in axons and nerve terminals. Shown are selected frames from sequences in which cultures were incubated in the presence of CHO-CM (A1,2) or 7PA2-CM (B1,2) prior to imaging at the indicated time points. Images were collected at 4–15 min intervals; selected panels are shown; see also Supplemental Movies S4, S5, S6 and S7. Circled regions indicate some examples of synapses at which presumptive presynaptic and postsynaptic partners were identified. Note that many labeled presynaptic varicosities are visible that presumably connect to unlabeled dendrites in the field; likewise many labeled spines presumably connect with unlabeled presynaptic varicosities in the field. The open arrow points to a dendritic spine that apparently becomes detached from its presynaptic terminal prior to collapse (See magnified view of this spine in Figure 6A and Supplemental Movie S8). (C) Quantification of synaptophysin fluorescence intensity over time. Data represent mean ± SEM from randomly selected dendritic regions from three neurons each from control and Aβ treated cultures.
Fig. S5. Additional Examples of Apparent Disconnection Between Presynaptic and Postsynaptic Partners Following Incubation with Soluble Aβ.
(A and B) Two examples of single dendritic spines, labeled with eGFP (green), adjacent to a nerve terminal labeled with mRFP-synaptophysin (magenta). Shown are selected frames collected at the time points shown (in minutes) following exposure to 7PA2-CM. Arrowheads point to the synapse pair in the first frame of each time series; asterisks indicate the uncoupling event within each series. See also Supplemental Movies S9 and S10.
Movie S1. (Supplemental to Figure 5A1) Time-lapse recording of a control neuron transfected with eGFP. Images were acquired every 15 min for 20 hours from the time CHO-CM was added. Note the “morphing” behavior exhibited by most spine heads.
Movie S2. (Supplemental to Figure 5A2) Time-lapse recording of an Aβ treated neuron transfected with eGFP. Images were acquired every 4 min for 7 hours from the time 7PA2-CM was added.
Movie S3. (Supplemental to Figure 5A3) Time-lapse recording of an Aβ treated neuron transfected with eGFP. Images were acquired every 15 min for 4.5 hours from the time 7PA2-CM was added.
Movie S4. (Supplemental to Figure S4A1) Time-lapse recording from a control dendritic region expressing eGFP with neighboring axons and nerve terminals expressing mRFP-synaptophysin (magenta). Images were acquired every 15 min for 16 hours from the time CHO -CM was added.
Movie S5. (Supplemental to Figure S4A2) Time-lapse recording from a control dendritic region expressing eGFP with neighboring axons and nerve terminals expressing mRFP-synaptophysin (magenta). Images were acquired every 15 min for 36 hours from the time CHO -CM was added.
Movie S6. (Supplemental to Figure S4B1) Time-lapse recording from an Aβ treated dendritic region expressing eGFP with neighboring axons and nerve terminals expressing mRFP-synaptophysin (magenta). Images were acquired every 4 min for 17 hours from the time 7PA2-CM was added.
Movie S7. (Supplemental to Figure S4B2) Time-lapse recording from an Aβ treated dendritic region expressing eGFP with neighboring axons and nerve terminals expressing mRFP-synaptophysin (magenta). Images were acquired every 4 min for 11 hours from the time 7PA2-CM was added.
Movie S8. (Supplemental to Figure 6A) Time-lapse recording of multiple dendritic spines expressing eGFP and juxtaposed to axons expressing mRFP-synaptophysin. Images were acquired every 4 min for 17 hours from the time 7PA2-CM was added. Note the apparent uncoupling between the dendritic spine on the left and its neighboring axon.
Movie S9. (Supplemental to Figure S5A) Time-lapse recording of a dendritic spine expressing eGFP and juxtaposed to axons expressing mRFP-synaptophysin. Images were acquired every 4 min for almost one hour from the time 7PA2-CM was added. Note the apparent uncoupling between the dendritic spine and its neighboring axon.
Movie S10. (Supplemental to Figure S5B) Time-lapse recording of multiple dendritic spines expressing eGFP and juxtaposed to axons expressing mRFP-synaptophysin. Images were acquired every 4 min for almost 7 hours from the time 7PA2 -CM was added. Note the apparent uncoupling between the lower dendritic spine and its neighboring axon.
Acknowledgments
We thank members of the Halpain lab for critical discussions. We are grateful to Dr. Kathy Spencer for providing technical support for the microscopes. These studies were partially funded by MH50861 and NS37311 (S.H.) and AG12376 and AG05131 (E.H.K.).
Footnotes
Publisher's Disclaimer: This is a PDF file of an unedited manuscript that has been accepted for publication. As a service to our customers we are providing this early version of the manuscript. The manuscript will undergo copyediting, typesetting, and review of the resulting proof before it is published in its final citable form. Please note that during the production process errors may be discovered which could affect the content, and all legal disclaimers that apply to the journal pertain.
References
- Baloyannis SJ, Manolidis SL, Manolidis LS. The acoustic cortex in Alzheimer’s disease. Acta Otolaryngol Suppl. 1992;494:1–13. doi: 10.3109/00016489209137072. [DOI] [PubMed] [Google Scholar]
- Bateman RJ, Munsell LY, Morris JC, Swarm R, Yarasheski KE, Holtzman DM. Human amyloid-beta synthesis and clearance rates as measured in cerebrospinal fluid in vivo. Nat Med. 2006;12:856–61. doi: 10.1038/nm1438. [DOI] [PMC free article] [PubMed] [Google Scholar]
- Bell KF, Ducatenzeiler A, Ribeiro-da-Silva A, Duff K, Bennett DA, Claudio Cuello A. The amyloid pathology progresses in a neurotransmitter-specific manner. Neurobiol Aging. 2006;27:1644–57. doi: 10.1016/j.neurobiolaging.2005.09.034. [DOI] [PubMed] [Google Scholar]
- Blanpied TA, Ehlers MD. Microanatomy of dendritic spines: emerging principles of synaptic pathology in psychiatric and neurological disease. Biol Psychiatry. 2004;55:1121–7. doi: 10.1016/j.biopsych.2003.10.006. [DOI] [PubMed] [Google Scholar]
- Calabrese B, Halpain S. Essential role for the PKC target MARCKS in maintaining dendritic spine morphology. Neuron. 2005;48:77–90. doi: 10.1016/j.neuron.2005.08.027. [DOI] [PubMed] [Google Scholar]
- Cleary JP, Walsh DM, Hofmeister JJ, Shankar GM, Kuskowski MA, Selkoe DJ, Ashe KH. Natural oligomers of the amyloid-beta protein specifically disrupt cognitive function. Nat Neurosci. 2005;8:79–84. doi: 10.1038/nn1372. [DOI] [PubMed] [Google Scholar]
- D’Andrea MR, Nagele RG. Targeting the alpha 7 nicotinic acetylcholine receptor to reduce amyloid accumulation in Alzheimer’s disease pyramidal neurons. Curr Pharm Des. 2006;12:677–84. doi: 10.2174/138161206775474224. [DOI] [PubMed] [Google Scholar]
- Davidsson P, Blennow K. Neurochemical dissection of synaptic pathology in Alzheimer’s disease. Int Psychogeriatr. 1998;10:11–23. doi: 10.1017/s1041610298005110. [DOI] [PubMed] [Google Scholar]
- Deshpande A, Mina E, Glabe C, Busciglio J. Different conformations of amyloid beta induce neurotoxicity by distinct mechanisms in human cortical neurons. J Neurosci. 2006;26:6011–8. doi: 10.1523/JNEUROSCI.1189-06.2006. [DOI] [PMC free article] [PubMed] [Google Scholar]
- Dunaevsky A, Tashiro A, Majewska A, Mason C, Yuste R. Developmental regulation of spine motility in the mammalian central nervous system. Proc Natl Acad Sci U S A. 1999;96:13438–43. doi: 10.1073/pnas.96.23.13438. [DOI] [PMC free article] [PubMed] [Google Scholar]
- Einstein G, Buranosky R, Crain BJ. Dendritic pathology of granule cells in Alzheimer’s disease is unrelated to neuritic plaques. J Neurosci. 1994;14:5077–88. doi: 10.1523/JNEUROSCI.14-08-05077.1994. [DOI] [PMC free article] [PubMed] [Google Scholar]
- Ferrer I, Gullotta F. Down’s syndrome and Alzheimer’s disease: dendritic spine counts in the hippocampus. Acta Neuropathol (Berl) 1990;79:680–5. doi: 10.1007/BF00294247. [DOI] [PubMed] [Google Scholar]
- Fischer M, Kaech S, Knutti D, Matus A. Rapid actin-based plasticity in dendritic spines. Neuron. 1998;20:847–54. doi: 10.1016/s0896-6273(00)80467-5. [DOI] [PubMed] [Google Scholar]
- Hsieh H, Boehm J, Sato C, Iwatsubo T, Tomita T, Sisodia S, Malinow R. AMPAR Removal Underlies Abeta-Induced Synaptic Depression and Dendritic Spine Loss. Neuron. 2006;52:831–43. doi: 10.1016/j.neuron.2006.10.035. [DOI] [PMC free article] [PubMed] [Google Scholar]
- Ishibashi K, Tomiyama T, Nishitsuji K, Hara M, Mori H. Absence of synaptophysin near cortical neurons containing oligomer Abeta in Alzheimer’s disease brain. J Neurosci Res. 2006;84:632–6. doi: 10.1002/jnr.20952. [DOI] [PubMed] [Google Scholar]
- Jacobsen JS, Wu CC, Redwine JM, Comery TA, Arias R, Bowlby M, Martone R, Morrison JH, Pangalos MN, Reinhart PH, Bloom FE. Early-onset behavioral and synaptic deficits in a mouse model of Alzheimer’s disease. Proc Natl Acad Sci U S A. 2006;103:5161–6. doi: 10.1073/pnas.0600948103. [DOI] [PMC free article] [PubMed] [Google Scholar]
- Kohrmann M, Haubensak W, Hemraj I, Kaether C, Lessmann VJ, Kiebler MA. Fast, convenient, and effective method to transiently transfect primary hippocampal neurons. J Neurosci Res. 1999;58:831–5. [PubMed] [Google Scholar]
- Koo EH, Squazzo SL. Evidence that production and release of amyloid beta-protein involves the endocytic pathway. J Biol Chem. 1994;269:17386–9. [PubMed] [Google Scholar]
- Lacor PN, Buniel MC, Chang L, Fernandez SJ, Gong Y, Viola KL, Lambert MP, Velasco PT, Bigio EH, Finch CE, Krafft GA, Klein WL. Synaptic targeting by Alzheimer’s-related amyloid beta oligomers. J Neurosci. 2004;24:10191–200. doi: 10.1523/JNEUROSCI.3432-04.2004. [DOI] [PMC free article] [PubMed] [Google Scholar]
- Lacor PN, Buniel MC, Furlow PW, Sanz Clemente A, Velasco PT, Wood M, Viola KL, Klein WL. A{beta} Oligomer-Induced Aberrations in Synapse Composition, Shape, and Density Provide a Molecular Basis for Loss of Connectivity in Alzheimer’s Disease. J Neurosci. 2007;27:796–807. doi: 10.1523/JNEUROSCI.3501-06.2007. [DOI] [PMC free article] [PubMed] [Google Scholar]
- Lanz TA, Carter DB, Merchant KM. Dendritic spine loss in the hippocampus of young PDAPP and Tg2576 mice and its prevention by the ApoE2 genotype. Neurobiol Dis. 2003;13:246–53. doi: 10.1016/s0969-9961(03)00079-2. [DOI] [PubMed] [Google Scholar]
- Lleo A, Greenberg SM, Growdon JH. Current pharmacotherapy for Alzheimer’s disease. Annu Rev Med. 2006;57:513–33. doi: 10.1146/annurev.med.57.121304.131442. [DOI] [PubMed] [Google Scholar]
- Masliah E. The role of synaptic proteins in Alzheimer’s disease. Ann N Y Acad Sci. 2000;924:68–75. doi: 10.1111/j.1749-6632.2000.tb05562.x. [DOI] [PubMed] [Google Scholar]
- Mehta PD, Pirttila T, Mehta SP, Sersen EA, Aisen PS, Wisniewski HM. Plasma and cerebrospinal fluid levels of amyloid beta proteins 1-40 and 1-42 in Alzheimer disease. Arch Neurol. 2000;57:100–5. doi: 10.1001/archneur.57.1.100. [DOI] [PubMed] [Google Scholar]
- Moolman DL, Vitolo OV, Vonsattel JP, Shelanski ML. Dendrite and dendritic spine alterations in Alzheimer models. J Neurocytol. 2004;33:377–87. doi: 10.1023/B:NEUR.0000044197.83514.64. [DOI] [PubMed] [Google Scholar]
- Motter R, Vigo-Pelfrey C, Kholodenko D, Barbour R, Johnson-Wood K, Galasko D, Chang L, Miller B, Clark C, Green R, et al. Reduction of beta-amyloid peptide42 in the cerebrospinal fluid of patients with Alzheimer’s disease. Ann Neurol. 1995;38:643–8. doi: 10.1002/ana.410380413. [DOI] [PubMed] [Google Scholar]
- Oddo S, LaFerla FM. The role of nicotinic acetylcholine receptors in Alzheimer’s disease. J Physiol Paris. 2006;99:172–9. doi: 10.1016/j.jphysparis.2005.12.080. [DOI] [PubMed] [Google Scholar]
- Pitschke M, Prior R, Haupt M, Riesner D. Detection of single amyloid beta-protein aggregates in the cerebrospinal fluid of Alzheimer’s patients by fluorescence correlation spectroscopy. Nat Med. 1998;4:832–4. doi: 10.1038/nm0798-832. [DOI] [PubMed] [Google Scholar]
- Podlisny MB, Ostaszewski BL, Squazzo SL, Koo EH, Rydell RE, Teplow DB, Selkoe DJ. Aggregation of secreted amyloid beta-protein into sodium dodecyl sulfate-stable oligomers in cell culture. J Biol Chem. 1995;270:9564–70. doi: 10.1074/jbc.270.16.9564. [DOI] [PubMed] [Google Scholar]
- Probst A, Basler V, Bron B, Ulrich J. Neuritic plaques in senile dementia of Alzheimer type: a Golgi analysis in the hippocampal region. Brain Res. 1983;268:249–54. doi: 10.1016/0006-8993(83)90490-0. [DOI] [PubMed] [Google Scholar]
- Qi-Takahara Y, Morishima-Kawashima M, Tanimura Y, Dolios G, Hirotani N, Horikoshi Y, Kametani F, Maeda M, Saido TC, Wang R, Ihara Y. Longer forms of amyloid beta protein: implications for the mechanism of intramembrane cleavage by gamma-secretase. J Neurosci. 2005;25:436–45. doi: 10.1523/JNEUROSCI.1575-04.2005. [DOI] [PMC free article] [PubMed] [Google Scholar]
- Rogawski MA, Wenk GL. The neuropharmacological basis for the use of memantine in the treatment of Alzheimer’s disease. CNS Drug Rev. 2003;9:275–308. doi: 10.1111/j.1527-3458.2003.tb00254.x. [DOI] [PMC free article] [PubMed] [Google Scholar]
- Selkoe DJ. Alzheimer’s disease is a synaptic failure. Science. 2002;298:789–91. doi: 10.1126/science.1074069. [DOI] [PubMed] [Google Scholar]
- Selkoe DJ. The ups and downs of Abeta. Nat Med. 2006;12:758–9. 759. doi: 10.1038/nm0706-758. [DOI] [PubMed] [Google Scholar]
- Shrestha BR, Vitolo OV, Joshi P, Lordkipanidze T, Shelanski M, Dunaevsky A. Amyloid beta peptide adversely affects spine number and motility in hippocampal neurons. Mol Cell Neurosci. 2006;33:274–82. doi: 10.1016/j.mcn.2006.07.011. [DOI] [PubMed] [Google Scholar]
- Small DH, Cappai R. Alois Alzheimer and Alzheimer’s disease: a centennial perspective. J Neurochem. 2006;99:708–10. doi: 10.1111/j.1471-4159.2006.04212.x. [DOI] [PubMed] [Google Scholar]
- Snyder EM, Nong Y, Almeida CG, Paul S, Moran T, Choi EY, Nairn AC, Salter MW, Lombroso PJ, Gouras GK, Greengard P. Regulation of NMDA receptor trafficking by amyloid-beta. Nat Neurosci. 2005;8:1051–8. doi: 10.1038/nn1503. [DOI] [PubMed] [Google Scholar]
- Sonkusare SK, Kaul CL, Ramarao P. Dementia of Alzheimer’s disease and other neurodegenerative disorders--memantine, a new hope. Pharmacol Res. 2005;51:1–17. doi: 10.1016/j.phrs.2004.05.005. [DOI] [PubMed] [Google Scholar]
- Spires TL, Meyer-Luehmann M, Stern EA, McLean PJ, Skoch J, Nguyen PT, Bacskai BJ, Hyman BT. Dendritic spine abnormalities in amyloid precursor protein transgenic mice demonstrated by gene transfer and intravital multiphoton microscopy. J Neurosci. 2005;25:7278–87. doi: 10.1523/JNEUROSCI.1879-05.2005. [DOI] [PMC free article] [PubMed] [Google Scholar]
- Sze CI, Troncoso JC, Kawas C, Mouton P, Price DL, Martin LJ. Loss of the presynaptic vesicle protein synaptophysin in hippocampus correlates with cognitive decline in Alzheimer disease. J Neuropathol Exp Neurol. 1997;56:933–44. doi: 10.1097/00005072-199708000-00011. [DOI] [PubMed] [Google Scholar]
- Tanzi RE. The synaptic Abeta hypothesis of Alzheimer disease. Nat Neurosci. 2005;8:977–9. doi: 10.1038/nn0805-977. [DOI] [PubMed] [Google Scholar]
- Townsend M, Shankar GM, Mehta T, Walsh DM, Selkoe DJ. Effects of secreted oligomers of amyloid beta-protein on hippocampal synaptic plasticity: a potent role for trimers. J Physiol. 2006;572:477–92. doi: 10.1113/jphysiol.2005.103754. [DOI] [PMC free article] [PubMed] [Google Scholar]
- Walsh DM, Klyubin I, Fadeeva JV, Cullen WK, Anwyl R, Wolfe MS, Rowan MJ, Selkoe DJ. Naturally secreted oligomers of amyloid beta protein potently inhibit hippocampal long-term potentiation in vivo. Nature. 2002a;416:535–9. doi: 10.1038/416535a. [DOI] [PubMed] [Google Scholar]
- Walsh DM, Klyubin I, Fadeeva JV, Rowan MJ, Selkoe DJ. Amyloid-beta oligomers: their production, toxicity and therapeutic inhibition. Biochem Soc Trans. 2002b;30:552–7. doi: 10.1042/bst0300552. [DOI] [PubMed] [Google Scholar]
- Wang HW, Pasternak JF, Kuo H, Ristic H, Lambert MP, Chromy B, Viola KL, Klein WL, Stine WB, Krafft GA, Trommer BL. Soluble oligomers of beta amyloid (1-42) inhibit long-term potentiation but not long-term depression in rat dentate gyrus. Brain Res. 2002;924:133–40. doi: 10.1016/s0006-8993(01)03058-x. [DOI] [PubMed] [Google Scholar]
- Ziv NE, Smith SJ. Evidence for a role of dendritic filopodia in synaptogenesis and spine formation. Neuron. 1996;17:91–102. doi: 10.1016/s0896-6273(00)80283-4. [DOI] [PubMed] [Google Scholar]
Associated Data
This section collects any data citations, data availability statements, or supplementary materials included in this article.
Supplementary Materials
Fig. S1. Soluble Aβ, not Soluble APP, Affects the Stability and Morphology of Dendritic Spines.
Aβ specificity of the effects of 7PA2-CM was examined by depleting the medium of specific APP metabolites using immunoaffinity beads (see Methods). Morphological parameters were quantified in a blind fashion (i.e., all CHO-CM and 7PA2-CM-derived samples were encoded, applied to hippocampal cultures, and images were collected and analyzed before the identity of the medium was decoded). Sample groups shown in the bar graph (left to right): CHO; 7PA2; 7PA2 incubated with unloaded affinity beads; 7PA2 immunodepleted using antibodies 1G7 and 5A3 against APP; 7PA2 immunodepleted using antibody 82E1 specific to Aβ. Results indicate that Aβ is responsible for the morphological effects on dendritic spines. Data are expressed as mean ± SEM; (asterisks indicate values significantly different from control (CHO), **p < 0.01, one-way ANOVA, followed by Dunnett’s posthoc test).
Fig. S2. APP Cleavage by γ-secretase is Required for 7PA2 Medium to Alter Dendritic Spine Morphology.
Hippocampal neurons were incubated with CHO-CM or 7PA2-CM treated with or without ?-secretase inhibitor (LY-411,575 10nM for 16hrs) to block Aβ production. Data are expressed as mean ± SEM; (asterisks indicate values significantly different from CHO, **p < 0.01, one-way ANOVA, followed by Dunnett’s posthoc test).
Fig. S3. Time -lapse Imaging of Aβ Effects on Dendritic Spines
(A) Shown are additional examples of dendritic regions from control (CHO-CM) and Aβ-treated neurons (7PA2-CM, containing 80pM Aβ ) that were imaged for the indicated times. Neurons express eGFP as a cell filler. ‘Washout’ indicates the time point at which medium was replaced multiple times to reduce the Aβ concentration, as described in Methods. Open arrows indicate some examples of spines that elongate; closed arrow indicates example of a spine that collapses.
(B) Example to illustrate a single dendritic protrusion that undergoes sequential elongation and collapse (open arrow).
Fig. S4. Soluble Aβ Decreases Average Synaptophysin Fluorescence in Living Neurons.
Time-lapse series from cultures doubly transfected to express eGFP (green) in dendrites and mRFP-synaptophysin (magenta) in axons and nerve terminals. Shown are selected frames from sequences in which cultures were incubated in the presence of CHO-CM (A1,2) or 7PA2-CM (B1,2) prior to imaging at the indicated time points. Images were collected at 4–15 min intervals; selected panels are shown; see also Supplemental Movies S4, S5, S6 and S7. Circled regions indicate some examples of synapses at which presumptive presynaptic and postsynaptic partners were identified. Note that many labeled presynaptic varicosities are visible that presumably connect to unlabeled dendrites in the field; likewise many labeled spines presumably connect with unlabeled presynaptic varicosities in the field. The open arrow points to a dendritic spine that apparently becomes detached from its presynaptic terminal prior to collapse (See magnified view of this spine in Figure 6A and Supplemental Movie S8). (C) Quantification of synaptophysin fluorescence intensity over time. Data represent mean ± SEM from randomly selected dendritic regions from three neurons each from control and Aβ treated cultures.
Fig. S5. Additional Examples of Apparent Disconnection Between Presynaptic and Postsynaptic Partners Following Incubation with Soluble Aβ.
(A and B) Two examples of single dendritic spines, labeled with eGFP (green), adjacent to a nerve terminal labeled with mRFP-synaptophysin (magenta). Shown are selected frames collected at the time points shown (in minutes) following exposure to 7PA2-CM. Arrowheads point to the synapse pair in the first frame of each time series; asterisks indicate the uncoupling event within each series. See also Supplemental Movies S9 and S10.
Movie S1. (Supplemental to Figure 5A1) Time-lapse recording of a control neuron transfected with eGFP. Images were acquired every 15 min for 20 hours from the time CHO-CM was added. Note the “morphing” behavior exhibited by most spine heads.
Movie S2. (Supplemental to Figure 5A2) Time-lapse recording of an Aβ treated neuron transfected with eGFP. Images were acquired every 4 min for 7 hours from the time 7PA2-CM was added.
Movie S3. (Supplemental to Figure 5A3) Time-lapse recording of an Aβ treated neuron transfected with eGFP. Images were acquired every 15 min for 4.5 hours from the time 7PA2-CM was added.
Movie S4. (Supplemental to Figure S4A1) Time-lapse recording from a control dendritic region expressing eGFP with neighboring axons and nerve terminals expressing mRFP-synaptophysin (magenta). Images were acquired every 15 min for 16 hours from the time CHO -CM was added.
Movie S5. (Supplemental to Figure S4A2) Time-lapse recording from a control dendritic region expressing eGFP with neighboring axons and nerve terminals expressing mRFP-synaptophysin (magenta). Images were acquired every 15 min for 36 hours from the time CHO -CM was added.
Movie S6. (Supplemental to Figure S4B1) Time-lapse recording from an Aβ treated dendritic region expressing eGFP with neighboring axons and nerve terminals expressing mRFP-synaptophysin (magenta). Images were acquired every 4 min for 17 hours from the time 7PA2-CM was added.
Movie S7. (Supplemental to Figure S4B2) Time-lapse recording from an Aβ treated dendritic region expressing eGFP with neighboring axons and nerve terminals expressing mRFP-synaptophysin (magenta). Images were acquired every 4 min for 11 hours from the time 7PA2-CM was added.
Movie S8. (Supplemental to Figure 6A) Time-lapse recording of multiple dendritic spines expressing eGFP and juxtaposed to axons expressing mRFP-synaptophysin. Images were acquired every 4 min for 17 hours from the time 7PA2-CM was added. Note the apparent uncoupling between the dendritic spine on the left and its neighboring axon.
Movie S9. (Supplemental to Figure S5A) Time-lapse recording of a dendritic spine expressing eGFP and juxtaposed to axons expressing mRFP-synaptophysin. Images were acquired every 4 min for almost one hour from the time 7PA2-CM was added. Note the apparent uncoupling between the dendritic spine and its neighboring axon.
Movie S10. (Supplemental to Figure S5B) Time-lapse recording of multiple dendritic spines expressing eGFP and juxtaposed to axons expressing mRFP-synaptophysin. Images were acquired every 4 min for almost 7 hours from the time 7PA2 -CM was added. Note the apparent uncoupling between the lower dendritic spine and its neighboring axon.