Abstract
The generation of patient-specific pluripotent stem cells has the potential to accelerate the implementation of stem cells for clinical treatment of degenerative diseases. Technologies including somatic cell nuclear transfer and cell fusion might generate such cells but are hindered by issues that might prevent them from being used clinically. Here, we describe methods to use dermal fibroblasts easily obtained from an individual human to generate human induced pluripotent stem (iPS) cells by ectopic expression of the defined transcription factors KLF4, OCT4, SOX2, and C-MYC. The resultant cell lines are morphologically indistinguishable from human embryonic stem cells (HESC) generated from the inner cell mass of a human preimplantation embryo. Consistent with these observations, human iPS cells share a nearly identical gene-expression profile with two established HESC lines. Importantly, DNA fingerprinting indicates that the human iPS cells were derived from the donor material and are not a result of contamination. Karyotypic analyses demonstrate that reprogramming of human cells by defined factors does not induce, or require, chromosomal abnormalities. Finally, we provide evidence that human iPS cells can be induced to differentiate along lineages representative of the three embryonic germ layers indicating the pluripotency of these cells. Our findings are an important step toward manipulating somatic human cells to generate an unlimited supply of patient-specific pluripotent stem cells. In the future, the use of defined factors to change cell fate may be the key to routine nuclear reprogramming of human somatic cells.
Keywords: reprogramming, stem cell, OCT4, SOX2
The therapeutic use of stem cells depends on the availability of pluripotent cells that are not limited by technical, ethical, or immunological considerations. Recent work showing that primate ES cells can be derived by somatic cell nuclear transfer (SCNT) from somatic cells opens the door to the possibility that SCNT of human cells will soon allow for the generation of “patient-specific” ES cells (1). An approach toward the same end was recently described, in which murine fibroblasts were reprogrammed by ectopically expressing factors known to be highly expressed in murine ES cells (2). Specifically, transduction of a set of four genes encoding the transcription factors Oct4, Sox2, C-Myc, and Klf4 globally reset the epigenetic and transcriptional state of fibroblasts into that of pluripotent cells, designated induced pluripotent stem (iPS) cells, that were functionally indistinguishable from murine ES cells (2–5). Application of this approach in human cells would have enormous potential and generate patient-specific pluripotent stem cells to study and potentially ameliorate human disease. Thus, we asked here whether the defined factor approach recently described for murine reprogramming (2) could be applied to induce human fibroblasts to become pluripotent, ES-like cells.
An analysis of published expression datasets indicated that the factors required for murine cell reprogramming are also highly expressed in HESC (data not shown). We therefore reasoned that expression of the same set of four genes with the addition of the NANOG transcription factor, which has been shown to facilitate murine cell reprogramming in cell-fusion experiments (6), might induce reprogramming of human fibroblasts. Although murine reprogrammed cells were first obtained by applying a drug selection scheme for clones that express endogenous ES cell-specific genes (2–5), we and others have recently shown that such a drug-based selection approach is not required to obtain iPS cells (5, 7). Thus, we attempted to isolate human reprogrammed cells simply by overexpressing defined factors in fibroblasts and selection of ES-like colonies appearing in the culture. While our work was completed, two laboratories published elegant work in agreement with our study, demonstrating that human somatic cell reprogramming by overexpression of defined factors is a feasible method to induce pluripotency (8, 9).
Results
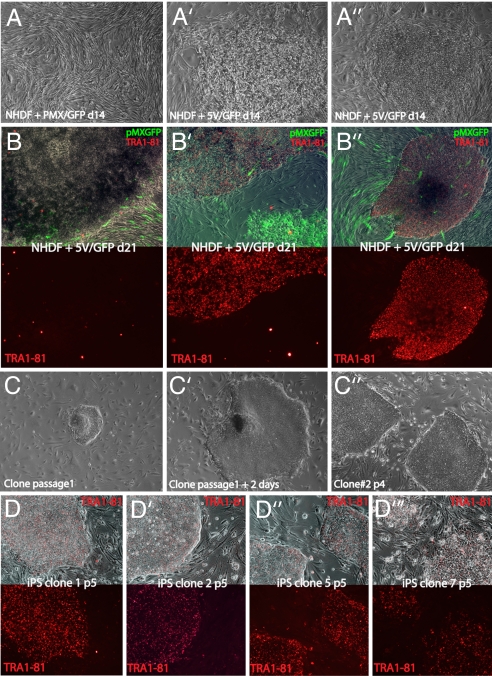
cDNAs coding for the human OCT4 (POU5F1, A isoform), SOX2, KLF4, C-MYC, and NANOG genes were cloned into the pMX retroviral vector, and virus was generated in Phoenix-A cells. Human fibroblasts donated from a single neonatal foreskin (normal human dermal fibroblasts, NHDF1) were infected twice over 3 days at passage 6 with the same volume of each viral supernatant and replated 4 days later onto a feeder layer of irradiated murine fibroblasts. In all experiments, a GFP-expressing pMX virus was added to monitor infection efficiency. Control cells infected with empty pMX virus and the GFP-bearing virus in a 5:1 ratio did not change the morphology of the cells, which continued to grow as a monolayer (Fig. 1A). In contrast, in those fibroblast cultures that were infected with viruses carrying the five defined factors and GFP, colonies formed 14 days after infection (Fig. 1 A′ and A″). These “early” colonies were highly proliferative and adopted a morphology distinct from fibroblasts. However, further characterization indicated that these clones were consistently infected with only the OCT4 and C-MYC retroviruses and in some cases with the NANOG and GFP virus (Fig. 2A′, referred to as OCT4/C-MYC clones). The OCT4/C-MYC colonies did not induce expression of HESC signature genes (Figs. 2B and Table 1) nor HESC-specific cell-surface antigens (data not shown), suggesting that combined OCT4 and C-MYC overexpression in fibroblasts is not sufficient to induce an ES-like expression pattern in fibroblasts. At 21 days after infection, new colonies emerged in the infected fibroblast cultures that adopted a tightly packed morphology and were strongly immunoreactive for the HESC surface antigens TRA-1–81, TRA-1–61, and SSEA-4 (Fig. 1B′, B″, and data not shown). An obvious feature of these colonies was their refractive edges and three-dimensional growth highly reminiscent of HESC colonies. Thus, the HESC-like morphology in combination with HESC surface antigen stainings suggested that these “late” appearing colonies could have been reprogrammed to an ES-like state.
Fig. 1.
iPS clones share HESC morphology. (A′) Heterogeneous morphology of colonies of NHDF1 infected with empty pMX virus and GFP-containing pMX viruses in a 5:1 ratio (pMX/GFP) or a combination of six pMX viruses each carrying one of the five defined transcription factors or GFP (5V/GFP), at day 14 after infection in phase contrast. (B–B″) Phase-contrast images of different colonies from 5V/GFP transduced cultures merged with live TRA-1–81 staining (red) and GFP fluorescence derived from the pMX-GFP virus (green) (Upper) and the TRA-1–81 channel separately (Lower) from cultures transduced with 5V/GFP. Note that only a minor proportion of colonies are TRA-1–81-positive as seen in B and B′. The staining in TRA-1–81-positive colonies was indistinguishable from that obtained with HESC (data not shown). (C–C″) Phase-contrast images of iPS clones at different passages. (D–D‴) “Live” Tra-1–81 staining and merge with phase-contrast appearance of indicated iPS clones at passage 5.
Fig. 2.
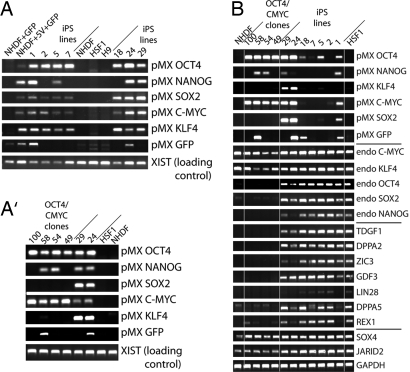
iPS clones express key HESC markers. (A and A′) PCR for retroviral integration events on genomic DNA derived from iPS and “early” OCT4/C-MYC clones, control NHDF1, NHDF1 cells infected with control (GFP) or defined factor viruses (5V + GFP), and HSF1 or H9 HESC, with primers that specifically recognize each of the integrated viruses. Loading control: PCR for a genomic region on the X chromosome within the XIST locus. iPS clones 24 and 29 are included in A′ as a positive control for the PCR conditions. (B) RT-PCR for pMX retroviral transcription and expression of endogenous counterparts of the defined factors as well as additional HESC-specific genes (TDGF1 through REX1) in iPS clones, NHDF1 and the HSF1 HESC, and in OCT4/CMYC clones. Note that iPS24 and 29 and the OCT4/CMYC clones, respectively, largely failed to suppress expression from the viruses they received.
Table 1.
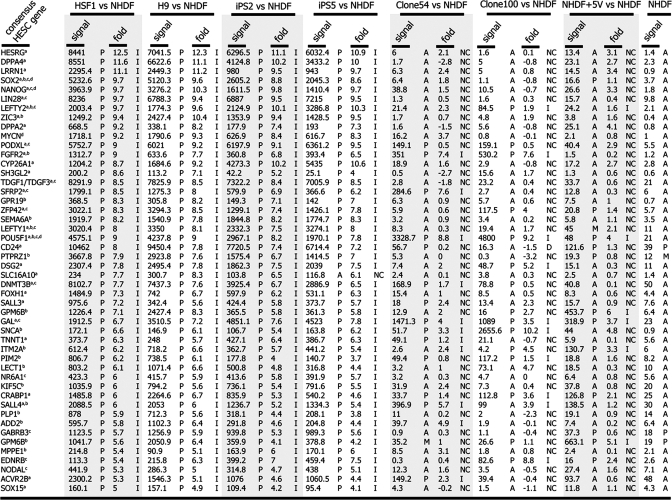
Expression of consensus HESC signature genes in human iPS clones
iPS clones express most of the HESC signature genes. Genes that are consistently highly expressed between many available HESC lines as determined by the indicated references were analyzed for their expression levels in iPS clones and early OCT4/C-MYC clones 54 and 100 by using microarray data. Note that most HESC genes are induced (denoted with I) in properly reprogrammed iPS clones (2 and 5), whereas these genes in OCT4/C-MYC clones and control cells are often not changed (NC). As determined by GCOS array analysis software: I, increased relative to NHDF; NC, no change relative to NHDF; P, present call; A, absent call; M, marginal call. a, up-regulated in ref. 12; b, up-regulated in ref. 13; c, up-regulated by International Stem Cell Consortium (14); d, defined factors to induce pluripotency; fold is Log2.
Staining unfixed plates of colonies after 28 days for the TRA-1–81 antigen proved to be an invaluable method to distinguish and isolate these putative accurately reprogrammed colonies. Colonies that stained homogenously positive for TRA-1–81 were picked from the plate and passaged. Upon replating, these colonies immediately appeared almost identical to HSF1 and H9, two previously established HESC lines that are maintained locally (Fig. 1 C–D‴ and data not shown). All analyzed TRA-1–81-positive clones were found to be infected with the viruses bearing SOX2, C-MYC, OCT4, and KLF4 (Fig. 2A). Similar to GFP, the integration of the NANOG-encoding virus was variable between clones, suggesting that NANOG is dispensable for the generation of TRA-1–81-positive colonies (Fig. 2A). The clones maintained their morphology and TRA-1–81 expression through five passages (Fig. 1 C–D‴) and continue to after at least 4 months with passaging twice a week. The colonies were cultured in HESC media (with knockout serum replacer and basic FGF) on irradiated feeders and were propagated with standard protocols using collagenase (10, 11). Because these clones appeared to have been reprogrammed to an HESC-like state based on their surface-antigen expression, they were termed human iPS cells and were subsequently analyzed in more detail to understand whether faithful reprogramming to the ES-cell state had indeed occurred. Although we initially isolated 30 human iPS clones, we focused an in-depth characterization around seven of these clones (clones 1, 2, 5, 7, 18, 24, and 29).
RT-PCR indicated that the iPS clones silenced expression of exogenous factors to different extents, with clones 2, 5, 7, and 18 silencing most, if not all viral vectors (Fig. 2B). Importantly, all analyzed iPS clones induced expression from the endogenous OCT4, SOX2, and NANOG loci, and of additional HESC signature genes (Fig. 2B), further supporting the conclusion that overexpression of OCT4, C-MYC, SOX2, and KLF4 in fibroblasts induces an ES-like state.
Semiquantitative RT-PCR and microarray expression analysis was used to compare expression of the defined factors from the retroviral promoter and the endogenous promoter combined (total transcript) and separately (viral or endogenous transcripts) between iPS clones, “early” OCT4/C-MYC clones, NHDF1 and the HESC line HSF1 [supporting information (SI) Fig. 6 and data not shown]. The nonreprogrammed OCT4/C-MYC clones all failed to shut down expression of the exogenous transcription factors from the retroviral promoter and express much more C-MYC than what is normally found in HESC, NHDF1, or iPS clones (Fig. 2B, and SI Fig. 6). In contrast, in most iPS clones, the amount of the defined factors that remain expressed from the retroviral construct does not dramatically change the total transcript levels (SI Fig. 6). Nevertheless, there is some variation in the extent to which different iPS clones repress retroviral transcription in agreement with data shown in Fig. 2B, with iPS clones 24 and 29 exhibiting the least quenching of retroviral transcription (SI Fig. 6). Together, these findings support the notion that reprogramming of fibroblasts to an HESC-like state had indeed occurred upon introduction of the four defined factors OCT4, SOX2, KLF4, and C-MYC and that transgenic expression of these defined genes has ceased, at least in some iPS clones, and given rise to an ES-like endogenous gene-expression pattern.
To exclude the possibility that our iPS clones were simply a contaminant from laboratory HESC cultures, DNA fingerprinting was used to accurately identify the origin of the iPS clones. The data in SI Fig. 7 confirm that all of the iPS clones were derived from NHDF1 and were neither related to HSF1 nor to any other HESC line (genotyping analysis, National Institutes of Health Stem Cell Unit). In addition, although the process of reprogramming remains somewhat of a mystery, karyotypic analysis revealed that gross chromosomal abnormalities were not generated as a result of reprogramming (SI Fig. 7), suggesting that large genomic rearrangements are not required for reprogramming to occur.
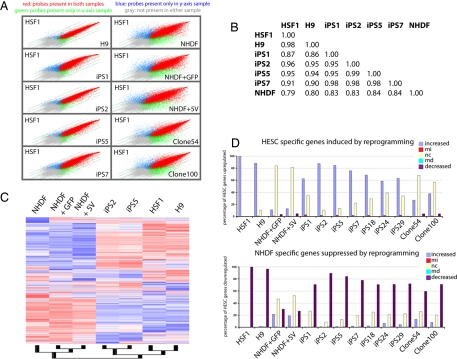
To understand how similar the iPS cells generated from NHDF1 were to HESCs, gene-expression profiling was used. Various analyses suggested that iPS clones 2 and 5 were nearly identical in their gene expression profile to two HESC lines (HSF1, H9) (Fig. 3 and Table 1). Scatter-plot analysis of every probe set on a human transcriptome array (HG-U133 + 2, >54,000 probe sets, Affymetrix) emphasized that gene expression levels between iPS cells and HESC closely correlated (Fig. 3A). Similarly, Pearson correlation analysis and hierarchical clustering analysis clearly indicated that iPS cells are significantly more similar to HESCs than to the NHDF1 population from which they were derived (Fig. 3 B and C). Examination of the most up- and down-regulated genes in HESCs relative to NHDF1s showed that HESC and iPS cells have nearly identical patterns of the most differentially regulated genes and that there are very few genes expressed by HESC that are not also expressed by iPS cells (Fig. 3D). Table 1 summarizes the expression of 50 genes that are considered to be consensus HESC signature genes (12–14) and further highlights the similarity of gene-expression level between HESC and iPS cells. SI Table 2 depicts the analysis of the top 2,000 up-regulated genes between HESC and NHDF1 extending the observation of similarity. In addition, this table also highlights differences in the gene expression profile between iPS clones. Specifically, iPS clones 24 and 29 induce expression of many fewer HESC-specific genes than iPS clones 2 and 5, demonstrating that only partial transcriptional reprogramming has occurred in iPS clones 24 and 29. Furthermore, in agreement with RT-PCR data in Fig. 2B, OCT4/C-MYC clones (clones 54 and 100) induce almost none of the HESC consensus genes (Fig. 3D and Table 1). Together, these data demonstrate that expression of four defined transcription factors is sufficient to reset the transcriptional landscape of human fibroblasts to that of HESCs and that efficient silencing of the retroviruses is correlated with more faithful reprogramming to an ES-like expression pattern.
Fig. 3.
The transcriptome of iPS clones is highly similar to that of HESC. (A) Scatter-plot presentation of the expression values for all probe sets derived from genome-wide microarray expression data of indicated cell types. NHDF1 + GFP and NHDF1 + 5V denote a pool of fibroblasts infected with pMX/pMX-GFP control viruses or viruses carrying the five defined factors plus GFP at day 18 after infection. Like the H9 HESC line, iPS clones 2 and 5 appear highly similar to the HSF1 HESC, whereas iPS lines 1 and 7 appear slightly less similar to HESC. (B) Global Pearson correlation of the entire expression data (from Affymetrix microarrays) between indicated cell types. (C) Hierarchical clustering of gene-expression data of the indicated cell types. Normalization and expression analysis was performed with DNA-chip analyzer (dChip). A 20% presence call was used to filter genes for clustering, and redundant probe sets were removed. (D) The 2,000 most up- and down-regulated genes in HSF1 versus NHDF were determined from genome-wide expression datasets and analyzed for up-regulation, down-regulation, or no change in expression between iPS clones or pools of infected NHDF cells and NHDF. MI and MD denote statistically marginal increase or decrease, respectively.
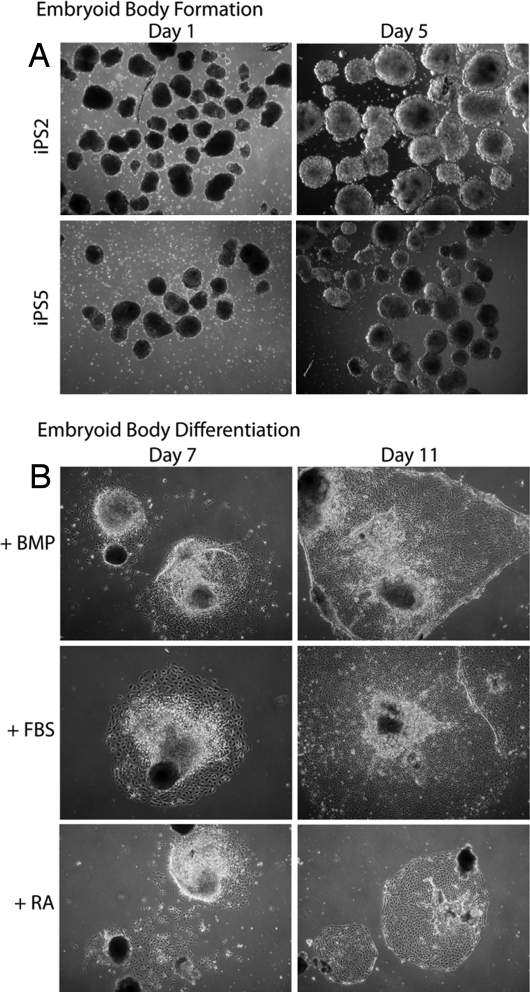
To demonstrate whether iPS clones are pluripotent, they were assayed for their ability to differentiate into lineages representative of the three embryonic germ layers. By using standard protocols used for HESC differentiation (15–17), iPS clones 2 and 5 were subjected to the embryoid body (EB) formation assay. Fig. 4A shows that the iPS cells formed canonical EB structures upon collagenase treatment. After growing in suspension for 5 days, the EBs were replated in adherent conditions and driven to differentiate under various conditions. Fig. 4B depicts outgrowths from iPS cell-derived EBs with distinctive morphologies under different culturing conditions. It should be noted that iPS clones 24 and 29 only very inefficiently formed EBs (data not shown).
Fig. 4.
iPS cells form embryoid bodies similarly to HESCs. (A) Phase-contrast images of EBs generated from iPS clones 2 and 5. (B) Growth of iPS-derived EBs upon plating onto adherent tissue culture dishes under three different media conditions. BMP, bone morphogenetic protein 4.
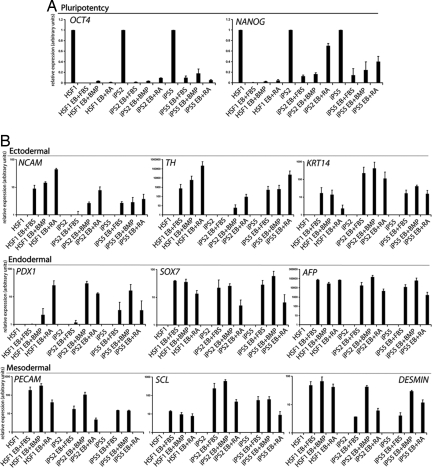
Upon EB formation and differentiation, iPS cells shut down the expression of pluripotency genes OCT4 and NANOG in a similar manner as HSF1 under the same conditions (Fig. 5). Assaying for expression of genes specific for ectoderm, endoderm, and mesoderm, respectively, revealed that iPS EBs shared a similar ability to up-regulate different lineage markers as the HESC line HSF1, thus demonstrating pluripotency (Fig. 5). Retinoic acid (RA), known to strongly induce neural differentiation in the EB assay, dramatically induced both NCAM and Tyrosine Hydroxylase, a marker of dopaminergic neurons. Keratin14 (KRT14), a marker of epidermis and the ectodermal lineage was also induced under various conditions. Endodermal differentiation was revealed by expression of PDX1 (pancreas), SOX7 (parietal endoderm), and AFP (liver), whereas mesodermal differentiation was highlighted by PECAM (vascular), SCL (hematopoietic), and Desmin (muscle). The data show that these differentiation markers were essentially absent in undifferentiated HESC and iPS cells and strongly induced only after differentiation of the EBs in each condition. Immunostaining further demonstrated that, upon induction of differentiation by EB formation, the iPS cells turned on expression of SSEA1, a hallmark of differentiating HESC, and of NESTIN, a marker of neural differentiation in response to RA (SI Fig. 8). Only pluripotent cells would have the ability to up-regulate markers of all three embryonic germ layers providing strong evidence for the pluripotency of iPS clones. Whether the iPS clones exhibit pluripotency in vivo by teratoma formation and direct transplantation of in vitro differentiated cells into appropriate tissues to demonstrate their functional significance remains to be explored.
Fig. 5.
Pluripotency of iPS cells and up-regulation of ectodermal, endodermal, and mesodermal markers. (A) Real-time RT-PCR analysis of pluripotency gene expression in iPS and control HESC (HSF1) induced to differentiate by EB formation and subsequent plating under indicated conditions [BMP4, FBS, retinoic acid (RA)] relative to GAPDH expression. The y axis represents relative fold change upon differentiation. Note that EB differentiation induces down-regulation of pluripotency markers such as OCT4 and NANOG. (B) As in A except that expression of marker genes for different germ layers was analyzed. The specificity of each marker for a given germ layer is indicated. The y axis represents relative fold of induction over undifferentiated cells. Note that although the degree of induction of lineage markers is sometimes variable between HESC and iPS clones, the pattern is consistent.
Discussion
While our work was completed, two other groups published elegant studies similar to ours demonstrating that a variety of human fibroblasts can be reprogrammed to an embryonic state (8, 9). Although Takahashi et al. (9) used the same combination of factors (i.e., OCT4, SOX2, KLF4, and C-MYC), Yu et al. (8) demonstrated that an alternative combination of defined factors, namely OCT4, SOX2, NANOG, and LIN28 can induce pluripotency in fibroblasts. The fact that the 7 iPS clones analyzed here always carried at least the OCT4-, SOX2-, KLF4-, and C-MYC-bearing retroviruses suggests that this combination of defined factors is sufficient for reprogramming in our studies. Whether expression of NANOG improves reprogramming efficiency by OCT4, SOX2, KLF4, and C-MYC remains to be determined. Nonetheless, these studies demonstrate the reproducibility and feasibility of the defined factor-reprogramming approach in human somatic cells.
Our data demonstrate that defined-factor transduction into fibroblasts leads preliminarily to the formation of nonreprogrammed colonies that are transduced with the OCT4 and C-MYC retroviruses, and subsequently, TRA-1–81-positive ES-like colonies are generated. Our analysis shows that some of these iPS clones are only partially reprogrammed to an ES cell state as measured by their gene expression program and their inability to form embryoid bodies (clones 24 and 29), whereas other clones (2 and 5) appear faithfully reprogrammed based on all of the criteria tested. One difference between these two classes of clones is that the partially reprogrammed iPS clones still express all ectopic factors, whereas the properly reprogrammed clones appear to quench expression from the retroviral constructs more efficiently. Although stringent data are lacking, defined factor reprogramming in the murine system suggests that shutdown of the exogenously expressed transcription factors is indicative and required for the establishment of the pluripotent state of murine iPS cells and thus occurred more consistently in murine iPS clones that were faithfully reprogrammed to the pluripotent state ((2–5), and data not shown). Clearly more work is required to understand the correlation between retroviral silencing and faithful reprogramming.
We propose live-TRA-1–81 staining as a method for the selection and isolation of reprogrammed clones. Because the proportion of pluripotent colonies generated by introduction of defined factors is low relative to the total number of colonies, the use of live staining for the TRA-1–81 antigen should facilitate future work. Although we cannot state with certainty that TRA-1–81-negative colonies would not give rise to iPS cells upon extended culturing and passaging, all TRA-1–81 positive colonies we obtained had an ES-like morphology and induced the endogenous ESC gene-expression pattern and were either partially or faithfully reprogrammed to the ES-cell state.
The finding that iPS cells generated by expression of defined factors in human fibroblasts are morphologically and physiologically highly similar to HESCs indicates that the mechanism by which murine fibroblasts are reprogrammed to an ES-like state is conserved across species. Although the generation of iPS cells clearly will have an impact on regenerative medicine, the specific role that each of the four transcription factors plays remains unclear. The elucidation of the mechanism by which reprogramming occurs will likely include genomic, epigenetic, and biochemical regulation and promises to contribute significantly to our understanding of self-renewal, differentiation, and the pathogenesis of cancer.
Future challenges include developing methods to transduce the exogenous transcription factors, to reprogram fibroblasts from patients with diseases, and to show that the reprogrammed cells can be differentiated into cell types that function properly upon transplantation and rescue disease models. These steps might allow for general human cell reprogramming through defined factor expression as a therapeutic approach applicable in a clinical setting.
Materials and Methods
Cell Culture Methods.
cDNAs for OCT4, SOX2, C-MYC, NANOG, KLF4, and GFP were cloned into the retroviral pMX vector and separately transfected into Phoenix Ampho Cells (Orbigen) by using Fugene (Roche). Viral supernatants were harvested 3 days later, combined, and used to infect human neonatal dermal fibroblasts (NHDF1; Lonza) in DMEM with 10% FBS, nonessential amino acids, l-glutamine, and penicillin–streptomycin. A second round of infection was performed at day 3, and the transfection efficiency of each virus as extrapolated from that of GFP in the viral mix was 15–20%, suggesting that nearly 100% of cells received at least one virus. Four days later, cells were passaged onto irradiated murine embryonic fibroblasts (MEFs). Reprogrammed cells and HESC cells were cultured on irradiated MEFs as described (10, 11) in DMEM F12 supplemented with l-glutamine, nonessential amino acids, penicillin–streptomycin, knockout serum replacement (Invitrogen), and 10 ng/ml basic FGF. For early passages, iPS cells were propagated manually, whereas subsequent passaging was performed with collagenase treatment as described (10, 11). TRA-1–81 (Chemicon) detection was done without fixation in HESC media, and images were taken within 1 h after secondary antibody incubation. To initiate EB formation, colonies were detached from the feeder layer with collagenase, media exchanged to HESC media without bFGF, and cell clusters plated in non-tissue-culture-treated plates. After 5 days, EBs were transferred onto adherent, gelatin-coated tissue-culture dishes in media containing 100 ng/ml BMP4 (R & D Systems), 5% FBS, or 1 μM all-trans retinoic acid (Sigma) and harvested for RNA isolation 9 days later.
Expression Analysis.
Total RNA was isolated by using the Absolutely RNA kit (Stratagene) and reverse-transcribed with the SuperScript III First-Strand Synthesis System (Invitrogen) with oligo dT primers. Sequences of all primers are available upon request. In real-time PCR experiments, transcript levels were determined in duplicate reactions and normalized to a GAPDH control. Whole-genome expression analysis was performed with the HG-U133 + 2 array (Affymetrix) at the University of California DNA microarray core. Normalization and expression analysis was performed with DNA-chip analyzer [dChip (18)]. Invariant set normalization was used to normalize arrays at the probe level, and the model-based method was used for calculating expression values. A 20% presence call was used to filter genes for clustering, resulting in 20,001 probe sets representing individual genes. Hierarchical clustering analysis was performed to distinguish arrays with similar expression patterns (19). The expression values for a gene across the arrays were standardized by setting the mean signal to 0 and standard deviation to 1. The expression for each cell type was analyzed by a single microarray experiment, reasoning that biological replicates would be more informative than technical ones.
DNA Analysis.
DNA was isolated by using the DNeasy kit (Qiagen) and analyzed for retroviral integration events by PCR with specific primers. DNA fingerprinting and cytogenetic analysis, were performed by Cell Line Genetics.
Supplementary Material
ACKNOWLEDGMENTS.
We thank Kelsey Martin, Gerry Weinmaster, and members of our laboratories for critical reading of the manuscript; Toshio Kitamura (University of Tokyo, Tokyo, Japan) for pMX retroviral constructs; and Shuling Guo (University of California, Los Angeles) for RT-PCR primers. We would especially like to acknowledge Cell Line Genetics for conducting DNA fingerprinting and karyotyping experiments described. K.P. was supported by the Margaret E. Early Trust Foundation, the Jonsson Cancer Center Foundation, and the Kimmel and V Scholar Foundations. R.S. was supported by a California Institute of Regenerative Medicine (CIRM) training grant. W.E.L. was supported by the CIRM and the Jonsson Cancer Center Foundation.
Footnotes
The authors declare no conflict of interest.
Data deposition: The data reported in this paper have been deposited in the Gene Expression Omnibus (GEO) database, www.ncbi.nlm.nih.gov/geo (accession no. GSE9865).
This article contains supporting information online at www.pnas.org/cgi/content/full/0711983105/DC1.
References
- 1.Byrne JA, et al. Producing primate embryonic stem cells by somatic cell nuclear transfer. Nature. 2007;450:497–502. doi: 10.1038/nature06357. [DOI] [PubMed] [Google Scholar]
- 2.Takahashi K, Yamanaka S. Induction of pluripotent stem cells from mouse embryonic and adult fibroblast cultures by defined factors. Cell. 2006;126:663–676. doi: 10.1016/j.cell.2006.07.024. [DOI] [PubMed] [Google Scholar]
- 3.Okita K, Ichisaka T, Yamanaka S. Generation of germline-competent induced pluripotent stem cells. Nature. 2007;448:313–317. doi: 10.1038/nature05934. [DOI] [PubMed] [Google Scholar]
- 4.Wernig M, et al. In vitro reprogramming of fibroblasts into a pluripotent ES cell-like state. Nature. 2007;448:318–324. doi: 10.1038/nature05944. [DOI] [PubMed] [Google Scholar]
- 5.Maherali N, et al. Directly reprogrammed fibroblasts show global epigenetic remodeling and widespread tissue contribution. Cell Stem Cell. 2007;1:55–70. doi: 10.1016/j.stem.2007.05.014. [DOI] [PubMed] [Google Scholar]
- 6.Silva J, Chambers I, Pollard S, Smith A. Nanog promotes transfer of pluripotency after cell fusion. Nature. 2006;441:997–1001. doi: 10.1038/nature04914. [DOI] [PubMed] [Google Scholar]
- 7.Meissner A, Wernig M, Jaenisch R. Direct reprogramming of genetically unmodified fibroblasts into pluripotent stem cells. Nat Biotechnol. 2007;25:1177–1181. doi: 10.1038/nbt1335. [DOI] [PubMed] [Google Scholar]
- 8.Yu J, et al. Induced pluripotent stem cell lines derived from human somatic cells. Science. 2007 doi: 10.1126/science.1151526. [DOI] [PubMed] [Google Scholar]
- 9.Takahashi K, et al. Induction of pluripotent stem cells from adult human fibroblasts by defined factors. Cell. 2007;131:861–872. doi: 10.1016/j.cell.2007.11.019. [DOI] [PubMed] [Google Scholar]
- 10.Amit M, Itskovitz-Eldor J. Derivation and maintenance of human embryonic stem cells. Methods Mol Biol. 2006;331:43–53. doi: 10.1385/1-59745-046-4:43. [DOI] [PubMed] [Google Scholar]
- 11.Akutsu H, Cowan CA, Melton D. Human embryonic stem cells. Methods Enzymol. 2006;418:78–92. doi: 10.1016/S0076-6879(06)18005-2. [DOI] [PubMed] [Google Scholar]
- 12.Bhattacharya B, et al. Gene expression in human embryonic stem cell lines: Unique molecular signature. Blood. 2004;103:2956–2964. doi: 10.1182/blood-2003-09-3314. [DOI] [PubMed] [Google Scholar]
- 13.Rao RR, et al. Comparative transcriptional profiling of two human embryonic stem cell lines. Biotechnol Bioengineer. 2004;88:273–286. doi: 10.1002/bit.20245. [DOI] [PubMed] [Google Scholar]
- 14.Adewumi O, et al. Characterization of human embryonic stem cell lines by the International Stem Cell Initiative. Nat Biotechnol. 2007;25:803–816. doi: 10.1038/nbt1318. [DOI] [PubMed] [Google Scholar]
- 15.Itskovitz-Eldor J, et al. Differentiation of human embryonic stem cells into embryoid bodies compromising the three embryonic germ layers. Mol Med. 2000;6:88–95. [PMC free article] [PubMed] [Google Scholar]
- 16.Chadwick K, et al. Cytokines and BMP-4 promote hematopoietic differentiation of human embryonic stem cells. Blood. 2003;102:906–915. doi: 10.1182/blood-2003-03-0832. [DOI] [PubMed] [Google Scholar]
- 17.Schuldiner M, et al. Induced neuronal differentiation of human embryonic stem cells. Brain Res. 2001;913:201–205. doi: 10.1016/s0006-8993(01)02776-7. [DOI] [PubMed] [Google Scholar]
- 18.Schadt EE, Li C, Su C, Wong WH. Analyzing high-density oligonucleotide gene expression array data. J Cell Biochem. 2000;80:192–202. [PubMed] [Google Scholar]
- 19.Eisen MB, Spellman PT, Brown PO, Botstein D. Cluster analysis and display of genome-wide expression patterns. Proc Natl Acad Sci USA. 1998;95:14863–14868. doi: 10.1073/pnas.95.25.14863. [DOI] [PMC free article] [PubMed] [Google Scholar]
Associated Data
This section collects any data citations, data availability statements, or supplementary materials included in this article.


