

Abstract
Arterial spin labeled (ASL) perfusion MRI provides a noninvasive approach for longitudinal imaging of regional brain function in infants. In the present study, continuous ASL (CASL) perfusion MRI was carried out in normally developing 7- and 13-month old infants while asleep without sedation. The 13-month infant group showed an increase (P<0.05) of relative CBF in frontal regions as compared to the 7-month group using a region of interest based analysis. Using a machine-learning algorithm to automatically classify the relative CBF maps of the two infant groups, a significant (P<0.05, permutation testing) regional CBF increase was found in the hippocampi, anterior cingulate, amygdalae, occipital lobes, and auditory cortex in the 13-month old infants. These results are consistent with current understanding of infant brain development and demonstrate the feasibility of using perfusion MRI to noninvasively monitor developing brain function.
Keywords: Brain development, ASL perfusion MRI, Infants, SVM
Introduction
Structural and functional imaging methods hold the potential to provide new insights into normal and abnormal brain development. Magnetic resonance imaging (MRI) methods are uniquely capable of providing high-resolution structural images and functional contrast within the same noninvasive modality. Structural MRI provides a variety of structural contrasts and the highest resolution of any in vivo imaging modality. Most functional MRI carried out to date has utilized blood-oxygenation-level-dependent (BOLD) contrast, which is sensitive to transient changes in regional cerebral blood flow (CBF) and metabolism that occur in response to task activation or other perturbations. Children as young as 5 years old can be trained to perform sensorimotor and cognitive tasks within the spatially confining and noisy MRI environment. Sleeping infants may also show BOLD fMRI responses to sensory stimulation (Souweidane et al., 1999), including activation of a temporo-parietal-frontal network similar to that seen in adults when listening to speech (Dehaene-Lambertz et al., 2002, Dehaene-Lambertz et al., 2006). However, a limitation of BOLD fMRI is that it is primarily useful for studying task-evoked responses, and the results must generally be considered in the context of the evoked behavioral response. The presence of low-frequency noise in the BOLD fMRI signal renders it poorly sensitive to changes occurring over periods longer than minutes (Zarahn et al., 1997); thus baseline functional “states” are difficult to reliably address with BOLD, though some studies have attempted to do so (Small et al., 2000, Rombouts et al., 2007) and biophysical models of resting BOLD contrast continue to be developed (He and Yablonskiy, 2007). BOLD fMRI time series data acquired at rest can also be used to assess functional connectivity (Biswal and Ulmer, 1999), default mode networks (Raichle et al., 2001, Greicius et al., 2003, Greicius et al., 2004), or functional state variation within prior regions of interest (ROIs) (Iannetti et al., 2005).
An alternative strategy for imaging brain function is to correlate resting metabolism with cognitive performance assessed outside of the scanner. This approach is useful for correlating regional variations in brain function with variations in task performance across a cohort of patients with performance deficits, or for measuring regional brain function with behavioral changes over time. Such an approach carried out by metabolic mapping using positron emission tomography (PET) scanning with fluorodeoxyglucose (FDG) has been used to identify patterns of changing brain function associated with development (Chugani et al., 1987) and cognitive disorders such as Alzheimer's disease (Hoffman et al., 1989, Kadir et al., 2006) and Parkinson's disease (Huang et al., 2007).
Arterial spin labeled (ASL) perfusion MRI uses magnetically labeled arterial blood water as a nominally diffusible flow tracer. Labeling the inflowing blood water proximal to the target imaging region, the perfusion signal is subsequently calculated by comparison with a separate image acquired using a control pulse without labeling the blood flow to remove the static background signal and control for magnetization transfer effects. To increase the signal-to-noise ratio (SNR), this procedure is usually repeated many times in several minutes to get a time-averaged CBF value. ASL techniques are capable of quantifying cerebral blood flow in well-characterized physiological units of ml/100g/min (Williams et al., 1992), directly analogous to exogenous tracer methods using ionizing radiation with PET. ASL perfusion MRI provides a quantitative measure of regional brain function that has been successfully used to identify changes in baseline function associated with aging (Biagi et al., 2007), phenotypes such as Alzheimer's disease (Alsop et al., 2000) and more recently with genotype (Rao et al., 2007).
The present study was carried out to assess the feasibility of using ASL perfusion MRI to examine changes in regional brain function associated with infant development from 7 to 13 months in a cross sectional cohort studied while sleeping without sedation, as part of the Santa Fe Institute Consortium project. Two approaches were used to assess the functional data acquired using ASL perfusion MRI. First, developmental changes were examined in a priori regions of interest (ROI) selected based on previous developmental pediatric brain FDG-PET imaging studies (Chugani and Phelps, 1986, Chugani et al., 1987). Second, regional brain function change between the 7-month and 13-month groups was also assessed in whole brain using a machine-learning algorithm, the support vector machine (SVM) (Burges, 1998). SVM can be used to extract a whole brain discrepancy map from the trained classifier without any a priori feature selection (LaConte et al., 2005, Mourão-Miranda et al., 2005, Wang et al., 2006, Wang et al., 2007b) yielding the regional maximum perfusion difference between these two age groups. Permutation testing was performed to test the significance of the SVM extracted 13- vs. 7-month brain perfusion discrepancy by testing the null hypothesis that there are no developmental brain perfusion differences between 13-month-old and 7-month-old infants.
Methods
Normal infants were recruited to undergo MRI scanning during natural sleep, including both structural imaging and ASL perfusion MRI as part of a large multi-site study of infant brain development sponsored by the Santa Fe Institute. Parental consent to participate in a broad range of serial cognitive, electrophysiological, and MRI testing was obtained for all participants. Here we report initial results from a cross-sectional study of 19 infants imaged at 7 or 13 months of age studied at a single site (Rutgers University).
Data acquisition
MRI scanning was carried out at 1.5T (GE Signa 5.X) using a product adult head coil. Infants were fed and allowed to fall asleep. Foam padding restricted head movement and provided sound attenuation (Paterson et al., 2004). Standard T1- and T2-weighted MRI was performed. Continuous ASL perfusion MRI was performed using a 3D fast spin echo (FSE) sequence with an interleaved stack of variable density spirals acquisition (Spielman et al., 1995, Liao et al., 1997). Continuous labeling was performed using the amplitude modulated control approach (Alsop and Detre, 1998). For hardware compatibility, the labeling was performed for 60 ms followed by a 40 ms gap. Labeling was performed for a total duration of 1.2 s and a 1s post-labeling delay was used to allow labeled spins to reach the imaging volume. Background suppression with adiabatic inversion pulses (Ye et al., 2000) was used to suppress the static brain signal and associated physiological noise (Ye et al., 2000). Images were acquired with a 3.8 mm cubic resolution. Three 1.5 minute acquisitions were sequentially performed, followed by a reference acquisition without suppression for blood flow quantification.
Data preprocessing
Raw K-space ASL perfusion MRI data were stored at the scanner console. ASL perfusion MRI images reconstruction was performed using a Linux workstation with a gridding method (Meyer et al., 1992) implemented in customized software. After image reconstruction, an SPM2 (Wellcome Department of Cognitive Neurology, London, UK, http://www.fil.ion.ucl.ac.uk) based ASL data processing toolbox, ASLtbx (Wang et al., 2007a) was used for preprocessing ASL data. The 3 ASL image pairs were averaged and smoothed with a 3-D isotropical kernel of size 6mm. CBF values were derived from the averaged ASL image pair using a modified one-compartment model (Chalela et al., 2000). CBF maps showing spuriously low values (<20 ml/100g/min for whole brain) suggested ineffective labeling and were discarded. Even after discarding datasets with extremely low global CBF there remained considerable variability in observed CBF values, which was most likely due to variability in labeling efficiency. Accordingly, for assessing group data CBF maps were converted to relative CBF (rCBF) by adjusting global CBF to a fixed value of 50 ml/100g/min.
The T1-weighted images acquired concurrently were normalized to the MNI canonical template provided by SPM2 software. The normalized T1 images were averaged to provide a study-specific template, which was then subsequently used in a second normalization for both T1-weighted images and the CBF maps.
Average CBF maps for the 7-month and 13-month groups were generated from the spatially normalized rCBF maps, along with a difference map. An ROI analysis was then performed to compare the CBF percentage change in sensorimotor (Brodmann's areas 4-6), visual (areas 17-19) auditory (areas 40-42) and dorsolateral frontal (areas 8-9, 44-46) regions based on the Wake Forest Pick atlas utility (Maldjian et al., 2003).
SVM classification and permutation testing
To reduce the computational burden for SVM classification, only intracranial voxels were considered. All intracranial voxels of each subject's spatially normalized rCBF image were stacked into a column vector. After mean centering, all subjects' rCBF vectors were grouped into an rCBF matrix. To further reduce the computational burden of SVM classification, a principal component analysis-based data dimension reduction was applied (Vetterling and Flannery, 2002). Standard singular vector decomposition (SVD) (Vetterling and Flannery, 2002) was used to calculate all nonzero eigenvalue associated eigenvectors (that will be called “non-zero eigenvectors” in the following content) along the time dimension of the rCBF data matrix. Each rCBF vector was then projected into the subspace spanned by the nonzero eigenvectors, yielding a representing coefficient vector. Since the number of voxels was much greater than the number of subjects (16 after excluding spurious data), theoretically, the rCBF data matrix had only 16 nonzero eigenvectors (Golub and Loan, 1996). The large rCBF data matrix was therefore compressed to a 16×16 matrix without any signal loss. Each column vector of the compressed matrix was then input into the SVM classification process as a training sample of one of the two subgroups. The samples from the 7-month group and 13-month group were labeled with “A” and “B”, respectively. SVMlight software (Joachim, 1999) was used to train a linear SVM classifier. The source code of this software was modified to allow reading of binary image representation coefficients, permutation operations, and calculation the discrepancy map from the trained classifier. The discrepancy map was generated by back projecting the separating weight vector of the trained SVM classifier into the original image space through multiplication with the nonzero eigenvectors described above ( Mourão-Miranda et al., 2005, Wang et al., 2007b).
To test the null-hypothesis that there is no perfusion discrepancy between the two different age groups, permutation testing (Nichols and Holmes, 2002, Mourão-Miranda et al., 2005) was performed by randomly permuting the class labels of all CBF vectors 2000 times, and a corresponding discrepancy map was extracted. For each voxel in the normalized image space, a P value was calculated as the proportion of the discrepancy map values from 2000 permutations that are no less than the original discrepancy map value.
Results
Acceptable CBF data was obtained from 8 infants aged 6.9 ± 0.2 months and 8 infants aged 12.7 ± 0.2 months, corresponding to a success rate of 84%. Group maps of spatially normalized relative CBF (rCBF) are shown in Fig. 1. From the top to the bottom are the average rCBF of the 7-month group, the average rCBF of the 13-month group, and the difference map of 13-month minus 7-month. An increase in rCBF is evident in dorsolateral prefrontal, insular and cingulate cortex.
Figure 1.

Relative CBF maps (normalized to 50 ml/100g/min) from 7 month old (n=8, TOP) and 13 month old (n=8, MIDDLE) infants, along with a difference image showing increased CBF in frontal regions with development (BOTTOM).
Fig. 2 shows statistical analysis results of the CBF percentage change from the a priori ROIs. A significant increase in the frontal ROI is observed (P=0.04), along with a significant decrease in the sensorimotor ROI (P=0.02).
Figure 2.
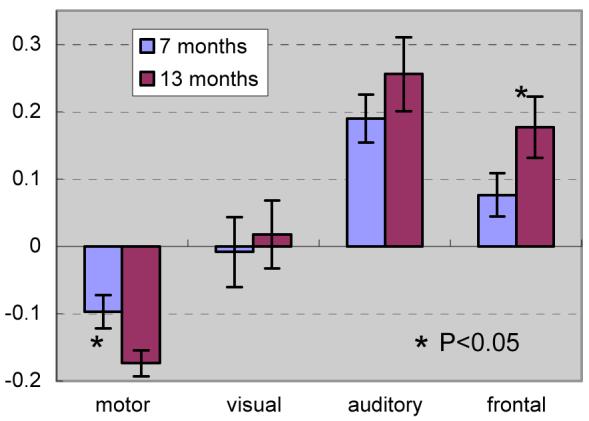
ROI analysis showing changes in relative CBF within sensorimotor, visual, auditory, and frontal regions.
The SVM classification results are shown in Figure 3. In this pseudo-color image, red corresponds to increased rCBF in the 12-month group and blue corresponds to decreased perfusion in the 13-month group. The whole perfusion discrepancy map (Figure 3A) shows a perfusion increase in the obitofrontal region, hippocampi, amygadalae, anterior cingulate gyri, auditory regions, parietal and the occipital regions in the 13-month group. Figure 3B shows the suprathresholded clusters, which have permutation probabilities less than 0.05 and cluster size greater than 80 voxels. Significant (P<0.05 permutation testing) perfusion increases were demonstrated in the anterior cingulate gyri, amygadalae, hippocampi, lateral obitofrontal cortex, auditory region, parietal and occipital regions. Perfusion decreases were observed in the right temporal lobe, right prefrontal region and the left putamen.
Figure 3.

The spatial relative CBF discrepancy map between the 13-month group and 7-month group. Red means greater in the 13-month group; blue means greater in the 7-month group. A) whole brain perfusion discrepancy map without thresholding, B) suprathresholded perfusion difference map with cluster size greater than 80; the threshold for permutation probability is P<0.05.
Discussion
This study demonstrates the feasibility of using ASL perfusion MRI as a noninvasive functional imaging method for studying developmental changes in regional brain function. Useable ASL data were obtained from a high percentage of infants studied while asleep, though due to the observed variability in absolute CBF maps group analyses had to be performed on relative CBF maps following normalization.
Based on rCBF data extracted from a priori ROIs determined from previous FDG-PET studies (Chugani and Phelps, 1986, Chugani et al., 1987), a significant relative perfusion increase (P<0.05) in prefrontal cortex and significant relative perfusion decrease (P<0.05) in the primary motor area were found in the 13-month cohort as compared to the 7-month cohort. Functional maturation of lower-order association anatomical structures precedes that of higher-order association areas (Kagan, 1972, Fuster, 1984, Goldman-Rakic, 1984, Gogtay et al., 2004), and the increasing CBF observed in the prefrontal ROI between 7 and 13 months coincides with the appearance of higher cortical and cognitive abilities associated with these regions (Kagan, 1972, Fuster, 2002, Shaw et al., 2006).
Through SVM based auto-classification, significant (P<0.05 permutation testing) perfusion increases were found in anterior cingulate gyri, amygadalae, hippocampi, lateral obitofrontal cortex, auditory region, parietal and occipital regions. Perfusion increase in the limbic regions (amygadalae, hippocampi, anterior cingulate) implies increasing development of emotion and memory skills in 13 month-olds as compared to 7 month-olds, and is also consistent with prior observations (Paterson et al., 2006, Grossmann and Johnson, 2007).
These ASL data were acquired as part of a longer multimodal MRI protocol using predefined parameters for the location of the CASL inversion plane. While this approach produced fairly consistent CBF values in prior adult studies, in the infant brain a larger variability of labeling efficiency probably occurred due to variability in positioning of the infant within a standard head coil. ASL data were also acquired at the end of the imaging session and may therefore also have been somewhat degraded by motion. Although the 3D imaging sequence used for ASL acquisition in the present study has the advantage of whole brain coverage and facilitates suppression of the static brain signal, it does not produce time series data that allow motion effects to be readily assessed. Future studies of infant development using ASL will require individualized labeling parameters to optimize CASL labeling efficiency, or the use of less sensitive pulsed ASL (PASL) labeling schemes that should be less sensitive to labeling geometry. Several recent improvements in ASL methodology including high field strength (Wang et al., 2002), parallel imaging (Wang et al., 2005), and pseudo-continuous labeling (Garcia et al., 2005) can also dramatically increase the signal-to-noise and hence the sensitivity and resolution of ASL perfusion MRI.
These findings suggest that ASL perfusion MRI should be useful in characterizing brain development even in infants studied during natural sleep without sedation. This was a cross-sectional study carried out in a relatively small number of subjects. The same approach carried out longitudinally in a larger cohort would provide markedly enhanced sensitivity for developmental changes. Functional localization can also be obtained with this approach by correlating regional changes in resting CBF with behavioral indices, based on the premise that changes in behavioral performance can be associated with stable changes in baseline brain function.
Acknowledgment
This work was supported by the Santa Fe Institute Consortium, and NIH grants: R01-HD29419, RR002305 and R03DA023496.
References
- Alsop DC, Detre JA. Multisection Cerebral Blood Flow MR Imaging with Continuous Arterial Spin Labeling. Radiology. 1998;208:410–416. doi: 10.1148/radiology.208.2.9680569. [DOI] [PubMed] [Google Scholar]
- Alsop DC, Detre JA, Grossman M. Assessment of cerebral blood flow in Alzheimer's disease by spin-labeled magnetic resonance imaging. Annals of neurology. 2000;47:93–100. [PubMed] [Google Scholar]
- Biagi L, Abbruzzese A, Bianchi MC, Alsop DC, Guerra AD, Tosetti M. Age dependence of cerebral perfusion assessed by magnetic resonance continuous arterial spin labeling. J Magn Reson Imaging. 2007;25(4):696–702. doi: 10.1002/jmri.20839. [DOI] [PubMed] [Google Scholar]
- Biswal BB, Ulmer JL. Blind source separation of multiple signal sources of fMRI data sets using independent component analysis. Journal of Computer Assisted Tomography. 1999;23:265–271. doi: 10.1097/00004728-199903000-00016. [DOI] [PubMed] [Google Scholar]
- Burges CJC. A Tutorial on Support Vector Machines for Pattern Recognition. Data Mining and Knowledge Discovery. 1998;2:121–167. [Google Scholar]
- Chalela JA, Alsop DC, Gonzalez-Atavales JB, Maldjian JA, Kasner SE, Detre JA. Magnetic Resonance Perfusion Imaging in Acute Ischemic Stroke Using Continuous Arterial Spin Labeling. Stroke. 2000;31:680–687. doi: 10.1161/01.str.31.3.680. [DOI] [PubMed] [Google Scholar]
- Chugani HT, Phelps ME. Maturational changes in cerebral function in infants determined by 18FDG positron emission tomography. Science. 1986;231:840–843. doi: 10.1126/science.3945811. [DOI] [PubMed] [Google Scholar]
- Chugani HT, Phelps ME, Mazziotta JC. Positron emission tomography study of human brain functional development. Annals of Neurology. 1987;22:487–497. doi: 10.1002/ana.410220408. [DOI] [PubMed] [Google Scholar]
- Dehaene-Lambertz G, Dehaene S, Hertz-Pannier L. Functional Neuroimaging of Speech Perception in Infants. Science. 2002;298:2013–2015. doi: 10.1126/science.1077066. [DOI] [PubMed] [Google Scholar]
- Dehaene-Lambertz G, Hertz-Pannier L, Dubois J, Mériaux S, Roche A, Sigman M, Dehaene S. Functional organization of perisylvian activation during presentation of sentences in preverbal infants. PNAS. 2006;103:14240–14245. doi: 10.1073/pnas.0606302103. [DOI] [PMC free article] [PubMed] [Google Scholar]
- Fuster JM. Behavioral electrophysiology of the prefrontal cortex. Trends in Neurosciences. 1984;7:408. [Google Scholar]
- Fuster JM. Frontal lobe and cognitive development. Journal of Neurocytology. 2002;31:373–385. doi: 10.1023/a:1024190429920. [DOI] [PubMed] [Google Scholar]
- Garcia DM, Bazelaire C. d., Alsop DC. Pseudo-continuous Flow Driven Adiabatic Inversion for Arterial Spin Labeling. Proceedings of the Proc. Intl. Soc. Mag. Reson. Med., Miami. 2005:13. [Google Scholar]
- Gogtay N, Giedd JN, Lusk L, Hayashi KM, Greenstein D, Vaituzis AC, Tom F. Nugent I, Herman DH, Clasen LS, Toga AW, Rapoport JL, Thompson PM. Dynamic mapping of human cortical development during childhood through early adulthood. PNAS. 2004;101:8174–8179. doi: 10.1073/pnas.0402680101. [DOI] [PMC free article] [PubMed] [Google Scholar]
- Goldman-Rakic PS. The frontal lobes: Uncharted provinces of the brain. Trends in Neurosciences. 1984;7:425. [Google Scholar]
- Golub GH, Loan CFV. Matrix Computations. 1996 [Google Scholar]
- Greicius MD, Krasnow B, Reiss AL, Menon V. Functional connectivity in the resting brain: A network analysis of the default mode hypothesis. Proceedings of the National Academy of Sciences. 2003;100:253–258. doi: 10.1073/pnas.0135058100. [DOI] [PMC free article] [PubMed] [Google Scholar]
- Greicius MD, Srivastava G, Reiss AL, Menon V. Default-mode network activity distinguishes Alzheimer's disease from healthy aging: Evidence from functional MRI. PNAS. 2004;101:4637–4642. doi: 10.1073/pnas.0308627101. [DOI] [PMC free article] [PubMed] [Google Scholar]
- Grossmann T, Johnson MH. The development of the social brain in human infancy. European Journal of Neuroscience. 2007;25:909–919. doi: 10.1111/j.1460-9568.2007.05379.x. [DOI] [PubMed] [Google Scholar]
- He X, Yablonskiy DA. Quantitative BOLD: Mapping of human cerebral deoxygenated blood volume and oxygen extraction fraction: Default state. Magnetic Resonance in Medicine. 2007;57:115–126. doi: 10.1002/mrm.21108. [DOI] [PMC free article] [PubMed] [Google Scholar]
- Hoffman JM, Guze BH, Baxter LR, Mazziotta JC, Phelps ME. [18F]-fluorodeoxyglucose (FDG) and positron emission tomography (PET) in aging and dementia. A decade of studies. Eur Neurol. 1989;29:16–24. doi: 10.1159/000116476. [DOI] [PubMed] [Google Scholar]
- Huang C, Mattis P, Tang C, Perrine K, Carbon M, Eidelberg D. Metabolic brain networks associated with cognitive function in Parkinson's disease. NeuroImage. 2007;34:714–723. doi: 10.1016/j.neuroimage.2006.09.003. [DOI] [PMC free article] [PubMed] [Google Scholar]
- Iannetti GD, Zambreanu L, Wise RG, Buchanan TJ, Huggins JP, Smart TS, Vennart W, Tracey I. Pharmacological modulation of pain-related brain activity during normal and central sensitization states in humans. PNAS. 2005;102:18195–18200. doi: 10.1073/pnas.0506624102. [DOI] [PMC free article] [PubMed] [Google Scholar]
- Joachim T. Making large-Scale SVM Learning Practical. In: Schölkopf B, et al., editors. Advances in Kernel Methods - Support Vector Learning. Cambridge Boston: 1999. pp. 42–56. [Google Scholar]
- Kadir A, Almkvist O, Wall A, Längström B, Nordberg A. PET imaging of cortical 11C-nicotine binding correlates with the cognitive function of attention in Alzheimer's disease. Psychopharmacology. 2006;188:509–520. doi: 10.1007/s00213-006-0447-7. [DOI] [PubMed] [Google Scholar]
- Kagan J. Do infants think? Sci Am. 1972;226:74. doi: 10.1038/scientificamerican0372-74. [DOI] [PubMed] [Google Scholar]
- LaConte S, Strother S, Cherkassky V, Anderson J, Hu X. Support vector machines for temporal classification of block design fMRI data. NeuroImage. 2005;26:317–329. doi: 10.1016/j.neuroimage.2005.01.048. [DOI] [PubMed] [Google Scholar]
- Liao J-R, Pauly JM, Brosnan TJ, Pelc NJ. Reduction of Motion Artifacts in Cine MRI Using Variable-Density Spiral Trajectories. Magnetic Resonance in Medicine. 1997;37:569–575. doi: 10.1002/mrm.1910370416. [DOI] [PubMed] [Google Scholar]
- Maldjian JA, Laurienti PJ, Kraft RA, Burdette JH. An automated method for neuroanatomic and cytoarchitectonic atlas-based interrogation of fMRI data sets. Neuroimage. 2003;19:1233–1239. doi: 10.1016/s1053-8119(03)00169-1. [DOI] [PubMed] [Google Scholar]
- Meyer CH, Hu BS, Nishimura DG, Macovski A. Fast spiral coronary artery imaging. Magnetic Resonance in Medicine. 1992;28:202–213. doi: 10.1002/mrm.1910280204. [DOI] [PubMed] [Google Scholar]
- Mourão-Miranda J, Bokde ALW, Born C, Hampel H, Stetter M. Classifying brain states and determining the discriminating activation patterns: Support Vector Machine on functional MRI data. NeuroImage. 2005;28:980–995. doi: 10.1016/j.neuroimage.2005.06.070. [DOI] [PubMed] [Google Scholar]
- Nichols TE, Holmes AP. Nonparametric Permutation Tests for Functional Neuroimaging: A Primer with Examples. Human Brain Mapping. 2002;15:1–25. doi: 10.1002/hbm.1058. [DOI] [PMC free article] [PubMed] [Google Scholar]
- Paterson SJ, Badridze N, Flax JF, Liu WC, Benasich AA. A protocol for structural MRIs of non-sedated infants. Proceedings of the Proceedings of the Journal of Cognitive Neuroscience, San Francisco. 2004;15:F124. [Google Scholar]
- Paterson SJ, Heim S, Friedman JT, Choudhury N, Benasich AA. Development of structure and function in the infant brain: Implications for cognition, language and social behaviour. Neuroscience and Biobehavioral Reviews. 2006;30:1087–1105. doi: 10.1016/j.neubiorev.2006.05.001. [DOI] [PMC free article] [PubMed] [Google Scholar]
- Raichle ME, MacLeod AM, Snyder AZ, Powers WJ, Gusnard DA, Shulman GL. A default mode of brain function. PNAS. 2001;98:676–682. doi: 10.1073/pnas.98.2.676. [DOI] [PMC free article] [PubMed] [Google Scholar]
- Rao H, Gillihan SJ, Wang J, Korczykowski M, Sankoorikal GM, Kaercher KA, Brodkin ES, Detre JA, Farah MJ. Genetic Variation in Serotonin Transporter Impacts Default Amygdala Function in Healthy Brain. Biological Psychiatry. 2007;62(6):600–6. doi: 10.1016/j.biopsych.2006.11.028. [DOI] [PubMed] [Google Scholar]
- Rombouts SARB, Scheltens P, Kuijer JPA, Barkhof F. Whole brain analysis of T2* weighted baseline FMRI signal in dementia. Human Brain Mapping. 2007 doi: 10.1002/hbm.20349. electronic publication online. [DOI] [PMC free article] [PubMed] [Google Scholar]
- Shaw P, Greenstein D, Lerch J, Clasen L, Lenroot R, Gogtay N, Evans A, Rapoport J, Giedd J. Intellectual ability and cortical development in children and adolescents. Nature. 2006;440:676–679. doi: 10.1038/nature04513. [DOI] [PubMed] [Google Scholar]
- Small SA, Wu EX, Bartsch D, Perera GM, Lacefield CO, DeLaPaz R, Mayeux R, Stern Y, Kandel ER. Imaging Physiologic Dysfunction of Individual Hippocampal Subregions in Humans and Genetically Modified Mice. Neuron. 2000;28:653–664. doi: 10.1016/s0896-6273(00)00144-6. [DOI] [PubMed] [Google Scholar]
- Souweidane MM, Kim KHS, McDowall R, Ruge MI, Lis E, Krol G, Hirsch J. Brain Mapping in Sedated Infants and Young Children with Passive-Functional Magnetic Resonance Imaging. Pediatric Neurosurgery. 1999;30:86–92. doi: 10.1159/000028768. [DOI] [PubMed] [Google Scholar]
- Spielman DM, Pauly JM, Meyer CH. Magnetic Resonance Fluoroscopy Using Spirals with Variable Sampling Densities. Magnetic Resonance in Medicine. 1995;34:388–394. doi: 10.1002/mrm.1910340316. [DOI] [PubMed] [Google Scholar]
- Vetterling WT, Flannery BP. Numerical Recipes in C++: The Art of Scientific Computing. 2002 [Google Scholar]
- Wang JJ, Alsop DC, Li L, Listerud J, Gonzalez-At JB, Schnall MD, Detre JA. Comparison of quantitative perfusion imaging using arterial spin labeling at 1.5 and 4 telsa. Magnetic Resonance in Medicine. 2002;48:242–254. doi: 10.1002/mrm.10211. [DOI] [PubMed] [Google Scholar]
- Wang Z, Aguirre GK, Rao H, Wang J, Fernández-Seara MA, Childress AR, Detre JA. Empirical optimization of ASL data analysis using an ASL data processing toolbox: ASLtbx. Magn Reson Imaging. 2007a doi: 10.1016/j.mri.2007.07.003. (2007 Sep 7, Epub online) doi:10.1016/j.mri.2007.07.003. [DOI] [PMC free article] [PubMed] [Google Scholar]
- Wang Z, Childress AR, Wang J, Detre JA. Support Vector Machine Learning-based fMRI Data Group Analysis. NeuroImage. 2007b;36:1139–1151. doi: 10.1016/j.neuroimage.2007.03.072. [DOI] [PMC free article] [PubMed] [Google Scholar]
- Wang Z, Detre JA, Childress AR. Boost up the Detection Sensitivity of ASL Perfusion Fmri through Support Vector Machine; Proceedings of the 28th IEEE EMBS Annual International Conference; New York City. 2006. pp. 1006–1009. [DOI] [PubMed] [Google Scholar]
- Wang Z, Wang J, Connick TJ, Wetmore GS, Detre JA. Continuous ASL (CASL) Perfusion MRI with An Array coil and Parallel Imaging at 3T. Magnetic Resonance in Medicine. 2005;54:732–737. doi: 10.1002/mrm.20574. [DOI] [PubMed] [Google Scholar]
- Williams DS, Detre JA, Leigh JS, Koretsky AP. Magnetic resonance imaging of perfusion using spin inversion of arterial water. Proceedings of the National Academy of Sciences. 1992;89:212–216. doi: 10.1073/pnas.89.1.212. [DOI] [PMC free article] [PubMed] [Google Scholar]
- Ye FQ, Frank JA, Weinberger DR, McLaughlin AC. Noise reduction in 3D perfusion imaging by attenuating the static signal in arterial spin tagging (ASSIST) Magnetic Resonance in Medicine. 2000;44:92–100. doi: 10.1002/1522-2594(200007)44:1<92::aid-mrm14>3.0.co;2-m. [DOI] [PubMed] [Google Scholar]
- Zarahn E, Aguirre GK, D'Esposito M. Empirical Analyses of BOLD fMRI Statistics, I. Spatially Unsmoothed Data Collected under Null-Hypothesis and Experimental Conditions. Neuroimage. 1997;5:179–197. doi: 10.1006/nimg.1997.0263. [DOI] [PubMed] [Google Scholar]