

Abstract
This paper presents computational methods to analyze MALDI-TOF mass spectrometry data for quantitative comparison of peptides and glycans in serum. The methods are applied to identify candidate biomarkers in serum samples of 203 participants from Egypt; 73 hepatocellular carcinoma (HCC) cases, 52 patients with chronic liver disease (CLD) consisting of cirrhosis and fibrosis cases, and 78 population controls. Two complementary sample preparation methods were applied prior to generating mass spectra: (1) low molecular weight (LMW) enrichment of each serum sample was carried out for MALDI-TOF quantification of peptides, and (2) glycans were enzymatically released from proteins in each serum sample and permethylated for MALDI-TOF quantification of glycans. A peak selection algorithm was applied to identify the most useful peptide and glycan peaks for accurate detection of HCC cases from high-risk population of patients with CLD. In addition to global peaks selected by the whole population based approach, where identically labeled patients are treated as a single group, subgroup-specific peaks were identified by searching for peaks that are differentially abundant in a subgroup of patients only. The peak selection process was preceded by peak screening, where we eliminated peaks that have significant association with covariates such as age, gender, and viral infection based on the peptide and glycan spectra from population controls. The performance of the selected peptide and glycan peaks was evaluated in terms of their ability in detecting HCC cases from patients with CLD in a blinded validation set and through the cross-validation method. Finally, we investigated the possibility of using both peptides and glycans in a panel to enhance the diagnostic capability of these candidate markers. Further evaluation is needed to examine the potential clinical utility of the candidate peptide and glycan markers identified in this study.
Keywords: Liver cancer, proteomics, glycomics, peak selection
1. Introduction
Current diagnosis of hepatocellular carcinoma (HCC) relies on clinical information, liver imaging, and measurement of serum alpha-fetoprotein (AFP). The reported sensitivity (41-65%) and specificity (80-94%) of AFP is not sufficient for early diagnosis and additional markers are needed.1, 2
Mass spectrometry (MS) provides a rich source of information for molecular characterization of the disease process. The feasibility of MS-based proteomic analysis to distinguish HCC from cirrhosis, particularly in patients with hepatitis C viral (HCV) infection, has been studied.3-6 Recent proteomic studies have identified potential markers of HCC including complement C3a7, kappa and lambda immunoglobulin light chains8, and heat-shock proteins (Hsp27, Hsp70, and GRP78).9 The characterization of glycans in serum of patients with liver disease is also a promising strategy for biomarker discovery.10 Many currently used cancer biomarkers including AFP are glycoproteins.11 Fucosylated AFP was introduced as a marker of HCC with improved specificity12, 13 and other glycoproteins including GP73 are currently under evaluation as markers of HCC.14, 15 The analysis of protein glycosylation is particularly relevant to liver pathology because of the major influence of this organ on the homeostasis of blood glycoproteins.16, 17 An alternative strategy to the analysis of glycoproteins is the analysis of protein associated glycans.18, 19
Current methods allow quantitative comparison of low molecular weight (LMW) enriched peptides as well as permethylated glycan structures by matrix-assisted laser desorption/ionization time-of-flight (MALDI-TOF) MS.20 Although MALDI-TOF MS continuously improves in sensitivity and accuracy, it is characterized by its high dimensionality and complex patterns with substantial amount of noise. Biological variability and disease heterogeneity in human populations further complicate the MALDI-TOF MS-based biomarker discovery studies.
In this paper, we present computational methods for analysis of MALDI-TOF MS to discover candidate peptide and glycan biomarkers for the detection of HCC in a high-risk Egyptian population with chronic liver disease (CLD), consisting of fibrosis and cirrhosis patients.21, 22 A global peak selection method is applied to search for a panel of peaks that distinguishes HCC from CLD at the whole population level, where all HCC patients are treated as a single group. The method combines ant colony optimization (ACO) and support vector machine (SVM), previously described in,4, 5 to systematically search for the most useful panel of peaks from a large number of candidate peaks without requiring an exhaustive search, where all possible combinations are examined. Although some of the individual peaks identified by the hybrid ACO-SVM method may be attributed to subgroups of patients, neither these subgroup-specific peaks nor the subgroups they represent can be readily isolated due to the unknown and mostly nonlinear interactions of the peaks. In this paper, in addition to searching for global peaks, we propose to apply a genetic algorithm (GA) to extract subgroup-specific peaks that are differentially abundant in a subset of HCC patients. The disease state of an unknown individual is determined by an SVM classifier built using a panel of subgroup-specific peaks. Although in most cases global peaks seem to provide better disease detection capability than subgroup-specific peaks, the latter present the potential for more transparent and patient-specific biomarkers.
2. Methods
2.1.Sample collection
HCC cases and controls were enrolled in collaboration with the National Cancer Institute of Cairo University, Egypt, from 2000 to 2002, as described previously.22 Briefly, adults with newly diagnosed HCC aged 17 and older without a previous history of cancer were eligible for the study. Diagnosis of HCC was confirmed by pathology, cytology, imaging (CT, ultrasound), and serum AFP. Controls were recruited from the orthopedic department of Kasr El Aini Faculty of Medicine, Cairo University.22 17 HCC cases were classified as early (Stage I and II) and 33 HCC cases as advanced (Stage III and IV) according to the staging system 23; for the remaining 23 HCC cases the available information was not sufficient to assign the stage. Patients with CLD were recruited from Ain Shams University Specialized Hospital and Tropical Medicine Research Institute, Cairo, Egypt during the same period. The CLD group has a biopsy confirmed 21 fibrosis and 25 cirrhosis patients; 6 individuals in the CLD group did not have sufficient clinical information. Patients negative for hepatitis B virus (HBV) infection, positive for HCV RNA, and with AFP less than 100 ng/ml were selected for this study. All participants signed informed consent, provided a blood sample, and answered a questionnaire with demographic information, personal habits, medical history, and occupational history. The study protocol was approved by the institutional review committee at all participating institutions and conformed to the ethical guidelines of the 1975 Helsinki Declaration.
Blood samples were collected by a trained phlebotomist each day around 10 am and processed within a few hours according to a standard protocol. Aliquots of sera were frozen at -80 °C immediately after collection until analysis; all mass spectrometric measurements were performed on twice-thawed sera. Each patient’s HBV and HCV viral infection status was assessed by enzyme immunoassay for anti-HCV, anti-HBC, and HBsAg, and by PCR for HCV RNA.22, 24
2.2.Serum preparation and MALDI-TOF quantification of peptides
We utilized an enrichment procedure to analyze native peptides in the LMW fraction of serum using MALDI-TOF MS as described previously.3 Briefly, serum samples (15 μL) were desalted on C8 magnetic beads and ultrafiltered in 25% acetonitrile on 50 kDa Microcon membranes. Ultrafiltrates were spotted on AnchorChip MALDI target with CHCA matrix (3.3 mg/mL in 50% acetonitrile). Samples were analyzed on an Ultraflex MALDI -TOF/TOF mass spectrometer (Bruker Daltonics, Billerica, MA). Ionization was achieved by irradiation with a nitrogen laser (λ = 337 nm) operating at 20 Hz. An average of 50 shots at each of 20 positions was collected for a total of 1000 shots/spot; the positions were taken in an automated spiral pattern radiating out from the center of the anchorchip spot. Anchorchip plate locations were calibrated prior to each run. Positive ions were accelerated at 19 kV with 80 nsec of pulsed ion extraction delay. Each spectrum was recorded in linear positive mode and was externally calibrated using a standard mixture of peptides. 203 mass spectra were acquired using the Flex Control and Flex Analysis software (Bruker Daltonics, Billerica, MA) and raw data were exported as text files for further analysis. Each spectrum consisted of about 136,000 m/z values with the corresponding intensities in the mass range of 900 to 10,000 Da.
To sequence peptides, an exploratory scan from 800 to 5000 Da was performed in the reflectron mode to assign a mass window (~0.5% mass width) for fragmentation and peptide sequencing in the “LIFT” MS/MS mode. Additional peptide sequencing was carried out on a 4800 MALDI TOF/TOF™ Analyzer (Applied Biosystems, CA). Analysis was carried out in positive ion mode in both reflector and MS/MS acquisitions with laser repetition rate at 200 Hz. In both reflector and MS/MS mode, the instrument default calibration was used. The positive ion reflector spectra were obtained for the peptide mix in 800-4000 mass range. In MS/MS mode, 2 kV collision energy (with CID gas ON) was used to fragment the peptides. The database searches for peptide identification were performed using MASCOT Distiller 2.1 (Matrix Science, http://www.matrixscience.com). No enzyme was used in this search and both MS and MS/MS tolerance was 0.3 Da.
2.3.Sample preparation and MALDI-TOF quantification of glycans
The sample preparation for quantification of glycans involved enzymatic release of N-glycans from glycoproteins, extraction of N-glycans, and solid-phase permethylation as described previously.20 The resulting permethylated glycans were spotted on a MALDI plate with DHB-matrix, MALDI plate was dried under vacuum, and mass spectra were acquired using a 4800 MALDI TOF/TOF analyzer equipped with a Nd:YAG 355-nm laser as described previously.18 MALDI-spectra were recorded in positive-ion mode, since permethylation eliminates the negative charge normally associated with sialylated glycans.25 203 raw spectra were exported as text files for further analysis. Each spectrum consisted of approximately 121,000 m/z values with the corresponding intensities in the mass range of 1,500-5,500 Da.
2.4.Global peak selection
Figure 1 illustrates our approach for global peak selection, which begins by splitting the spectra into a labeled set and a blinded set. The labeled set consists of a subset of HCC cases, a subset of CLD cases, and all population controls (people without manifest liver disease). The blinded set comprises of masked HCC and CLD cases; this set is used to evaluate the generalization capability of the peaks selected on the basis of the labeled set. Spectral preprocessing (i.e., outlier screening, binning, baseline correction, and normalization), peak detection, peak calibration, peak screening, and peak selection are performed on the labeled set by subjecting the entire process to cross-validation as outlined below.
Figure 1.
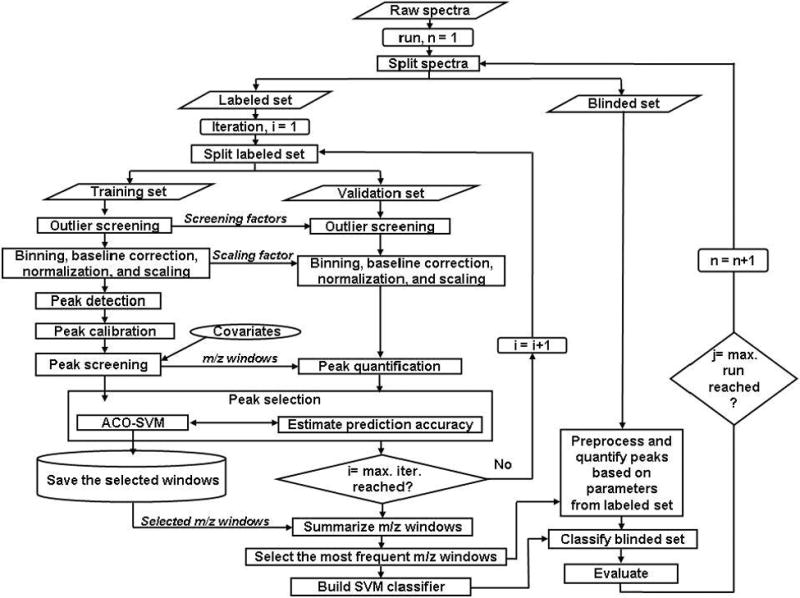
Methodology for global peak detection.
Spectral preprocessing
As illustrated in Figure 1, a subset of the labeled HCC and CLD spectra is randomly selected at each iteration as a training set, while the remaining HCC and CLD spectra are used as a validation set. A spectrum in the training set is considered as an outlier, if its record count or total ion current (TIC) is more than three standard deviations away from the median record count or TIC, respectively, of the spectra within the training set. Outliers are removed from the subsequent analyses. The remaining training spectra are binned, baseline corrected, and normalized as described previously.5
Peak detection and calibration
After scaling the peak intensities of the normalized training spectra to an over all maximum intensity of 100, local maximum peaks above a specified threshold are identified. Peaks that fall within a pre-specified mass separation are coalesced into a single m/z window to account for drift in m/z location and to represent isotopic clusters by a single peak. The maximum intensity in each window is used as the variable of interest.
Peak screening
Logistic regression models are used to examine association of the peaks to known covariates including age, gender, smoking status, residency, HCV and HBV viral infections. This analysis is performed on the samples from population controls to unambiguously isolate peaks associated to the covariates. The independent variables of a logistic regression model are the intensities of a given peak across all population control samples. The dependent variable is the status of a given covariate; all covariates in this study have binary values including age (young vs. old, separated by the median of the subjects in the population controls). The association of every peak to each covariate was determined on the basis of the corresponding statistical significance (p<0.01) in fitting a logistic regression model. Peak intensities associated to the covariates are removed.
Peak selection
Following peak screening, ACO-SVM searches for a peak set that consists of a pre-specified number of peaks. The peak set is selected on the basis of its ability to distinguish a subset of the HCC and CLD spectra in the validation set. Note that the spectra in the validation set are not involved in the spectral preprocessing, peak detection, peak calibration, and peak screening steps. They are screened for outliers, binned, baseline corrected, normalized, and scaled on the basis of the parameters used to preprocess the spectra in the training set. These parameters include the screening factors (median record count and TIC) and scaling factor that standardizes the peaks in the training set to have a maximum of 100. The peaks in the validation set are quantified at the selected m/z windows and are presented to SVM classifier previously trained using the peaks from the training set. The performance of the SVM classifier in predicting the disease state of the subjects in the validation set is used by ACO-SVM to guide its search for the optimal peak set.
The above steps (spectral preprocessing, peak detection, peak calibration, peak screening, and peak selection) are repeated multiple times by randomly splitting the labeled spectra into training and validation sets with resubstitution. The peaks selected in multiple iterations are summarized by merging overlapping m/z windows to determine the most frequently selected m/z windows. Note that the number of peaks detected and the size of the m/z windows could vary due to the change in the population set at each iteration.
To evaluate the peak selection process, we quantify the peak intensities at the m/z windows of the final peak set in both the labeled and blinded sets. Note that the blinded set is not used during the entire peak selection process, thus it serves as an independent set to evaluate the generalization capability of the selected peaks. The spectra in the blinded set are outlier screened, binned, baseline corrected, normalized, and scaled on the basis of parameters used to preprocess the spectra in the labeled set. We build an SVM using the labeled set and evaluate the capability of the SVM classifier in terms of sensitivity and specificity in distinguishing HCC from CLD in the blinded set.
For further evaluation of the selected peaks and to examine the consistency of the proposed methodology, we repeat the entire peak selection process by randomly splitting the spectra into labeled and blinded sets with resubstitution (Figure 1). The frequency of occurrence of the resulting summarized peaks and the corresponding sensitivity and specificity in multiple runs are evaluated.
2.5.Identification of subgroup-specific peaks
We present here our proposed method to identify peaks that are differentially abundant in a subset of patients. As in the global peak selection process, the algorithm starts by randomly splitting the spectra into a labeled and a blinded set. Spectral preprocessing, peak detection, peak calibration, and peak screening methods are applied to the labeled set following the same procedure described previously in Section 2.4. In the following, we describe the remaining steps by dividing them into two phases (training and operation) as illustrated in Figure 2.
Figure 2.
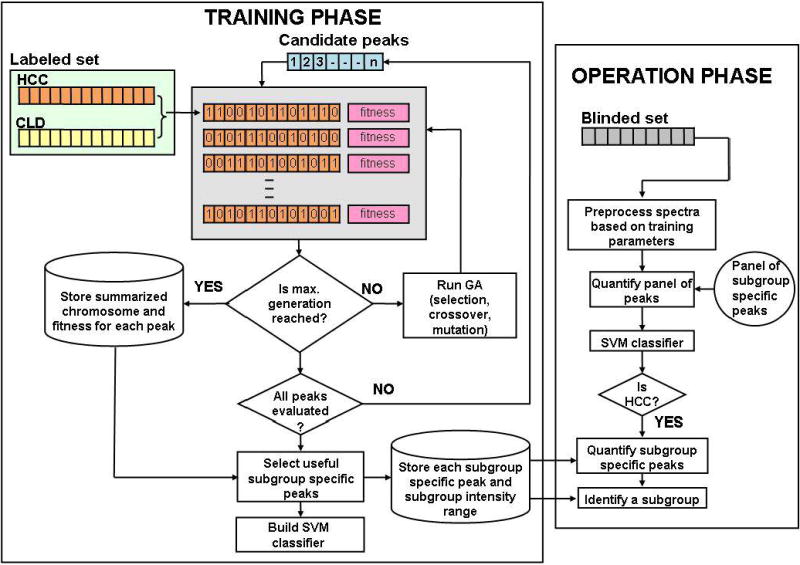
Methodology for subgroup-specific peak selection.
In the training phase, for each candidate peak that survived peak screening, we apply GA to search for a subgroup of HCC cases in which the peak is differentially abundant compared to CLD cases. A chromosome in the GA assigns a binary bit for each HCC patient in the labeled set (“1” for a patient selected in the subgroup, “0” otherwise). The algorithm starts with a set of random binary bits in each chromosome. GA evolves the chromosomes with the aim of maximizing a fitness function, which involves the following two parameters (1) the area under the ROC (AuROC) obtained in using the peak to separate a selected subgroup of HCC patients from patients with CLD and (2) the number of HCC patients involved in the subgroup. The goal is to search for a peak and a subgroup that not only lead to good separation between the selected HCC subgroup and all patients with CLD in the labeled set, but also assign a sufficiently large number of subjects to the subgroup. An SVM classifier is built using a panel of subgroup-specific peaks selected on the basis of their fitness values. During the operation phase, the peaks in the blinded set are quantified based on the parameters previously used to quantify the peaks in the training set. These peaks are presented to previously built SVM classifier to detect the disease state of the samples in the blinded set. The subgroup-specific peaks provide the potential to determine the subgroup an HCC patient belongs to. For example, if the SVM classifier assigns an HCC label to a blinded spectrum, then its intensities corresponding to the subgroup-specific peaks can be compared to determine which subgroup the individual belongs to, i.e., the subject is assigned to a previously identified subgroup, if its peaks intensity falls within the subgroup’s intensity range.
The above procedure is repeated multiple times by randomly splitting the spectra into labeled and blinded sets with resubstitution. The sensitivity and specificity of the selected subgroup-specific peaks in distinguishing the subjects in the blinded set are examined in multiple runs. Finally, the peaks are summarized to determine the most frequently selected subgroup-specific m/z windows.
3. Results
MALDI-TOF analyses of LMW enriched peptides and permethylated N-glycans enzymatically detached from serum proteins were performed on serum samples from 203 participants that consist of 73 HCC, 52 CLD, and 78 population control subjects.
3.1.Global peak selection
The methodology depicted in Figure 1 was applied to separate analyses of the peptide and glycan MALDI-TOF spectra. The serum samples were split into a labeled set (35 HCC, 35 CLD, and 78 population controls) and a blinded set (38 HCC and 17 CLD).
From the labeled set, 25 HCC and 25 CLD spectra were randomly selected as a training set and were used together with the 78 population control spectra for peak selection; the remaining 10 HCC and 10 CLD spectra were used as a validation set. Outlier screening was performed on the training set. While spectra with record count and TIC within three standard deviations from their corresponding median values in the training set were kept, other spectra were removed from subsequent analyses. Based on the screening factors calculated through the training spectra, the spectra in the validation set were also screened for outliers. This procedure removed one population control subject and one CLD subject from the glycan spectra and at most two HCC and two population control subjects were removed from the peptide spectra. Note that the outlier screened spectra slightly vary depending on which spectra are in the training or validation sets. The following analyses were performed on the training spectra that passed outlier screening. A binning algorithm reduced the dimension of the peptide spectra from ~136,000 to 23,846 m/z bins and the dimension of glycan spectra was reduced from ~121,000 to 13,030 m/z bins using a bin size of 100 ppm. The mean of the intensities within each bin was used as the bin intensity. For each binned spectrum, we estimated the baseline by obtaining the minimum value within a shifting window size of 50 bins and a step size of 50 bins. Spline approximation was applied to regress the varying baseline. The regressed baseline was smoothed using the lowess smoothing method. The resulting baseline was subtracted from the spectrum. Then, each spectrum was normalized by dividing it by its total ion current. The spectra were scaled to have a maximum intensity of 100. Local maximum peaks with scaled intensity levels greater than a threshold intensity of 5 were identified and nearby peaks within 300 ppm mass separation were coalesced into a single m/z window. The maximum intensity in each m/z window was used as the variable of interest. This procedure yielded about ~240 m/z windows from the peptide spectra and ~90 m/z windows from the glycan spectra in multiple runs with different training sets. Note that the actual number of m/z windows varies based on the population in the training set. The peak screening step eliminated about 20% of the m/z windows. From the remaining m/z windows, ACO-SVM algorithm selected the most useful set of five peaks. The capability of potential peak sets to predict the labels of the spectra in the validation set was used by ACO-SVM as a criterion to search for the optimal peak set. The spectra in the validation set were preprocessed in the same way as the training set. The scaling factor from the training set was utilized to scale the validation spectra. The intensity values of the validation spectra were quantified within the selected m/z windows and the maximum intensities within the windows were used as input to SVM classifier built previously using the training set.
The above procedure was repeated 100 times by randomly selecting (with resubstitution) 25 HCC and 25 CLD spectra from the labeled set as a training set and using the remaining 10 HCC and 10 CLD spectra as a validation set. The peaks selected in 100 runs were summarized by merging overlapping windows. Figures 3A and 3B depict frequency plots of the 59 summarized peptide peaks (represented by their m/z windows) and 42 summarized glycan peaks over 100 runs, respectively. As shown in the figures, the first three peptide/glycan peaks were selected in more than 50% of the runs. We quantified the peptide and glycan peaks in the labeled set (35 HCC and 35 CLD spectra) within these m/z windows and applied the maximum intensity values within the windows to build two SVM classifiers, one SVM using the peptide peaks and another one using the glycan peaks. To evaluate the performance of the SVM classifiers, we preprocessed the spectra in the blinded set in the same way as the training set and quantified the peptide and glycan peak intensities within the selected summarized m/z windows. These intensities were presented to the SVM classifiers. The SVM classifier that used the three peptide peaks distinguished the samples in the blinded set with 81% sensitivity and 63% specificity, while the SVM classifier that used the glycan peaks yielded 87% sensitivity and 88% specificity. In addition, we tested the simultaneous use of these candidate peptide and glycan biomarkers. Using the peak intensities quantified at the three peptide and three glycan m/z windows in the labeled set, we trained an SVM classifier. The classifier yielded 89% sensitivity and 94% specificity in distinguishing the samples in the blinded set.
Figure 3.

Frequency of occurrence of global peptide peaks (A) and global glycan peaks (B) selected by ACO-SVM in 100 iterations by randomly splitting a labeled set into training and validation sets. The 10 most frequent m/z windows are shown.
To examine how the peak selection process is impacted by the subset of labeled spectra used for peak selection, we repeated the entire peak selection process 10 times by randomly splitting the spectra into labeled and blinded with resubstitution. The average sensitivity and average specificity the top three peptides yielded in distinguishing samples in the blinded set were 81±9 % and 89±14%, respectively; the 9% and 14% indicate the standard deviations. The top three glycans yielded an average of 93±4% sensitivity and an average of 94±3% specificity. Combining the top three peptide peaks with the top three glycan peaks resulted in 97±4% and 96±5% average sensitivity and specificity, respectively. While no significant improvement was found in specificity of these candidate biomarkers, we observed a statistically significant improvement in sensitivity (p<0.05) when combining the peptide peaks with the glycan peaks. Figures 4A and B show the frequency of occurrence of the top 10 peptide and top 10 glycan peaks obtained in 10 runs, respectively. As shown in the figures, four peptide peaks and two glycan peaks were selected in all 10 runs.
Figure 4.

Frequency of occurrence of the top 10 peptide peaks (A) and top 10 glycan peaks (B) selected in 10 runs by randomly splitting the entire spectra into labeled and blinded sets. Note that the top 10 peptide and 10 glycan peaks in each run were found through 100 ACO-SVM iterations by randomly splitting the labeled set into training and validation sets at each iteration. The 10 most frequent m/z windows are listed.
3.2.Subgroup specific peak selection
To identify subgroup-specific peaks, we applied the methodology depicted in Figure 2 for the glycan and peptide MALDI-TOF spectra separately. The serum samples were split into a labeled set (35 HCC, 35 CLD, and 78 population controls) and a blinded set (38 HCC and 17 CLD). Spectral preprocessing, peak detection, peak calibration, and peak screening methods were applied to the labeled set following the same procedure described previously in Section 2.4. From the peaks that survived peak screening, we selected those that were differentially abundant in a subgroup of patients using GA. We sorted the peaks on the basis of their fitness values. We built SVM classifiers with the top three m/z windows. To evaluate the performance of the SVM classifiers, we preprocessed the spectra in the blinded set in the same way as the labeled set and quantified the intensities within the selected m/z windows. We removed outliers from the blinded set using the criteria established through the labeled set. The peak intensities of the remaining spectra were presented to the previously built SVM classifiers to determine the sensitivity and specificity in distinguishing HCC cases from CLD cases in the blinded set. We repeated the above analyses 10 times by randomly splitting the spectra into labeled and blinded sets with resubstitution. The average sensitivity and specificity obtained by using the top three peptides were 81±8% and 88±10%, respectively. The top three glycans yielded average 91±3% sensitivity and average 95±3% specificity. Combining the top three peptide peaks with the top three glycan peaks resulted in average 94±3% sensitivity and average 90±6% specificity. Figures 5A and B show the frequency of occurrence of the top 10 peptide and top 10 glycan local peaks in 10 runs, respectively; one peptide peak and four glycan peaks were selected in all 10 runs.
Figure 5.

Frequency of occurrence of the top 10 peptide local peaks (A) and top 10 local glycan peaks (B) selected in 10 runs by randomly splitting the entire spectra into labeled and blinded sets. The 10 most frequent m/z windows are listed.
3.3.Comparison of global and subgroup specific peaks
In terms of sensitivity and specificity in distinguishing the samples in the blinded set, both global and local (subgroup specific) peaks resulted in very close results. We compared the peaks that were selected in those two approaches to examine the overlap and difference between the local and global peaks. Figures 6A and 6B depict the frequency of occurrence of the peptide and glycan peaks, respectively, selected in 10 global and 10 local peak selection runs. Note that the m/z window sizes are adjusted to merge overlapping m/z windows. One peptide and one glycan peak represented by m/z windows 2372.7-2387.7 and 2873.9-2884.8, respectively, were present in the top 10 selected peaks in each of the 10 local and 10 global peak runs.
Figure 6.

Frequency of occurrence of the top 10 global and top 10 local peptide peaks (A) and top 10 global and top 10 local glycan peaks (B) selected in 10 global and 10 local peak selection processes. The 10 most frequent m/z windows are listed.
3.4.Identification of peptides and glycan structures
Preliminary sequencing results show that one of the most frequently selected global peptide markers (m/z windows 1861.1-1873.0) was identified with high probability (MASCOT ion score 99, expectation value 3.5e-6) as a fragment of complement C3 with sequence SSKITHRIHWESASLL. Sequencing of the remaining peptides is under way. Glycan structures for nearly 50% of the peaks detected by the MALDI-TOF MS were determined. Six out of the top 10 local and global glycan peaks presented in Figure 6B have a known sugar composition. Figure 7 depicts an overlay of the average HCC and CLD glycan spectra along with the sugar compositions of these six glycan structures.
Figure 7.
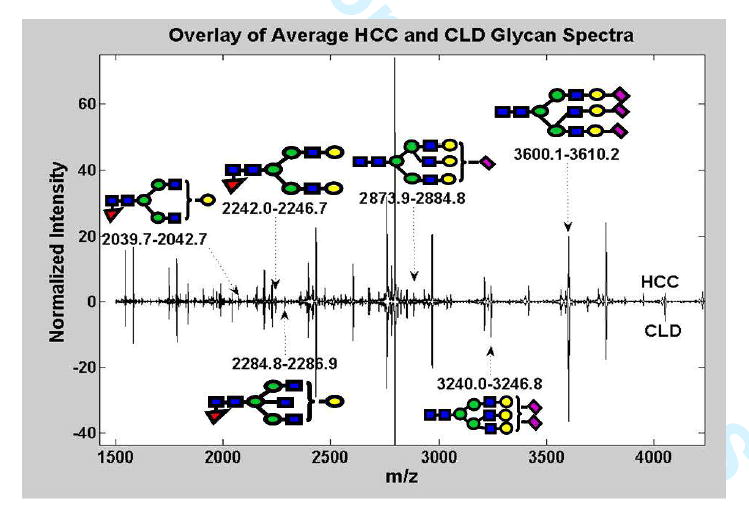
Mean HCC and CLD glycan MALDI-TOF spectra. The sugar composition of some of the most frequently selected global and local glycan peaks are shown.
4. Discussion
This paper introduces computational methods for quantitative comparison of peptides and glycans in serum for biomarker discovery. Candidate peptide and glycan biomarkers of HCC were obtained by comparing MALDI-TOF spectra of LMW enriched peptide samples and permethylated glycan structures, respectively. We showed that our methods have the ability to detect global peaks as well as those that are differentially abundant in a subgroup of patients. A panel made up of these peaks achieves high sensitivity and specificity in distinguishing HCC cases from patients with CLD in samples collected in Cairo, Egypt. The proposed subgroup-specific peak selection can potentially discover subgroups of HCC cases. The subgroups identified by the selected local peaks are not presented in this paper. We believe that further analysis is needed to determine the implication of the subgroups of subjects defined by these peaks. It will be interesting to examine if the subgroups represent different disease stages or molecular pathways.
In this study, the selection of peptide and glycan peaks was performed separately. The resulting peaks were merged together at a later stage to enhance their diagnostic capability. This approach has lead to a slight improvement in detecting HCC patients. An alternative method to effectively use these hybrid peaks would be to concatenate the detected peptide and glycan peaks prior to the peak selection process, so that they can compete against themselves and enable the selection of the most optimal peak set.
The potential clinical utility of the selected candidate markers needs to be evaluated through independent laboratory experiments. The variation in the set of peaks selected in different iterations and runs seems to suggest that the peak detection or selection results differ depending on which subset of the subjects is considered. Also, this phenomenon may suggest the presence of a large number of potential peaks that are differentially abundant between HCC and CLD patients. The observed differential abundance for some peaks could be just by chance or due to real biological differences that may be significant to the disease under study. Hence, it is important to identify the peptides and glycan structures represented by these peaks to allow their validation through independent laboratory experiments. It is expected that some of the peptides and glycan structures may not be identified due to the presence of complex mixtures at the selected m/z window, limitation of laboratory technologies, or lack of comprehensive databases. The computational methods presented in this paper provide researchers with a list of peaks - sorted by their capability to distinguish HCC patients from CLD cases - to allow a more targeted validation of candidate peptide and glycan biomarkers through independent laboratory experiments.
Acknowledgments
This work was supported in part by seed grants awarded to HWR and RG from NCI’s Early Detection Research Network, NCI grant R03 CA119313 to HWR, and NCI grants R03 CA119288 and R01 CA115625 to RG.
References
- 1.Marrero JA. Screening tests for hepatocellular carcinoma. Clin Liver Dis. 2005;9(2):235–51. vi. doi: 10.1016/j.cld.2004.12.006. [DOI] [PubMed] [Google Scholar]
- 2.Gupta S, Bent S, Kohlwes J. Test characteristics of alpha-fetoprotein for detecting hepatocellular carcinoma in patients with hepatitis C. A systematic review and critical analysis. Ann Intern Med. 2003;139(1):46–50. doi: 10.7326/0003-4819-139-1-200307010-00012. [DOI] [PubMed] [Google Scholar]
- 3.Orvisky E, Drake SK, Martin BM, Abdel-Hamid M, Ressom HW, Varghese RS, An Y, Saha D, Hortin GL, Loffredo CA, Goldman R. Enrichment of low molecular weight fraction of serum for MS analysis of peptides associated with hepatocellular carcinoma. Proteomics. 2006;6(9):2895–902. doi: 10.1002/pmic.200500443. [DOI] [PubMed] [Google Scholar]
- 4.Ressom HW, Varghese RS, Abdel-Hamid M, Abdel-Latif Eissa S, Saha D, Goldman L, Petricoin EF, Conrads TP, Veenstra TD, Loffredo CA, Goldman R. Analysis of mass spectral serum profiles for biomarker selection. Bioinformatics. 2005;21(21):4039–4045. doi: 10.1093/bioinformatics/bti670. [DOI] [PubMed] [Google Scholar]
- 5.Ressom HW, Varghese RS, Drake SK, Hortin GL, Abdel-Hamid M, Loffredo CA, Goldman R. Peak selection from MALDI-TOF mass spectra using ant colony optimization. Bioinformatics. 2007;23(5):619–26. doi: 10.1093/bioinformatics/btl678. [DOI] [PubMed] [Google Scholar]
- 6.Schwegler EE, Cazares L, Steel LF, Adam BL, Johnson DA, Semmes OJ, Block TM, Marrero JA, Drake RR. SELDI-TOF MS profiling of serum for detection of the progression of chronic hepatitis C to hepatocellular carcinoma. Hepatology. 2005;41(3):634–42. doi: 10.1002/hep.20577. [DOI] [PubMed] [Google Scholar]
- 7.Lee IN, Chen CH, Sheu JC, Lee HS, Huang GT, Chen DS, Yu CY, Wen CL, Lu FJ, Chow LP. Identification of complement C3a as a candidate biomarker in human chronic hepatitis C and HCV-related hepatocellular carcinoma using a proteomics approach. Proteomics. 2006;6(9):2865–73. doi: 10.1002/pmic.200500488. [DOI] [PubMed] [Google Scholar]
- 8.Ward DG, Cheng Y, N’Kontchou G, Thar TT, Barget N, Wei W, Billingham LJ, Martin A, Beaugrand M, Johnson PJ. Changes in the serum proteome associated with the development of hepatocellular carcinoma in hepatitis C-related cirrhosis. Br J Cancer. 2006;94(2):287–92. doi: 10.1038/sj.bjc.6602923. [DOI] [PMC free article] [PubMed] [Google Scholar]
- 9.Luk JM, Lam CT, Siu AF, Lam BY, Ng IO, Hu MY, Che CM, Fan ST. Proteomic profiling of hepatocellular carcinoma in Chinese cohort reveals heat-shock proteins (Hsp27, Hsp70, GRP78) up-regulation and their associated prognostic values. Proteomics. 2006;6(3):1049–57. doi: 10.1002/pmic.200500306. [DOI] [PubMed] [Google Scholar]
- 10.Callewaert N, Van Vlierberghe H, Van Hecke A, Laroy W, Delanghe J, Contreras R. Noninvasive diagnosis of liver cirrhosis using DNA sequencer-based total serum protein glycomics. Nat Med. 2004;10(4):429–34. doi: 10.1038/nm1006. [DOI] [PubMed] [Google Scholar]
- 11.Ludwig JA, Weinstein JN. Biomarkers in cancer staging, prognosis and treatment selection. Nat Rev Cancer. 2005;5(11):845–56. doi: 10.1038/nrc1739. [DOI] [PubMed] [Google Scholar]
- 12.Taketa K, Endo Y, Sekiya C, Tanikawa K, Koji T, Taga H, Satomura S, Matsuura S, Kawai T, Hirai H. A collaborative study for the evaluation of lectin-reactive alpha-fetoproteins in early detection of hepatocellular carcinoma. Cancer Res. 1993;53(22):5419–23. [PubMed] [Google Scholar]
- 13.Shiraki K, Takase K, Tameda Y, Hamada M, Kosaka Y, Nakano T. A clinical study of lectin-reactive alpha-fetoprotein as an early indicator of hepatocellular carcinoma in the follow-up of cirrhotic patients. Hepatology. 1995;22(3):802–7. [PubMed] [Google Scholar]
- 14.Marrero JA, Romano PR, Nikolaeva O, Steel L, Mehta A, Fimmel CJ, Comunale MA, D’Amelio A, Lok AS, Block TM. GP73, a resident Golgi glycoprotein, is a novel serum marker for hepatocellular carcinoma. J Hepatol. 2005;43(6):1007–12. doi: 10.1016/j.jhep.2005.05.028. [DOI] [PubMed] [Google Scholar]
- 15.Comunale MA, Lowman M, Long RE, Krakover J, Philip R, Seeholzer S, Evans AA, Hann HW, Block TM, Mehta AS. Proteomic analysis of serum associated fucosylated glycoproteins in the development of primary hepatocellular carcinoma. J Proteome Res. 2006;5(2):308–15. doi: 10.1021/pr050328x. [DOI] [PubMed] [Google Scholar]
- 16.Turner GA. N-glycosylation of serum proteins in disease and its investigation using lectins. Clin Chim Acta. 1992;208(3):149–71. doi: 10.1016/0009-8981(92)90073-y. [DOI] [PubMed] [Google Scholar]
- 17.Lee SJ, Evers S, Roeder D, Parlow AF, Risteli J, Risteli L, Lee YC, Feizi T, Langen H, Nussenzweig MC. Mannose receptor-mediated regulation of serum glycoprotein homeostasis. Science. 2002;295(5561):1898–901. doi: 10.1126/science.1069540. [DOI] [PubMed] [Google Scholar]
- 18.Kyselova Z, Mechref Y, Al Bataineh MM, Dobrolecki LE, Hickey RJ, Vinson J, Sweeney CJ, Novotny MV. Alterations in the serum glycome due to metastatic prostate cancer. J Proteome Res. 2007;6(5):1822–32. doi: 10.1021/pr060664t. [DOI] [PMC free article] [PubMed] [Google Scholar]
- 19.Zhao J, Qiu W, Simeone DM, Lubman DM. N-linked glycosylation profiling of pancreatic cancer serum using capillary liquid phase separation coupled with mass spectrometric analysis. J Proteome Res. 2007;6(3):1126–38. doi: 10.1021/pr0604458. [DOI] [PubMed] [Google Scholar]
- 20.Kang P, Mechref Y, Klouckova I, Novotny MV. Solid-phase permethylation of glycans for mass spectrometric analysis. Rapid Commun Mass Spectrom. 2005;19(23):3421–8. doi: 10.1002/rcm.2210. [DOI] [PMC free article] [PubMed] [Google Scholar]
- 21.Nada O, Abdel-Hamid M, Ismail A, El Shabrawy L, Sidhom KF, El Badawy NM, Ghazal FA, El Daly M, El Kafrawy S, Esmat G, Loffredo CA. The role of the tumor necrosis factor (TNF)--Fas L and HCV in the development of hepatocellular carcinoma. J Clin Virol. 2005;34(2):140–6. doi: 10.1016/j.jcv.2005.02.012. [DOI] [PubMed] [Google Scholar]
- 22.Ezzat S, Abdel-Hamid M, Eissa SA, Mokhtar N, Labib NA, El-Ghorory L, Mikhail NN, Abdel-Hamid A, Hifnawy T, Strickland GT, Loffredo CA. Associations of pesticides, HCV, HBV, and hepatocellular carcinoma in Egypt. Int J Hyg Environ Health. 2005;208(5):329–39. doi: 10.1016/j.ijheh.2005.04.003. [DOI] [PubMed] [Google Scholar]
- 23.AJCC Cancer Staging Manual. 6. American College of Surgeons; Philadelphia, Lippincott-Raven: 2002. [Google Scholar]
- 24.Abdel-Hamid M, Edelman DC, Highsmith WE, Constantine NT. Optimization, assessment, and proposed use of a direct nested reverse transcription-polymerase chain reaction protocol for the detection of hepatitis C virus. J Hum Virol. 1997;1(1):58–65. [PubMed] [Google Scholar]
- 25.Mechref Y, Novotny MV. Mass spectrometric mapping and sequencing of N-linked oligosaccharides derived from submicrogram amounts of glycoproteins. Anal Chem. 1998;70(3):455–63. doi: 10.1021/ac970947s. [DOI] [PubMed] [Google Scholar]