

Abstract
Background/Aims
The metabolic syndrome (MeSy) may be related toAlzheimer’s disease (AD). Our aims were to investigate the association of the MeSy with incident dementia in a multiethnic elderly cohort in the United States.
Methods
We conducted Cross-sectional and prospective analyses in 2,476 men and women aged 65 years and older and with data available on the metabolic syndrome and dementia diagnosis in Northern New York City. MeSy was defined by the NCEP-ATPIII and EGIR-criteria. Dementia was diagnosed using standard criteria.
RESULTS
No association was found between MeSy and prevalent dementia. After 4.4 years of follow-up, 236 individuals of the 1,833 without prevalent dementia, developed dementia. MeSy was not associated with incident dementia. Of the components of the MeSy, diabetes and hyperinsulinemia were associated with an increased incident AD (HR; 95%CI respectively 1.4; 1.0–2.1 and 1.4; 0.9–2.7) and DAS risk(HR; 95%CI respectively 1.9; 1.1–3.1 and 2.3; 1.1–4.7).
CONCLUSIONS
The MeSy was not associated with an increased dementia risk in a multiethnic elderly cohort, but diabetes and hyperinsulinemia were. In the elderly, examining diabetes and hyperinsulinemia separately may be preferable to using the MeSy as a risk factor.
Keywords: Metabolic syndrome, dementia, Alzheimer’s disease, diabetes, hyperinsulinemia
INTRODUCTION
The metabolic syndrome (MeSy) is a constellation of interrelated risk factors of metabolic origin that appear to directly promote atherosclerotic cardiovascular disease and lead to an increased risk of type 2 diabetes mellitus[l]. The pathogenesis of the syndrome is multifactorial, but insulin resistance, obesity and sedentary lifestyle, and unknown genetic factors interact in its occurrence [2]. To introduce the MeSy into clinical practice, several organizations have attempted to formulate simple criteria for its diagnosis, with the goal to reduce atherosclerotic disease risk through life-style changes and drug therapy[1]. However, due to age-related changes in risk factors, it is not clear if the MeSy captures the increased risk of diabetes and atherosclerotic disease in the elderly[3]. In addition, different criteria for the MeSy may be required for different ethnic groups because of racial variation in development of insulin resistance in response to increased adiposity[4].
There have been previous epidemiological studies relating hyperinsulinemia, diabetes and Alzheimer’s disease (AD) in elderly subjects[5–9]. Concerning other components of the MeSy and the risk of AD, the evidence is more conflicting. Hypertension, dyslipidemia, and obesity at midlife are associated with AD[10–12], whereas in the elderly an opposite association may be found[13–15].
The MeSy has been associated with cognitive decline in elderly men and women[16] and with silent brain infarction in middle-aged and elderly subjects[17]. Among Japanese-American men the presence of the MeSy in middle age increased the risk of vascular dementia, but not AD [18].
In the present study, we examined the association of the MeSy and its components with prevalent and incident dementia in a multi-ethnic cohort of elderly persons in New York City. We hypothesized that the MeSy is associated with an increased dementia risk.
METHODS
Subjects and setting
This longitudinal cohort study included participants of 2 related cohorts recruited in 1992 (cohort 1) and 1999 (cohort 2) which were identified from a probability sample of Medicare recipients aged 65 years or older residing in northern Manhattan[5,19, 20]. The sampling procedures of these cohorts were similar, except for exclusion of subjects from cohort 2 with self-reported prevalent dementia. The same assessments and study procedures were used in both cohorts. Each participant underwent an in-person interview of general health and function at baseline followed by a standard assessment, including medical history, physical and neurological examination, as well as a neuropsychological battery[21]. Baseline data were collected from 1992 through 1994 (cohort 1) in 2,126 subjects and from 1999 through 2002 (cohort 2) in 2,183 subjects. The assessments, including neuropsychological battery, were repeated approximately every 18 months. This study was approved by the institutional review board of the Columbia-Presbyterian Medical Center.
The sample for this study was restricted to individuals who had a blood draw for assessment of lipid levels. For cohort 1 a blood draw was done at the first follow-up visit and for cohort 2 a blood draw was done at baseline. The time of the blood draw was the time of ascertainment of the MeSy and was the baseline for this study. Of the 3,108 individuals who underwent a blood draw, 621 individuals had missing data on waist circumference, and 72 individuals had missing data on triglyceride levels. Thus we restricted the sample for these analyses to 2,476 individuals (80%) with complete data on the MeSy (Figure 1).
Figure 1.
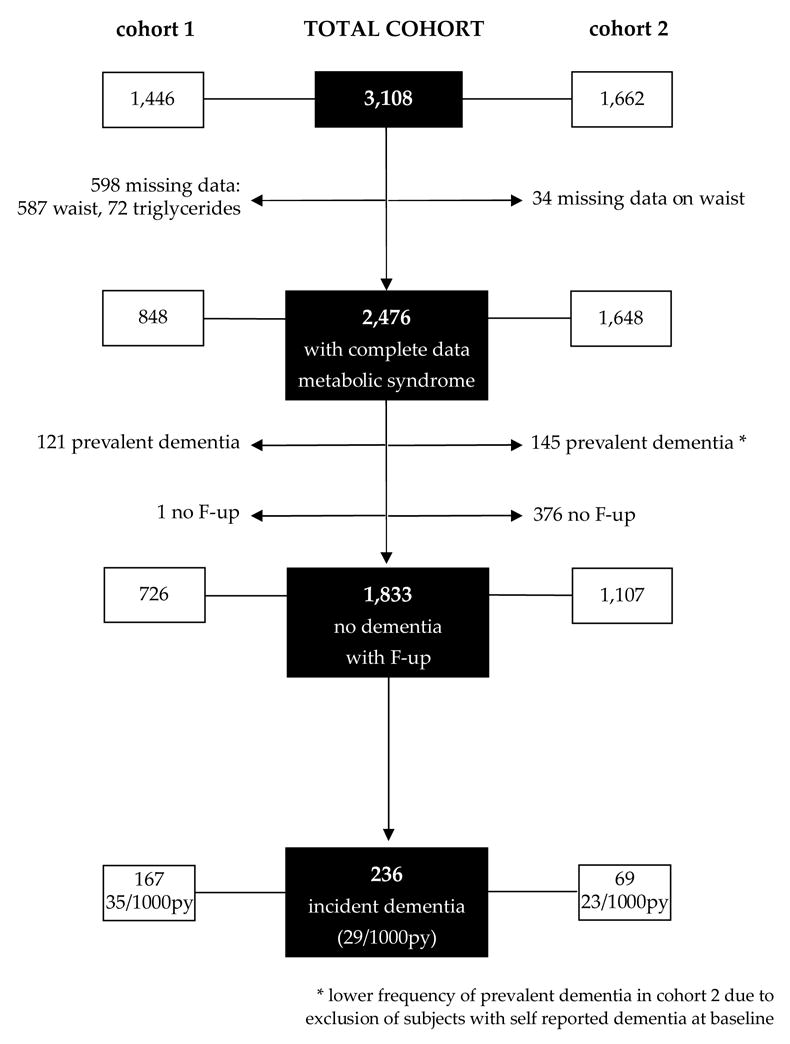
Description of sample size
Measurements
Fasting plasma total cholesterol and triglyceride levels were determined using standard enzymatic techniques. HDL-C levels were determined after precipitation of apolipoprotein B containing lipoproteins with phosphotungsticacid. LDL-C was recalculated using the formula of Friedewaldet al[22]. Fasting insulin levels were conducted in a sample of the study population from cohort 1 (N=997)[19] and were measured in μIU/mL from serum collected at baseline under overnight fasting conditions and frozen at −70 °C. Insulin levels were measured using a solid-phase chemiluminescent enzyme immunoassay (Immulite, Diagnostic Products, Los Angeles, CA). The intra-assay coefficient of variation (CV) was 4.7% and the interassay CV was 8.2%. Waist circumference was measured at the level of the iliac crest at minimal inspiration to the closest 0.1 cm. Blood pressure (BP) was recorded at each visit using the DinamapPro 100 (Critikon Co., Tampa, FL). The BP cuff was placed on the right arm while the individual was seated, and a recording was obtained every 3 minutes over 9 minutes. The third measurement was recorded. At every visit, participants were asked whether they had a history of diabetes and hypertension. If yes, they were asked whether they were under treatment and the specific kind of medication. APOE-genotypes were determined as described by Hixson and Vernier[23]. We classified persons as homozygous or heterozygous for the APOE-ε4 allele or not having any ε4 allele. Ethnic group was classified by self-report using the format of the 1990 US Census[24]. Individuals were separated into 3 ethnic groups: African-American (non-Hispanic), Hispanic, or white (non-Hispanic).
Metabolic syndrome (MeSy)
We defined MeSy using modified versions of criteria introduced by the National Cholesterol Education Program Adult Treatment Program III (NCEP-ATPIII), and by the European Group for study of Insulin Resistance (EGIR)[1]. The rationale for using two definitions is that NCEP and EGIR focus on different risk factors. EGIR assumed that insulin resistance is the major cause of the syndrome and they excluded patients with type 2 diabetes, while NCEP required no single factor for diagnosis.
According to the NCEP-ATPIII-criteria the MeSy was defined as present with three or more of the following criteria: fasting plasma glucose of at least HOmg/dL or drug treatment for elevated glucose levels, serum triglycerides of at least 150mg/dL, serum HDL-cholesterol less than 40mg/dL for men and less than 50mg/dL for women, BP of at least 130/85mmHg or antihypertensive medication use, or waist girth of more than 102cm for men or more then 88cm for women. Because glucose levels were unavailable we created a modified version of the NCEP-criteria by using only subjects treated for elevated glucose levels (diabetes defined by self report or use of diabetes medications).
In addition, MeSy was defined by the EGIR-criteria in a subsample of cohort 1 with serum insulin data. An elevated serum insulin (>75th percentile) plus 2 other factors -serum triglycerides of at least 150mg/dL and/or serum HDL-cholesterol less than 39mg/dL in men and women, BP of at least 140/90mm Hg or antihypertensive medication use, waist circumference of more than 94 cm for men or more then 80 cm for women, impaired glucose tolerance - constituted a diagnosis of the MeSy. We used the first three criteria in addition to high insulin levels for the criteria.
Diagnosis of dementia and cognitive impairment
Dementia diagnosis and specific cause assignment was made by consensus of two neurologists, one psychiatrist, and two neuropsychologists based on baseline and follow-up information that included the neuropsychological history, medical history, assessment of function, and neurological examination[5,6,21]. Brain imaging was not used for dementia diagnosis. Dementia diagnosis was based on Diagnostic and Statistical Manual of Mental Disorders (DSM)-IV criteria and required evidence of cognitive deficit on neuropsychological testing and evidence of social or occupational function impairment (CDR > 1)[25], AD diagnosis was based on NINCDS-ADRDA criteria[26]. A diagnosis of probable AD was made when dementia could not be explained by other disorders. A diagnosis of possible AD was made when the most likely cause of dementia was AD, but there were other disorders that could contribute such as stroke. Vascular dementia was diagnosed when it started within 3 months of stroke and its local effects were thought to be the primary cause. Brain imaging was available in 85% of stroke cases; in the remainder, World Health Organization stroke criteria were used. We conducted analyses with three outcomes, all-cause-dementia, probable AD, and dementia associated with stroke (DAS) which included vascular dementia and possible AD with stroke. The rationale for these outcomes is that MeSy is related to vascular disease and stroke,25 and we sought to distinguish the association of MeSy to dementias with and without a vascular component. Cognitive impairment without dementia was diagnosed in participants who had abnormal results in cognitive tests, but had no significant cognitive impairment (CDR = 0.5).
Statistical methods
ANOVA and χ2-analyses were used to estimate the unadjusted association of the MeSy, its separate risk factors, and subject characteristics with dementia (prevalent/incident/no dementia). Linear and logistic regression analyses were used to estimate the cross-sectional association between age and the risk factors of the MeSy. Logistic regression analyses were used to estimate the odds ratio (OR) and 95% CI for the association between MeSy (NCEP-criteria), its separate risk factors and prevalent dementia. Adjustments were made for age, sex, education (years), ethnic group (Caucasian; African-American; Hispanic), APOE-genotype (one or two ε4-alleles; no ε4-allele), and cohort (cohort 1; cohort 2). Subsequently, subjects with prevalent dementia and without follow-up measurements were excluded (Figure 1). Cox proportional hazard models were used to estimate the hazard ratio (HR) and 95% CI for the association between MeSy (NCEP-criteria), and its separate risk factors, and the risk of incident AD, DAS, and all-cause dementia. The MeSy was also defined by the EGIR-definition using subjects without prevalent diabetes. The time-to-event variable was the age at dementia onset, to interpret the hazard function as the age-specific incidence of the disease [27]. Secondary analyses were done with follow-up as the time-to-event variable. Individuals who did not develop the outcome of interest, died, or were lost to follow-up were censored at the time of their last evaluation. Individuals with dementia not caused by the subtype of interest were censored at the time of dementia onset. The proportional hazards assumption was checked using a log versus log minus log plot. Analyses were repeated within strata of sex, ethnicity, APOE-genotype, and cohort. Secondary analyses were done excluding subjects with prevalent cognitive impairment. Data-analysis was performed using SPSS version 12.0 and SAS for windows version 9.1.
RESULTS
Relation of MeSy and prevalent dementia
We performed cross-sectional analysis on 2,476 subjects (Figure 1). Two hundred sixty-six individuals had dementia at baseline, 236 subjects developed dementia at follow-up, and 1,974 subjects did not have or develop dementia. Subjects with prevalent and incident dementia were older, less educated, had lower waist circumference, lower BP, were more likely to be female and Hispanic, and had a higher frequency of hypertension, diabetes, and APOE-ε4 (Table 1). Linear regression analysis showed that with increasing age waist circumference, triglyceride levels, and diastolic BP declined significantly; β (95%CI) respectively: −0.28 (−0.36; −0.20), −0.85 (−1.43; −0.26), −0.19 (−0.27; −0.12). HDL levels significantly increased with increasing age (β (95%CI) = 0.15 (0.04–0.25)). Systolic BP, insulin levels, and diabetes were not significantly associated with age.
Table 1.
Characteristics of the 2,476 subjects by final diagnoses*
| dementia | prevalent N=266 | incident N=236 | no N=1,974 | P-value† |
|---|---|---|---|---|
| age (yr) | 81.8 (7.1) | 79.6 (6.5) | 75.8 (6.0) | <0.001 |
| sex (% female) | 75.9 | 67.4 | 65.9 | 0.005 |
| ethnic-group (%) Caucasian | 8.7 | 12.3 | 31.7 | |
| African- American | 33.3 | 30.2 | 31.1 | <0.001 |
| Hispanic | 58.0 | 57.4 | 37.2 | |
| education (yrs) | 6.1 (4.1) | 7.2 (4.1) | 10.4 (4.6) | <0.001 |
| APOE-ε4 (%) | 34.5 | 30.3 | 26.9 | 0.02 |
| smoking (% current/ever) | 18.1 | 31.4 | 10.2 | <0.001 |
| waist (cm) | 91 (12) | 90 (13) | 93 (12) | <0.001 |
| HDL cholesterol (mg/dL) | 47 (14) | 47 (14) | 48 (15) | 0.44 |
| triglycerides (mg/dL) | 156 (80) | 169 (84) | 161 (87) | 0.19 |
| syst BP (mmHg) | 135 (21) | 134 (21) | 141 (22) | <0.001 |
| diast BP (mmHg) | 91 (12) | 90 (13) | 93 (12) | <0.001 |
| diabetes (%) | 30.1 | 29.2 | 21.0 | <0.001 |
| hypertension (%) | 77.1 | 78.0 | 70.8 | 0.01 |
| hyperinsulinemia, highest quartile (%) | 25.5 | 29.7 | 22.9 | 0.09 |
| metabolic syndrome (%) | 52.3 | 54.7 | 54.1 | 0.83 |
SI conversion factors: to convert HDL cholesterol to mmol/L, multiply by 0.0259; triglycerides to mmol/L, multiply by 0.0113.
values are mean (SD) or %
based on analysis of variance for continuous data and on χ2-test for categorical data
Logistic regression relating MeSy (NCEP-ATPIII criteria) to prevalent dementia showed no association; adjusted OR (95%CI) was 0.9 (0.7–1.2). Of the components of the MeSy, only diabetes was associated with an increased prevalent dementia risk; adjusted OR (95%CI) was 1.5 (1.1–2.0).
Relation of MeSy by modified NCEP-ATPIII-criteria and incident dementia
After excluding subjects with prevalent dementia and without follow-up measurements, there were 1,833 individuals, with 8,140 person-years of follow-up (mean (SD) is 4.4 (2.5) person-years). No differences in demographic characteristics (age, sex, ethnicity, education) were found between the total cohort and our sample (N=1,833). Of the 1,833 individuals, 306 (17%) had prevalent cognitive impairment at baseline. Two hundred thirty six subjects developed dementia, 147 (62%) had probable AD, 73 (31%) had DAS, and 16 (7%) had other types of dementia. The incidence of dementia in cohort 1 was higher than in cohort 2 (35/1000 person-years vs 23/1000 person-years) (Figure 1), which could be explained by differences in age, education, and follow-up duration (data not shown). The prevalence of the MeSy according to the NCEP-criteria was 1,005 (55%), which is higher than reported in other studies[16, 17]. Subjects with the MeSy were less educated, smoked more, were more likely to be female and Hispanic (Table 2). The most common risk factor of the MeSy according to the NCEP-criteria was high BP (80%), followed by low HDL (51%), high triglycerides (48%), high waist (47%), and diabetes (22%).
Table 2.
Characteristics of the 1,833 non-demented subjects with follow-up measurements according to metabolic syndrome status (NCEP-ATPHI) *
| metabolic syndrome
|
||||
|---|---|---|---|---|
| yes (N=1,005 ) | no (N=828) | all (N=1,833) | ||
| age (yr) | 75.7 (5.8) | 76.6 (6.3)† | 76.1 (6.0) | |
| sex (% female) | 71.6 | 62.0 | 67.3 | |
| ethnic group (%) Caucasian | Caucasian | 27.2 | 33.1 | 29.9 |
| African- American | 25.7 | 37.0† | 30.8 | |
| Hispanic | 47.0 | 29.9 | 39.3 | |
| education (yrs) | 9.5 (4.8) | 10.8 (4.6)† | 10.1 (4.7) | |
| APOE-ε4 (%) | 25.8 | 28.4 | 27.0 | |
| smoking (% current/ever) | 15.9 | 14.0† | 14.6 | |
| waist (cm) | 97 (11) | 88 (12)† | 93 (12) | |
| HDL cholesterol (mg/dL) | 41 (11) | 56 (15)† | 48 (15) | |
| triglycerides (mg/dL) | 203 (90) | 116 (46)† | 164 (85) | |
| syst BP (mmHg) | 140 (20) | 139 (21) | 139 (21) | |
| diast BP (mmHg) | 97 (11) | 87 (12)† | 93 (12) | |
| hypertension (%) | 80.4 | 63.8† | 72.9 | |
| diabetes (%) | 35.2 | 5.0† | 21.5 | |
SI conversion factors: to convert HDL cholesterol to mmol/L, multiply by 0.0259; triglycerides to mmol/L, multiply by 0.0113.
values are mean (SD) or %
P-value < 0.01 based on analysis of variance for continuous data and on χ2-test for categorical data
There was no increase in risk for AD, DAS, and overall dementia related to MeSy. After adjustment for sex, ethnicity, education, APOE-ε4, smoking, and cohort the HR remained unchanged (Table 3). Cox regression analysis relating the separate risk factors of the MeSy to AD, DAS, and overall dementia showed that presence of diabetes was associated with an increased risk for incident AD, DAS, and overall dementia. Higher waist circumference was associated with a reduced risk for AD and overall dementia (Table 3).
Table 3.
Relation between metabolic syndrome, according to the NCEP-ATPm criteria, and incident dementia in 1,833 individuals
| NCEP-ATPIH-criteria | AD | DAS | Overall dementia | |||
|---|---|---|---|---|---|---|
| cases/1000py | HR (95% CI)* | cases/1000py | HR (95% CI)* | Cases/1000py | HR (95% CI)* | |
| waist circumference | ||||||
| low | 22 | 1.0 | 10 | 1.0 | 34 | 1.0 |
| high: men: ≥102 cm & women: ≥88 cm | 13 | 0.6 (0.4–0.9) | 8 0.8 | (0.5–1.4) | 24 | 0.7 (0.5–0.9) |
| triglycerides | ||||||
| low | 19 | 1.0 | 9 | 1.0 | 30 | 1.0 |
| high: ≥150 mg/dL | 17 | 0.9(0.6–1.3) | 90.7 | (0.4–1.2) | 28 | 0.8(0.6–1.1) |
| HDL cholesterol | ||||||
| high | 18 | 1.0 | 10 | 1.0 | 29 | 1.0 |
| low: men: <40 mg/dL & women: <50 mg/dL | 18 | 1.0(0.7–1.4) | 80.6 | (0.4–1.1) | 29 | 0.9(0.7–1.1) |
| blood pressure | ||||||
| low | 15 | 1.0 | 7 | 1.0 | 25 | 1.0 |
| high: ≥130/85 mmHg or hypertension Rx | 19 | 1.5(0.9–2.4) | 101.2 | (0.6–2.2) | 31 | 1.2(0.9–1.7) |
| Diabetes | ||||||
| no | 17 | 1.0 | 8 | 1.0 | 26 | 1.0 |
| yes | 22 | 1.4(1.0–2.1) | 141.9 | (1.1–3.1) | 39 | 1.6(1.2–2.2) |
| metabolic syndrome | ||||||
| < 3 risk factors | 20 | 1.0 | 9 | 1.0 | 31 | 1.0 |
| ≥ 3 risk factors | 17 | 0.9(0.6–1.3) | 90.8 | (0.5–1.3) | 28 | 0.9(0.6–1.1) |
HDL - high-density lipoprotein; NCEP-ATPin - national cholesterol education program-adult treatment program HI; py - person-years; Rx - drug treatment
Adjusted for age (timescale), sex, education, ethnic group, APOE allele, smoking, cohort
Relation of MeSy by EGIR-criteria and incident dementia
Insulin levels were measured in 997 subjects from cohort 1. This sample included 143 cases of prevalent dementia (14%), 189 subjects with diabetes at baseline (19%), 37 subjects with missing data on MeSy (4%), and 86 subjects without follow-up observations (9%). Thus our sample for longitudinal analyses by using the EGIR-criteria comprised 542 subjects. Of the 542 subjects, 96 had prevalent cognitive impairment. Ninety-nine subjects developed dementia, 58 had probable AD, 35 had DAS, and 6 had other types of dementia. The prevalence of the MeSy according to the EGIR-criteria was 17% (n = 90). Nineteen percent had hyperinsulinemia, 80% hypertension, 60% dyslipidemia, and 52% high waist circumference.
The age-adjusted hazard ratio’s (HR) relating MeSy (EGIR) and incident dementia were not increased (Table 4). Cox regression analysis relating the separate risk factors of the MeSy to incident dementia showed that high insulin levels were associated with an increased risk for incident AD, DAS, and overall dementia. Dyslipidemia was associated with a reduced risk for incident dementia (Table 4).
Table 4.
Relation between metabolic syndrome, according to the EGIR criteria, and incident dementia in 542 individuals
| EGIR-criteria | AD | DAS | overall dementia | |||
|---|---|---|---|---|---|---|
| cases/1000py | HR (95% CI)* | cases/1000py | HR (95% CI)* | cases/1000py | HR (95% CI)* | |
| waist circumference | ||||||
| low | 31 | 1.0 | 15 | 1.0 | 48 | 1.0 |
| high: men: ≥94 cm & women: ≥80 cm | 15 | 0.6 (0.3–1.1) | 11 | 1.0 (0.5–2.2) | 27 | 0.8 (0.5–1.3) |
| lipids | ||||||
| low TG, high HDL | 28 | 1.0 | 18 | 1.0 | 48 | 1.0 |
| TG ≥150 mg/dL and/or HDL <39 mg/dL | 16 | 0.6 (0.3–1.1) | 9 | 0.5 (0.3–1.0) | 26 | 0.6 (0.4–0.9) |
| bloodpressure | ||||||
| low | 26 | 1.0 | 9 | 1.0 | 41 | 1.0 |
| high: ≥140/90 mmHg or hypertension Rx | 18 | 0.8 (0.4–1.6) | 14 | 1.4 (0.6–3.4) | 33 | 0.8 (0.5–1.3) |
| insulin | ||||||
| low | 19 | 1.0 | 10 | 1.0 | 32 | 1.0 |
| high: >75th percentile | 26 | 1.4 (0.9–2.7) | 22 | 2.3 (1.1–4.8) | 48 | 1.6 (1.0–2.5) |
| metabolic syndrome | ||||||
| no | 20 | 1.0 | 11 | 1.0 | 33 | 1.0 |
| yes: high insulin & 2 other risk factors | 24 | 1.2 (0.6–2.5) | 17 | 1.8 (0.8–4.1) | 44 | 1.4 (0.8–2.3) |
EGIR - european group for study of insulin resistance; HDL - high-density lipoprotein; py - person-years; Rx - drug treatment; TG – triglycerides
Adjusted for age (timescale), sex, education, ethnic group, APOE allele, smoking
Secondary analyses with follow-up time as time-to-event variable did not change the presented results. Stratification and exclusion of subjects with prevalent cognitive impairment did not change the results presented in Table 3 and 4.
DISCUSSION
We related the presence of the MeSy in the elderly to risk of dementia and its main subtypes, and we found no association. However, we found that the main constructs that the definition of the MeSy intends to capture, hyperinsulinemia and diabetes, were related to both a higher AD and DAS risk.
There is limited evidence on the association between MeSy and dementia in the elderly. One study in 2,632 black and white elders found that the MeSy was associated with a higher risk of cognitive decline, particularly among those with high inflammatory markers. In Japanese Americans the MeSy in middle age was associated with vascular dementia, but not AD[18]. A cross sectional study in Europeans found that AD prevalence was higher in persons with the MeSy[28]. The discrepancy between these studies could be due to the fact that our study was conducted in an older population, ethnically diverse, and with a high prevalence of vascular risk factors[7].
The definition of the MeSy is arbitrary and intended to capture the clustering of cardiovascular risk factors, particularly in middle aged populations. The difficulty of arriving at precise MeSy criteria is reflected by the fact that over the years at least 6 different definitions have been developed that share several characteristics!!]. We used 2 definitions that we could fit to available data in our cohort. Although the factors of the MeSy, that is hypertension, dyslipidemia, obesity, and high glucose levels, are primary risk factors for vascular disease and dementia, results from several studies indicate that relations between these factors and disease become increasingly complex with advancing age[3, 14, 15, 29]. For example, hypertension[10, 11], dyslipidemia[10], and obesity [12] in middle age have been related to higher AD risk, but several studies have found no or contrary associations in the elderly[13, 15, 20, 30, 31]. A potential explanation for this increasingly complex association could be survival bias. Given the relatively high mean baseline age (76 years) of this cohort, it is possible that subjects with the MeSy died before recruitment and that the sample represents a group of healthy survivors with traits that make them less susceptible to disease caused by the cardiovascular risk factors. Another explanation could be that factors of the MeSy change as result of aging and disease. Evidence has shown that cholesterol levels and measures of adiposity, two of the main components of the MeSy, decrease with age [32, 33], and it has been suggested that lower cholesterol levels and lower BMI in the elderly represent surrogate markers of frailty or subclinical disease [20, 34]. As for BP it is suggested that it decreases in the years preceding onset of AD, and that BP continues to decline during the course of the disorder[30]. The cause of this decline may be that brain structures affected in this disease course are involved in BP regulation. Alternatively, higher BP levels may be needed to maintain an adequate cerebral perfusion[30]. Thus, it seems that the components of the MeSy do not capture in the elderly what they intend to capture in middle age due to survival bias and metabolic changes with aging. This is in line with the findings in this study, showing that subjects with dementia have lower BP, lower waist circumference, and lower cholesterol levels and that with increasing age waist circumference and triglyceride levels decrease and HDL levels increase. Another limitation of the MeSy is that it does not take ethnicity into account. The definition of obesity in particular should vary by ethnic group because some ethnic groups are more susceptible to the effects of adiposity (e.g. insulin resistance) than others[4]. For example, Asians are known to develop insulin resistance with lower levels of abdominal adiposity compared to Whites[35]. Hispanics of Mexican origin are also known to be more susceptible to the effects of adiposity than Whites[35,36]. The most prevalent ethnic group in our cohort was Hispanic of Caribbean origin, but little is known about its susceptibility to adiposity. The ethnic and racial heterogeneity of our sample could explain why direct measurement of insulin or ascertainment of diabetes history were better predictors than the MeSy in the ethnically heterogeneous cohort of this study.
Diabetes and high insulin levels were the only MeSy components which increased the risk of incident AD and DAS. There are many pathophysiological mechanisms through which diabetes might affect the initiation and promotion of the many underlying pathologies associated with dementia. Vascular disease and alterations in glucose, insulin, and amyloid metabolism seem to be important factors[37].
Strengths of the present study include that this is a prospective cohort study designed for the diagnosis of dementia and cognitive decline, and with complete clinical and neuropsychological evaluation at each interval. In addition, we had the ability to diagnose incident dementia and exclude prevalent cases.
The interpretability of the results may be restricted by several factors. Due to the fact that no fasting glucose levels were available we created modified versions of the MeSy criteria. The subjects with impaired glucose tolerance and no diabetes were not detected which may have caused dilution of the true associations assuming non-differential misclassification. We used a selected sample of the total cohort due to missing data. No differences were found in baseline characteristics between our sample and the total cohort, which makes it unlikely that our results are due to sampling variability issues. This study used data of two cohorts with similar sampling procedures, but with a time lag of 7 years. To account for these differences we repeated analyses and stratified for cohort, which did not change the presented effect estimates. The follow-up period of 4 years was relatively short and it is possible that longer follow-up could have revealed an association between the MeSy and AD.
CONCLUSION
The MeSy in the elderly is not associated with an increased dementia risk. It is unclear if current definitions of the MeSy capture the construct of insulin resistance and risk of diabetes, important dementia risk factors, in the elderly of different ethnic groups. Our results suggest that in the elderly, and in ethnically heterogeneous populations, examining diabetes and hyperinsulinemia separately may be preferable to using MeSy as a risk factor.
Acknowledgments
Support for this work was provided by grants from the National Institute on Aging Pol-AG07232, AG07702, RR006451, K08AG20856, from the Charles S. Robertson Memorial Gift for research on Alzheimer’s disease, from the Blanchette Hooker Rockefeller Foundation, from the New York City Council Speaker’s fund for Public Health Research, from the Netherlands Organization for Scientific Research (NWO) S92–254, and from the Internationale Stichting Alzheimer Onderzoek (ISAO-The Netherlands).
All authors had full access to all of the data in the study and take responsibility for the integrity of the data and the accuracy of the data analysis
References
- 1.Grundy SM, Cleeman JI, Daniels SR, et al. Diagnosis and Management of the Metabolic Syndrome: An American Heart Association/National Heart, Lung, and Blood Institute Scientific Statement. Circulation. 2005;112:2735–2752. doi: 10.1161/CIRCULATIONAHA.105.169404. [DOI] [PubMed] [Google Scholar]
- 2.Eckel RH, Grundy SM, Zimmet PZ. The metabolic syndrome. Lancet. 2005;365:1415–1428. doi: 10.1016/S0140-6736(05)66378-7. [DOI] [PubMed] [Google Scholar]
- 3.Abbott RD, Curb JD, Rodriguez BL, et al. Age-related changes in risk factor effects on the incidence of coronary heart disease. Ann Epidemiol. 2002;12:173–181. doi: 10.1016/s1047-2797(01)00309-x. [DOI] [PubMed] [Google Scholar]
- 4.Luchsinger JA. A work in progress: the metabolic syndrome. Sci Aging Knowledge Environ 2006. 2006:pe19. doi: 10.1126/sageke.2006.10.pe19. [DOI] [PubMed] [Google Scholar]
- 5.Luchsinger JA, Tang MX, Stern Y, Shea S, Mayeux R. Diabetes mellitus and risk of Alzheimer’s disease and dementia with stroke in a multiethnic cohort. Am J Epidemiol. 2001;154:635–641. doi: 10.1093/aje/154.7.635. [DOI] [PubMed] [Google Scholar]
- 6.Luchsinger JA, Tang M-X, Shea S, Mayeux R. Hyperinsulinemia and risk of Alzheimer disease. Neurology. 2004;63:1187–1192. doi: 10.1212/01.wnl.0000140292.04932.87. [DOI] [PubMed] [Google Scholar]
- 7.Luchsinger JA, Reitz C, Honig LS, et al. Aggregation of vascular risk factors and risk of incident Alzheimer disease. Neurology. 2005;65:545–551. doi: 10.1212/01.wnl.0000172914.08967.dc. [DOI] [PMC free article] [PubMed] [Google Scholar]
- 8.Ott A, Stolk RP, van Harskamp F, et al. Diabetes mellitus and the risk of dementia: The Rotterdam Study. Neurology. 1999;53:1937–1942. doi: 10.1212/wnl.53.9.1937. [DOI] [PubMed] [Google Scholar]
- 9.Xu WL, Qiu CX, Wahlin A, Winblad B, Fratiglioni L. Diabetes mellitus and risk of dementia in the Kungsholmen project: a 6-year follow-up study. Neurology. 2004;63:1181–1186. doi: 10.1212/01.wnl.0000140291.86406.d1. [DOI] [PubMed] [Google Scholar]
- 10.Kivipelto M, Helkala EL, Laakso MP, et al. Midlife vascular risk factors and Alzheimer’s disease in later life: longitudinal, population based study. Bmj. 2001;322:1447–1451. doi: 10.1136/bmj.322.7300.1447. [DOI] [PMC free article] [PubMed] [Google Scholar]
- 11.Launer LJ, Ross GW, Petrovitch H, et al. Midlife blood pressure and dementia: the Honolulu-Asia aging study. Neurobiol Aging. 2000;21:49–55. doi: 10.1016/s0197-4580(00)00096-8. [DOI] [PubMed] [Google Scholar]
- 12.Whitmer RA, Gunderson EP, Barrett-Connor E, Quesenberry CP, Jr, Yaffe K. Obesity in middle age and future risk of dementia: a 27 year longitudinal population based study. BMJ. 2005 doi: 10.1136/bmj.38446.466238.E0. bmj.38446.466238.E466230. [DOI] [PMC free article] [PubMed] [Google Scholar]
- 13.Ruitenberg A, Skoog I, Ott A, et al. Blood pressure and risk of dementia: results from the Rotterdam study and the Gothenburg H-70 Study. Dement Geriatr Cogn Disord. 2001;12:33–39. doi: 10.1159/000051233. [DOI] [PubMed] [Google Scholar]
- 14.Buchman AS, Wilson RS, Bienias JL, et al. Change in body mass index and risk of incident Alzheimer disease. Neurology. 2005;65:892–897. doi: 10.1212/01.wnl.0000176061.33817.90. [DOI] [PubMed] [Google Scholar]
- 15.Luchsinger JA, Patel B, Tang MX, Schupf N, Mayeux R. Measures of adiposity and dementia risk in the elderly. Arch Neurol in press. doi: 10.1001/archneur.64.3.392. [DOI] [PMC free article] [PubMed] [Google Scholar]
- 16.Yaffe K, Kanaya A, Lindquist K, et al. The Metabolic Syndrome, Inflammation, and Risk of Cognitive Decline. JAMA. 2004;292:2237–2242. doi: 10.1001/jama.292.18.2237. [DOI] [PubMed] [Google Scholar]
- 17.Kwon HM, Kim BJ, Lee SH, et al. Metabolic syndrome as an independent risk factor of silent brain infarction in healthy people. Stroke. 2006;37:466–470. doi: 10.1161/01.STR.0000199081.17935.81. [DOI] [PubMed] [Google Scholar]
- 18.Kalmijn S, Foley D, White L, et al. Metabolic cardiovascular syndrome and risk of dementia in Japanese- American elderly men. The Honolulu-Asia aging study. Arteriosder Thromb Vase Biol. 2000;20:2255–2260. doi: 10.1161/01.atv.20.10.2255. [DOI] [PubMed] [Google Scholar]
- 19.Luchsinger JA, Tang MX, Shea S, Mayeux R. Hyperinsulinemia and risk of Alzheimer disease. Neurology. 2004;63:1187–1192. doi: 10.1212/01.wnl.0000140292.04932.87. [DOI] [PubMed] [Google Scholar]
- 20.Reitz C, Tang MX, Luchsinger J, Mayeux R. Relation of plasma lipids to Alzheimer disease and vascular dementia. Arch Neurol. 2004;61:705–714. doi: 10.1001/archneur.61.5.705. [DOI] [PMC free article] [PubMed] [Google Scholar]
- 21.Stern Y, Andrews H, Pittman J, et al. Diagnosis of dementia in a heterogeneous population. Development of a neuropsychological paradigm-based diagnosis of dementia and quantified correction for the effects of education. Arch Neurol. 1992;49:453–460. doi: 10.1001/archneur.1992.00530290035009. [DOI] [PubMed] [Google Scholar]
- 22.Friedewald WT, Levy RI, Fredrickson DS. Estimation of the concentration of low-density lipoprotein cholesterol in plasma, without use of the preparative ultracentrifuge. Clin Chem. 1972;18:499–502. [PubMed] [Google Scholar]
- 23.Hixson JE, Vernier DT. Restriction isotyping of human apolipoprotein E by gene amplification and cleavage with Hhal. J Lipid Res. 1990;1:545–548. [PubMed] [Google Scholar]
- 24.2990 Census of population and housing: summary tape file 1, technical documentation (computer program/diskette). STF 1A database. 1991.
- 25.Hughes CP, Berg L, Danziger WL, Coben LA, Martin RL. A new clinical scale for the staging of dementia. Br J Psychiatry. 1982;140:566–572. doi: 10.1192/bjp.140.6.566. [DOI] [PubMed] [Google Scholar]
- 26.McKhann G, Drachman D, Folstein M, et al. Clinical diagnosis of Alzheimer’s disease: report of the NINCDS-ADRDA Work Group under the auspices of Department of Health and Human Services Task Force on Alzheimer’s Disease. Neurology. 1984;34:939–944. doi: 10.1212/wnl.34.7.939. [DOI] [PubMed] [Google Scholar]
- 27.Commenges D, Letenneur L, Joly P, Alioum A, Dartigues JF. Modelling age-specific risk: application to dementia. Stat Med. 1998;17:1973–1988. doi: 10.1002/(sici)1097-0258(19980915)17:17<1973::aid-sim892>3.0.co;2-5. [DOI] [PubMed] [Google Scholar]
- 28.Vanhanen M, Koivisto K, Moilanen L, et al. Association of metabolic syndrome with Alzheimer disease: A population-based study. Neurology. 2006;67:843–847. doi: 10.1212/01.wnl.0000234037.91185.99. [DOI] [PubMed] [Google Scholar]
- 29.Luchsinger JA, Mayeux R. Adiposity and Alzheimer’s Disease. Curr Alzheimer Res in press. doi: 10.2174/156720507780362100. [DOI] [PMC free article] [PubMed] [Google Scholar]
- 30.Skoog I. Highs and lows of blood pressures cause of Alzheimer’s disease? Lancet Neurol. 2003;2:334. doi: 10.1016/s1474-4422(03)00405-8. [DOI] [PubMed] [Google Scholar]
- 31.Posner HB, Tang MX, Luchsinger J, et al. The relationship of hypertension in the elderly to, AD vascular dementia, and cognitive function. Neurology. 2002;58:1175–1181. doi: 10.1212/wnl.58.8.1175. [DOI] [PubMed] [Google Scholar]
- 32.Stevens J, Cai J, Pamuk ER, et al. The effect of age on the association between body-mass index and mortality. N Engl J Med. 1998:1–7. doi: 10.1056/NEJM199801013380101. [DOI] [PubMed] [Google Scholar]
- 33.Weijenberg MP, Feskens EJ, Kromhout D. Age-related changes in total and high-density-lipoprotein cholesterol in elderly Dutch men. Am J Public Health. 1996;86:798–803. doi: 10.2105/ajph.86.6.798. [DOI] [PMC free article] [PubMed] [Google Scholar]
- 34.Schupf N, Costa R, Luchsinger J, et al. Relationship between plasma lipids and all-cause mortality in nondemented elderly. J Am Geriatr See. 2005;53:219–226. doi: 10.1111/j.1532-5415.2005.53106.x. [DOI] [PubMed] [Google Scholar]
- 35.McKeigue PM. Ethnic variation in Insulin Resistance. In: Reaven GM, Laws A, editors. Insulin Resistance: the metabolic syndrome X. Humana Press; Totowa, NJ: 1999. [Google Scholar]
- 36.Luchsinger JA. Diabetes. In: Aguirre-Molina M, CWMRE Z, editors. Health issues in the Latino community. Jossey-Bass; San Francisco: 2001. pp. 277–300. [Google Scholar]
- 37.Biessels GJ, Staekenborg S, Brunner E, Brayne C, Scheltens P. Risk of dementia in diabetes mellitus: a systematic review. Lancet Neurol. 2006;5:64–74. doi: 10.1016/S1474-4422(05)70284-2. [DOI] [PubMed] [Google Scholar]