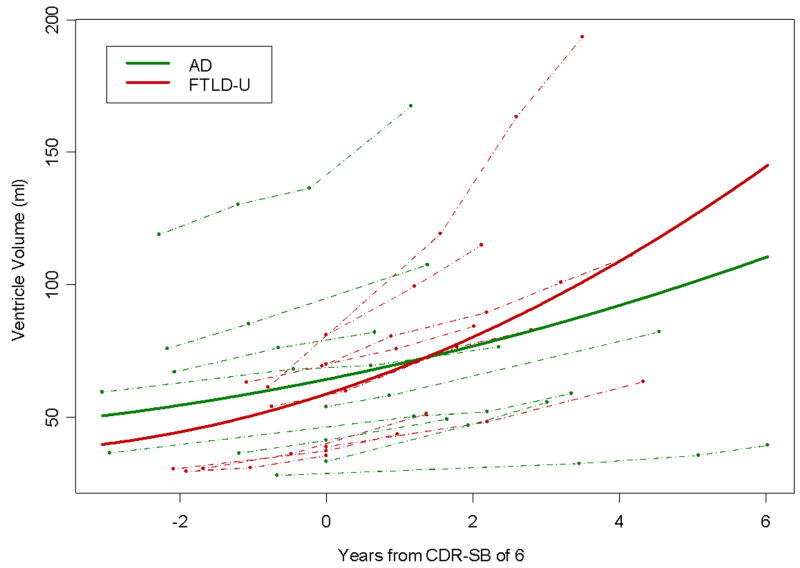
Figure 2.
Plot showing the change in ventricular volume over time in each of the AD and FTLD-U subjects (shown by dashed lines) and the model estimated best-fit slope for both the AD and FTLD-U groups (shown by a solid line). The AD subjects are represented by green lines and the FTLD-U subjects by red lines. The models were adjusted for TIV, age, gender, and education.

