

Abstract
Background
Centile charts of birthweight for gestational age are used to identify low birthweight babies. The charts currently used in Scotland are based on data from the 1970s and require updating given changes in birthweight and in the measurement of gestational age since then.
Methods
Routinely collected data of 100,133 singleton births occurring in Scotland from 1998–2003 were used to construct new centile charts using the LMS method.
Results
Centile charts for birthweight for sex and parity groupings were constructed for singleton birth and compared to existing charts used in Scottish hospitals.
Conclusion
Mean birthweight has been shown to have increased over recent decades. The differences shown between the new and currently used centiles confirm the need for more up-to-date centiles for birthweight for gestational age.
Background
Birthweight is one of the important indicators used to assess the health of an infant at birth. Low birthweight has often been defined as weights less than 2500 grams with birthweights less than 1500 grams classed as very low birthweight. These definitions however do not take into account gestational age. It is important to be able to differentiate between babies who are light because they are premature and those who are small-for-gestational age since the latter may have different health problems to the former. They may be growth restricted and have an increased risk of other complications such as perinatal asphyxia, symptomatic hypoglycaemia, congenital malformations, chronic intra-uterine infection and pulmonary haemorrhage [1]. Large-for-gestational age babies also have related health problems. Identification of small or large for gestational age babies is important for the management of the individual pregnancy and neonate. It is also a valuable aid to epidemiological studies where the aim is to identify risk factors or to assess the management of pregnancies [2].
Small- or large-for-gestational age babies may be identified using centile charts of birthweight by gestational age. Centile reference charts are used to monitor clinical measurements on individuals in the context of population values. Raw centiles can be calculated from appropriate data but the perturbations in these curves are unlikely to reflect the pattern of underlying growth at the population level. It is therefore reasonable to use statistical methods to derive a series of smoothed curves showing how the centiles of a measurement, in this case birthweight, change when plotted against time, in this case gestational age.
In Scotland there have been three sizeable studies resulting in the production of centile charts each based on data collected in Aberdeen [3-5]. The charts from the most recent of these studies, using data from 17,927 singleton births occurring between 1975–1980, were extensively used as a standard throughout Scotland until relatively recently.
The Information Services Division (ISD) of the Scottish Health Service use and publish birthweight centile charts[6]. ISD collects data on all maternity patients admitted to Scottish hospitals on an SMR02 form. The charts are based on 894,066 live births occurring between 1975 and 1989 and are the most recent published in Scotland.
Increases in birthweight since the formation of these standards have been observed for Scotland [7] England and Wales [8], the United States [9] and Canada [10] There have also been changes in the methods used to calculate gestational age [11]. These changes suggest that the centile charts in present use may now be inaccurate. Therefore, we aimed to produce updated charts using more recent data from 1998–2003.
Methods
Data on singleton births occurring between 1980 and 2003 were obtained from ISD's SMR02 (maternity) data collection system. This includes information on the birthweight, gestational age and sex of the infant. The parity of the mother is also recorded. Gestational age at birth was reported in completed weeks and is a clinician's estimate of gestation at birth based on an ultrasound dating scan and date of last menstrual period.
In order to adequately represent the population of all singleton births, the only exclusions made were lethal congenital anomalies and obvious outliers which included any birthweights less than 250 grams. Outliers were identified using Tukey's methodology [12]. This calculates the interquartile range and identifies as outliers any values more than twice the interquartile range below the first quartile or above the third quartile. This method assumes a symmetric distribution which is not the case for birthweights at most gestational ages. However the values of L obtained in each of the groups for each suggests only a slight degree of skewness at most gestational ages. The number of birthweights omitted as possible outliers was small and inspection of the omitted birthweights suggests that most of these could be explained by transcription errors.
The mean birthweight of all singletons born in each year between 1980–2003 was calculated. This confirmed the reported increase in birthweight over this period. This increase is marked over the period from 1980–1997 but appears to level off from 1998 onwards and therefore the most recent years for which complete data were available, namely 2002 and 2003, were used as a basis from which to construct new centile charts. For births occurring at gestations between 31 and 42 weeks a two year period gives sufficient data, however for the extremes of gestational age the data was supplemented by births from 1998 to 2001.
Centiles were calculated using the LMS method [13] which uses the Box-Cox power transformation to obtain normally distributed data within each group. This involves estimating three sets of values for each gestational age group, namely, L the power transformation used to achieve normality, M the median birthweight and S the coefficient of variation of the data. L, M and S are estimated for each gestational age and then smoothed curves are fitted using cubic splines to these to give L(t), M(t) and S(t) where t is the gestational age. The extent of the smoothing is expressed in terms of the degrees of freedom used for the fit. The 100αth centile for the appropriate sex and parity group is then given by
| C100α (t) = M(t) [1+L(t)S(t)Zα]1/L(t) |
where Zα is the α % point of the normal distribution.
For a particular infant, with birthweight y, a z-score can be calculated using the formula
Four sets of charts were constructed defined by the sex of the baby, male or female, and the parity of the mother, nulliparous or multiparous. Centiles were calculated using the software LMS ChartMaker. Other analysis was carried out using SAS, version 9.1
Results
The mean birthweight for each of the years from 1980 to 2003 is shown in Figure 1 and confirms the previously reported increase in birthweight.
Figure 1.
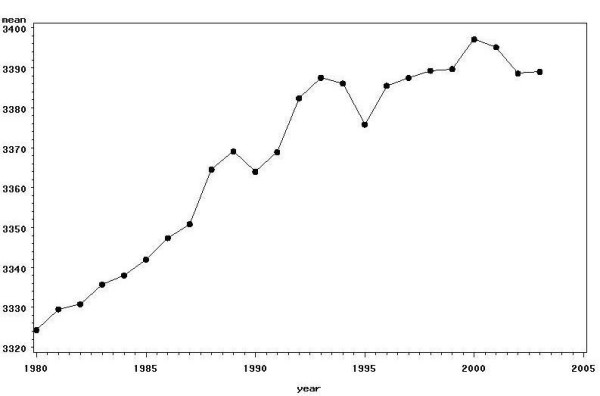
Mean birthweight by year.
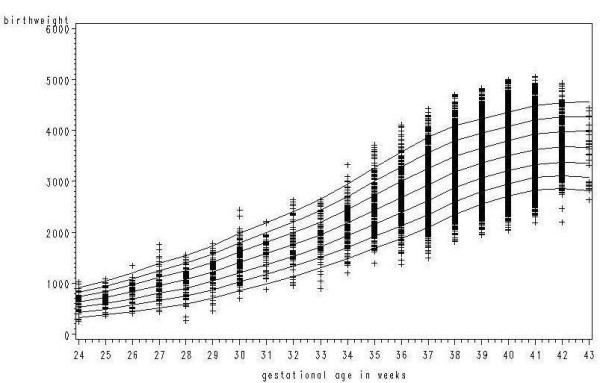
There were 98,904 records of singleton births occurring in 2002 and 2003. These were supplemented by information on 1,883 singleton births from 1998–2001 for gestational ages of 30 weeks or less or 43 weeks. Excluding lethal congenital anomalies and omitting outliers gave a total of 100,133 records. Applying Tukey's method resulted in 0.4% of the observations being omitted as outliers. Figures 2a and 2b show plots of birthweight against gestational age with and without the outliers for the subgroup girls, parity 1 or more. Table 1 gives the numbers of births used in constructing the centiles, and the percentage of outliers omitted together with the overall mean birthweight and standard deviation based on the data for 2002–2003 only.
Figure 2.
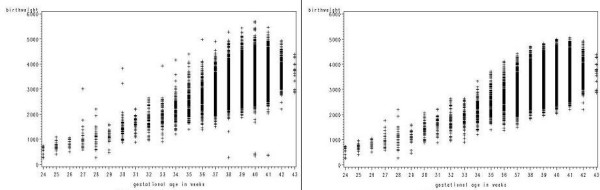
a: Birthweight by gestational age for girls, parity 1 or more. b: Birthweight by gestational age for girls, parity 1 or more with outliers removed.
Table 1.
Summary of Data by Sex and Parity Groupings
| Group | Total Numbers | 2002–2003 Data | ||
| Sex of infant | Parity | Number of births used | Percentage of outliers | Mean(St.Dev) Birthweight (with outliers omitted) |
| Male | 0 | 23419 | 0.37 | 3376 (603.33) |
| 1 or more | 27924 | 0.43 | 3494 (603.03) | |
| Female | 0 | 21948 | 0.39 | 3266 (570.94) |
| 1 or more | 26842 | 0.37 | 3369 (570.79) | |
Tables 2, 3, 4, 5 give the centiles for the groups: boys parity 0, boys parity 1 or more, girls parity 0 and girls parity 1 or more respectively. The tables also give the number of births used and the fitted values of L. M and S for each gestational age for each group, as well as the degrees of freedom used in fitting the cubic splines.
Table 2.
Centiles for Boys, Nulliparous
| Gestational Age | No. | L d.f. = 5 | M d.f. = 12 | S d.f. = 6 | 3rd | 5th | 10th | 25th | 50th | 75th | 90th | 95th | 97th |
| 24 | 65 | 1.30 | 658 | 0.245 | 326 | 372 | 440 | 546 | 658 | 764 | 856 | 910 | 944 |
| 25 | 59 | 1.34 | 759 | 0.240 | 379 | 432 | 510 | 632 | 759 | 879 | 982 | 1042 | 1080 |
| 26 | 101 | 1.38 | 851 | 0.235 | 430 | 490 | 577 | 712 | 851 | 982 | 1095 | 1160 | 1202 |
| 27 | 105 | 1.41 | 958 | 0.229 | 494 | 561 | 656 | 805 | 958 | 1101 | 1224 | 1295 | 1341 |
| 28 | 128 | 1.43 | 1103 | 0.222 | 585 | 659 | 766 | 932 | 1103 | 1263 | 1400 | 1479 | 1530 |
| 29 | 143 | 1.44 | 1271 | 0.214 | 696 | 778 | 896 | 1081 | 1271 | 1449 | 1601 | 1689 | 1745 |
| 30 | 160 | 1.43 | 1446 | 0.205 | 823 | 911 | 1039 | 1239 | 1446 | 1640 | 1807 | 1904 | 1966 |
| 31 | 86 | 1.41 | 1643 | 0.196 | 976 | 1068 | 1204 | 1419 | 1643 | 1855 | 2037 | 2143 | 2211 |
| 32 | 105 | 1.38 | 1848 | 0.187 | 1142 | 1239 | 1382 | 1609 | 1848 | 2075 | 2272 | 2387 | 2460 |
| 33 | 121 | 1.34 | 2065 | 0.178 | 1326 | 1425 | 1574 | 1812 | 2065 | 2308 | 2519 | 2643 | 2722 |
| 34 | 213 | 1.27 | 2286 | 0.169 | 1521 | 1622 | 1774 | 2021 | 2286 | 2543 | 2768 | 2901 | 2986 |
| 35 | 341 | 1.17 | 2510 | 0.161 | 1729 | 1830 | 1983 | 2235 | 2510 | 2779 | 3018 | 3159 | 3250 |
| 36 | 586 | 1.05 | 2744 | 0.153 | 1950 | 2050 | 2204 | 2461 | 2744 | 3026 | 3278 | 3428 | 3526 |
| 37 | 1051 | 0.93 | 2959 | 0.145 | 2159 | 2259 | 2412 | 2671 | 2959 | 3250 | 3513 | 3671 | 3774 |
| 38 | 2447 | 0.84 | 3162 | 0.137 | 2363 | 2461 | 2613 | 2871 | 3162 | 3457 | 3726 | 3889 | 3996 |
| 39 | 4459 | 0.77 | 3341 | 0.130 | 2546 | 2643 | 2794 | 3050 | 3341 | 3638 | 3910 | 4075 | 4182 |
| 40 | 6421 | 0.74 | 3510 | 0.125 | 2711 | 2809 | 2960 | 3217 | 3510 | 3809 | 4083 | 4250 | 4359 |
| 41 | 5906 | 0.76 | 3664 | 0.120 | 2859 | 2957 | 3110 | 3369 | 3664 | 3964 | 4238 | 4405 | 4514 |
| 42 | 867 | 0.83 | 3736 | 0.116 | 2935 | 3034 | 3187 | 3445 | 3736 | 4031 | 4299 | 4461 | 4567 |
| 43 | 55 | 0.92 | 3764 | 0.112 | 2976 | 3074 | 3225 | 3479 | 3764 | 4050 | 4309 | 4465 | 4566 |
Table 3.
Centiles for Boys, Multiparous
| Gestational Age | No. | L d.f. = 4 | M d.f. = 15 | S d.f. = 8 | 3rd | 5th | 10th | 25th | 50th | 75th | 90th | 95th | 97th |
| 24 | 61 | 1.24 | 628 | 0.229 | 339 | 378 | 436 | 529 | 628 | 723 | 806 | 855 | 886 |
| 25 | 59 | 1.23 | 756 | 0.224 | 418 | 463 | 531 | 640 | 756 | 868 | 966 | 1024 | 1061 |
| 26 | 71 | 1.22 | 866 | 0.218 | 490 | 540 | 615 | 736 | 866 | 991 | 1101 | 1166 | 1207 |
| 27 | 72 | 1.21 | 996 | 0.212 | 578 | 633 | 716 | 851 | 996 | 1137 | 1260 | 1333 | 1380 |
| 28 | 111 | 1.20 | 1147 | 0.207 | 679 | 740 | 833 | 984 | 1147 | 1305 | 1444 | 1526 | 1579 |
| 29 | 122 | 1.18 | 1308 | 0.203 | 788 | 856 | 959 | 1126 | 1308 | 1484 | 1640 | 1732 | 1791 |
| 30 | 153 | 1.15 | 1483 | 0.200 | 907 | 982 | 1096 | 1281 | 1483 | 1681 | 1856 | 1959 | 2026 |
| 31 | 62 | 1.10 | 1676 | 0.196 | 1044 | 1125 | 1249 | 1453 | 1676 | 1897 | 2093 | 2209 | 2284 |
| 32 | 100 | 1.05 | 1859 | 0.192 | 1183 | 1269 | 1400 | 1618 | 1859 | 2099 | 2314 | 2442 | 2525 |
| 33 | 135 | 0.98 | 2065 | 0.187 | 1344 | 1434 | 1573 | 1806 | 2065 | 2325 | 2560 | 2701 | 2792 |
| 34 | 209 | 0.90 | 2284 | 0.181 | 1520 | 1614 | 1760 | 2007 | 2284 | 2565 | 2821 | 2975 | 3076 |
| 35 | 312 | 0.82 | 2523 | 0.178 | 1708 | 1807 | 1961 | 2224 | 2523 | 2828 | 3108 | 3278 | 3389 |
| 36 | 679 | 0.75 | 2792 | 0.172 | 1927 | 2031 | 2194 | 2473 | 2792 | 3121 | 3425 | 3610 | 3731 |
| 37 | 1448 | 0.70 | 3063 | 0.160 | 2181 | 2287 | 2452 | 2737 | 3063 | 3400 | 3711 | 3902 | 4027 |
| 38 | 3940 | 0.69 | 3313 | 0.144 | 2457 | 2560 | 2721 | 2997 | 3313 | 3639 | 3940 | 4124 | 4245 |
| 39 | 6247 | 0.70 | 3480 | 0.130 | 2663 | 2762 | 2916 | 3179 | 3480 | 3788 | 4072 | 4245 | 4358 |
| 40 | 7809 | 0.73 | 3649 | 0.123 | 2831 | 2931 | 3086 | 3349 | 3649 | 3955 | 4236 | 4407 | 4519 |
| 41 | 5665 | 0.76 | 3793 | 0.120 | 2962 | 3063 | 3221 | 3489 | 3793 | 4102 | 4386 | 4557 | 4670 |
| 42 | 629 | 0.79 | 3856 | 0.120 | 3005 | 3110 | 3272 | 3546 | 3856 | 4172 | 4460 | 4634 | 4748 |
| 43 | 40 | 0.83 | 3866 | 0.123 | 2987 | 3095 | 3263 | 3547 | 3866 | 4190 | 4486 | 4665 | 4781 |
Table 4.
Centiles for Girls, Nulliparous
| Gestational Age | No. | L d.f. = 4 | M d.f. = 12 | S d.f. = 6 | 3rd | 5th | 10th | 25th | 50th | 75th | 90th | 95th | 97th |
| 24 | 55 | 1.43 | 604 | 0.254 | 270 | 319 | 389 | 496 | 604 | 704 | 789 | 838 | 869 |
| 25 | 56 | 1.35 | 682 | 0.252 | 320 | 372 | 446 | 562 | 682 | 794 | 891 | 947 | 983 |
| 26 | 78 | 1.27 | 779 | 0.249 | 382 | 437 | 517 | 645 | 779 | 907 | 1018 | 1084 | 1125 |
| 27 | 69 | 1.19 | 888 | 0.246 | 453 | 511 | 598 | 738 | 888 | 1033 | 1160 | 1235 | 1283 |
| 28 | 118 | 1.12 | 1018 | 0.241 | 540 | 602 | 696 | 850 | 1017 | 1181 | 1327 | 1413 | 1468 |
| 29 | 102 | 1.06 | 1173 | 0.234 | 648 | 715 | 818 | 987 | 1173 | 1357 | 1522 | 1620 | 1684 |
| 30 | 157 | 1.01 | 1339 | 0.226 | 770 | 842 | 952 | 1136 | 1339 | 1543 | 1726 | 1836 | 1907 |
| 31 | 50 | 0.97 | 1515 | 0.216 | 904 | 980 | 1097 | 1294 | 1514 | 1735 | 1935 | 2055 | 2133 |
| 32 | 88 | 0.94 | 1709 | 0.206 | 1057 | 1138 | 1263 | 1473 | 1709 | 1947 | 2163 | 2293 | 2377 |
| 33 | 118 | 0.92 | 1927 | 0.195 | 1233 | 1319 | 1451 | 1675 | 1927 | 2181 | 2412 | 2551 | 2642 |
| 34 | 161 | 0.91 | 2160 | 0.183 | 1429 | 1519 | 1659 | 1894 | 2159 | 2428 | 2672 | 2819 | 2914 |
| 35 | 303 | 0.89 | 2399 | 0.172 | 1640 | 1734 | 1879 | 2123 | 2399 | 2678 | 2932 | 3086 | 3186 |
| 36 | 462 | 0.87 | 2633 | 0.161 | 1855 | 1950 | 2099 | 2350 | 2633 | 2920 | 3182 | 3340 | 3443 |
| 37 | 955 | 0.85 | 2851 | 0.150 | 2066 | 2162 | 2312 | 2565 | 2851 | 3142 | 3407 | 3567 | 3672 |
| 38 | 2183 | 0.80 | 3062 | 0.140 | 2280 | 2376 | 2524 | 2776 | 3062 | 3353 | 3619 | 3780 | 3886 |
| 39 | 4240 | 0.73 | 3230 | 0.131 | 2464 | 2557 | 2702 | 2949 | 3230 | 3518 | 3783 | 3944 | 4049 |
| 40 | 6223 | 0.65 | 3371 | 0.125 | 2610 | 2702 | 2845 | 3091 | 3371 | 3661 | 3928 | 4091 | 4198 |
| 41 | 5718 | 0.57 | 3514 | 0.121 | 2754 | 2845 | 2987 | 3232 | 3514 | 3806 | 4078 | 4244 | 4354 |
| 42 | 760 | 0.49 | 3590 | 0.117 | 2845 | 2934 | 3073 | 3313 | 3590 | 3879 | 4148 | 4314 | 4424 |
| 43 | 52 | 0.41 | 3630 | 0.113 | 2909 | 2994 | 3128 | 3360 | 3630 | 3912 | 4176 | 4339 | 4447 |
Table 5.
Centiles for Girls, Multiparous
| Gestational Age | No. | L d.f. = 4 | M d.f. = 14 | S d.f. = 8 | 3rd | 5th | 10th | 25th | 50th | 75th | 90th | 95th | 97th |
| 24 | 65 | 1.14 | 630 | 0.247 | 326 | 366 | 426 | 524 | 630 | 734 | 826 | 881 | 916 |
| 25 | 59 | 1.11 | 720 | 0.245 | 377 | 422 | 489 | 599 | 719 | 837 | 942 | 1004 | 1044 |
| 26 | 101 | 1.09 | 832 | 0.244 | 442 | 492 | 568 | 694 | 832 | 968 | 1089 | 1161 | 1208 |
| 27 | 105 | 1.06 | 958 | 0.241 | 517 | 573 | 659 | 802 | 958 | 1114 | 1253 | 1335 | 1389 |
| 28 | 128 | 1.04 | 1073 | 0.235 | 595 | 656 | 748 | 902 | 1072 | 1242 | 1394 | 1484 | 1543 |
| 29 | 143 | 1.01 | 1222 | 0.225 | 706 | 770 | 870 | 1037 | 1222 | 1407 | 1574 | 1673 | 1738 |
| 30 | 160 | 0.96 | 1406 | 0.214 | 846 | 916 | 1023 | 1204 | 1406 | 1609 | 1793 | 1903 | 1975 |
| 31 | 86 | 0.92 | 1580 | 0.203 | 989 | 1061 | 1174 | 1365 | 1580 | 1798 | 1996 | 2115 | 2193 |
| 32 | 105 | 0.87 | 1759 | 0.193 | 1137 | 1213 | 1331 | 1531 | 1759 | 1990 | 2201 | 2329 | 2412 |
| 33 | 121 | 0.82 | 1956 | 0.184 | 1301 | 1381 | 1505 | 1716 | 1956 | 2202 | 2427 | 2564 | 2654 |
| 34 | 213 | 0.77 | 2188 | 0.177 | 1488 | 1572 | 1704 | 1930 | 2188 | 2453 | 2698 | 2847 | 2945 |
| 35 | 341 | 0.72 | 2442 | 0.173 | 1684 | 1775 | 1917 | 2161 | 2442 | 2732 | 3000 | 3164 | 3272 |
| 36 | 586 | 0.68 | 2687 | 0.169 | 1877 | 1973 | 2125 | 2386 | 2687 | 2999 | 3289 | 3466 | 3583 |
| 37 | 1051 | 0.65 | 2932 | 0.161 | 2092 | 2192 | 2349 | 2620 | 2932 | 3256 | 3558 | 3742 | 3864 |
| 38 | 2447 | 0.63 | 3176 | 0.146 | 2347 | 2446 | 2601 | 2868 | 3176 | 3495 | 3792 | 3974 | 4094 |
| 39 | 4459 | 0.62 | 3352 | 0.132 | 2556 | 2652 | 2801 | 3057 | 3352 | 3656 | 3939 | 4111 | 4225 |
| 40 | 6421 | 0.64 | 3498 | 0.126 | 2706 | 2802 | 2951 | 3206 | 3498 | 3799 | 4077 | 4247 | 4359 |
| 41 | 5906 | 0.69 | 3625 | 0.122 | 2824 | 2921 | 3072 | 3330 | 3625 | 3927 | 4205 | 4375 | 4486 |
| 42 | 867 | 0.73 | 3673 | 0.122 | 2855 | 2954 | 3109 | 3373 | 3673 | 3979 | 4260 | 4431 | 4543 |
| 43 | 55 | 0.78 | 3669 | 0.126 | 2821 | 2924 | 3085 | 3359 | 3668 | 3983 | 4271 | 4446 | 4560 |
The z-scores resulting from the LMS models fitted should be normally distributed within each grouping. This was verified by obtaining normal probability plots of the z-scores overall and for each gestational age. The plot for girls, parity 1 or more is given in Figure 3. Table 6 gives the observed percentage of z-scores by centiles groupings for the same group.
Figure 3.
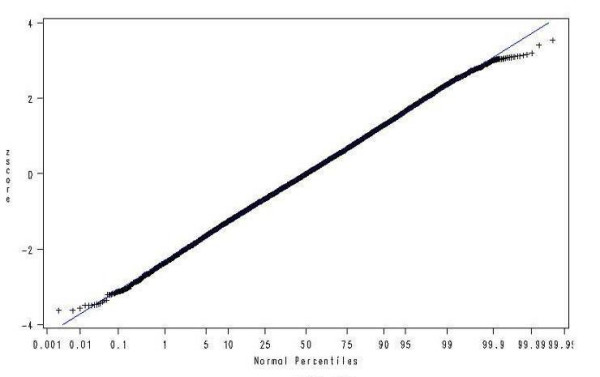
Q-Q plot of z-scores for girls, parity 1 or more.
Table 6.
Percentage of observations (observed and expected) within centile bands
| Centiles | Expected Percentage | Observed Percentage |
| Less than 3rd | 3 | 3.1 |
| Between 3rd and 5th | 2 | 1.9 |
| Between 5th and 10th | 5 | 4.8 |
| Between 10th and 25th | 15 | 14.9 |
| Between 25th and 50th | 25 | 25.5 |
| Between 50th and 75th | 25 | 25.1 |
| Between 75th and 90th | 15 | 14.5 |
| Between 90th and 95th | 5 | 5.0 |
| Between 95th and 97th | 2 | 2.0 |
| Above 97th | 3 | 3.2 |
In order to assess the goodness of fit of the models, the new centiles were plotted against the observed centiles for each group. Figure 4 shows this plot for the 3rd, 50th and 97th centiles for girls, parity 1 or more. Figure 5 shows the 3rd, 10th, 25th, 50th, 75th, 90th and 97th centiles superimposed on the actual birthweights for the same groups. For comparison Figure 6 shows the new centiles compared to the currently used ISD centiles again for the 3rd, 50th and 97th centiles
Figure 4.
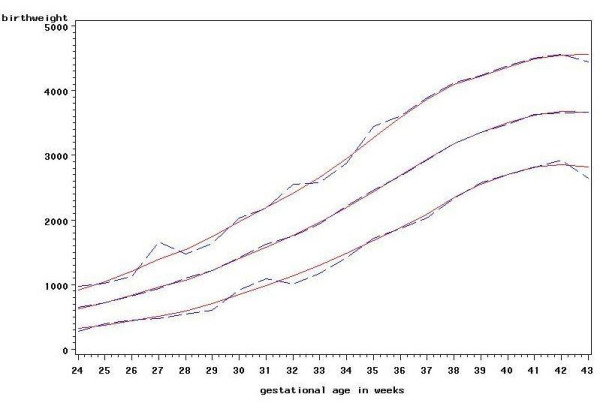
New centiles vs observed centiles for girls, parity 1 or more. 3rd, 50th and 97th centiles. Solid line: new centiles. Dashed line: observed centiles.
Figure 5.
New centiles with birthweights for girls, parity 1 or more. 3rd, 10th, 25th, 50th, 75th, 90th, 97th centiles.
Figure 6.
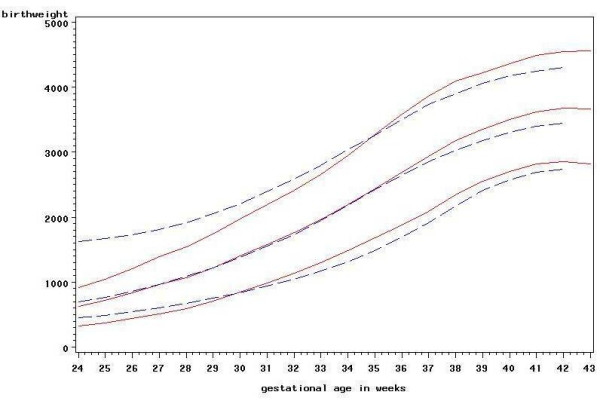
New centiles vs ISD centiles for girls, parity 1 or more. 3rd, 50th and 97th centiles. Solid line: new centiles. Dashed line: ISD centiles.
Discussion
Centile charts of birthweight for gestational age are a valuable tool in many epidemiological studies as well as providing important information to clinicians as to which babies may be at higher risk of neonatal or postnatal morbidity [14]. It is therefore essential that the charts used are representative of the population to which they are applied. A number of standards are available based on births occurring in various European countries; mostly using data from the 1980s and the 1990s [15].
There are clear differences between the centiles calculated here from recent data and those in current use in Scotland which are based on data from 1975–1989. For term babies the median birthweight in all sex and parity groupings is shown to be higher than it was previously. This increase in birthweight is also reflected in the other centiles. For babies born at very low gestational ages the median birthweight is now less than it was, possibly reflecting the increased survival rate in pre-term births [16]. The centiles for lower gestational ages are also much closer together than in the existing charts. One possible explanation for such a marked difference at lower gestations in particular may be poor estimation of gestational age, particularly in the 1970s, as was found in data for England and Wales analysed by Milner and Richards in 1974 [17].
In recent years a number of centiles charts [18] have been constructed using the method developed by Gardosi [19]. This method aims to give a fetal weight standard and requires only data for term births from the population of interest. Whilst it is desirable in principle to look at fetal weights the assumptions which are being made with this method cannot be substantiated with reference to our data which consists only of actual birthweights. It is therefore not possible to assess the goodness of fit of the centiles calculated in this way.
As well as modelling the median birthweight the LMS method also models the coefficient of variation S and the power L which is used to transform the birthweights to achieve normality. Within each of the sex and parity groupings it is seen that the coefficient of variation decreases with increased gestational age showing that the birthweights are more variable at lower gestational ages. This contrasts with the assumption used in Gardosi's methodology for fetal weights that the coefficient of variation is constant.
It is important in constructing charts of this type to test the adequacy of the model fitted both with reference to the raw data used to construct the charts and to the assumptions on which the model relies [20,21].
Comparing the new centiles to the empirical centiles suggests that the LMS method is a reasonable fit to the data. It can be shown that, in general, the standard errors of empirical centiles are larger than those for the centiles calculated using the normal distribution. The latter method is therefore more efficient. This is only true if the assumption of normality is reasonable which is not the case for birthweight and therefore some transformation of the data is required. A value of 1 for L indicates no transformation required with a value less than 1 adjusting for positive skewness and a value greater than 1 for negative skewness. For each sex and parity grouping the values of L suggest that the birthweights are negatively skewed for low gestational ages and positively skewed for higher gestational ages. The values of L suggest the extent of skewness at each gestational age is not high.
Normal probability plots of the z-scores for each grouping and for each gestational age within each grouping show that the LMS method has largely succeeded in achieving normality. There is some suggestion in the plot of heavier tails however the percentages in the tails are close to what is expected.
An important question in constructing centile charts of any data is which cases to include in the calculations and which to omit. Many previous studies into centile charts have used live births only because of the difficulty of accurately assessing the gestational age of stillbirths. The argument in the past has been that a baby which is stillborn may have died some time before delivery and therefore the weight may not be a true reflection of the gestational age at which delivery occurs. This is not often the case now. Fetal death is almost always recognized very quickly, and most women prefer to be delivered as soon as possible once it is realized that this has happened. This was argued by Tin[16] looking at the problems of estimating centiles for babies born before 32 weeks gestational age, In this paper it was suggested that not all stillbirths should be excluded, arguing that by doing so centiles at gestational ages less than 28 weeks have been largely overestimated.
For babies born within ten weeks of term the difference in centiles including and excluding stillbirths are negligible because the numbers of stillbirths are relatively small. Omitting stillbirths at low gestations of 24–27 weeks gestation causes bias in the centiles possibly because very small babies at any specified gestation are much more likely to be treated as "effectively" stillborn than larger babies of the same gestation when pregnancy ends as soon as this.
Information on ethnicity is poorly recorded on the SMR02 forms therefore no attempt was made to produce separate centiles for different ethnic groups. From the 2001 census it is known that the minority ethnic population was just over 100,000 in that year which is 2% of the total population of Scotland. The percentage is similar for women of child bearing age. Ethnicity is not therefore a major consideration for the Scottish data.
Other studies have followed the convention of excluding babies with major congenital malformations [22] and this has been used in this study. However with such a large data set the exclusion has made little difference to the centiles. Other studies [1,23] have also identified outliers at each gestational age using the criterion outlined by Tukey. From visual inspection of the charts with and without the outliers, it is clear that the points identified in this study are most likely to be due to transcription errors. The excluded points do not therefore raise any concerns about the accuracy with which gestational age is measured.
Other factors are known to have a significant effect on birthweight and a number of customised charts have been developed in recent years. It can be desirable to take into account physiological factors such as the height of the mother which contribute to the natural variation in birthweights but not potential risk factors such as whether or not the mother smokes. The distinction between the two types of factor may not always be clear cut however. For example height and weight of the mother may in part be determined by risk factors such as social deprivation or nutrition. There is therefore an important role in epidemiological studies into adverse perinatal outcomes for charts such as the ones described here which will allow both the effect of infant's size and the size of the mother to be separated.
Conclusion
The differences shown between the new centiles and the current published centiles confirm the need to have centiles appropriate for the population for which the charts are to be used. Use of inappropriate centiles may result either in small-for-dates babies not being identified or too many babies being flagged as small-for-dates. After consistent increases in mean birthweight from 1980 until the mid 1990s, mean birthweight has stabilised over recent years making the new charts appropriate for current use. It is however important that the distribution of birthweight continues to be monitored on a regular basis.
Competing interests
The author(s) declare that they have no competing interests.
Authors' contributions
SRB and CW carried out the statistical analysis. All authors were co-investigators on the CSO grant and contributed to the initiation of the project and subsequent discussion. All authors have read and approved the final manuscript.
Pre-publication history
The pre-publication history for this paper can be accessed here:
Acknowledgments
Acknowledgements
This work was funded by the Chief Scientists Office. We thank Edmund Hey for his contribution and valuable comments. Dr. Gray is funded by a core grant from the Department of Health in England to the National Perinatal Epidemiology Unit. The views expressed in this paper are those of the authors and do not necessarily reflect the views of the Department of Health.
Contributor Information
Sandra Bonellie, Email: s.bonellie@napier.ac.uk.
James Chalmers, Email: jim.chalmers@isd.csa.scot.nhs.uk.
Ron Gray, Email: ron.gray@npeu.ox.ac.uk.
Ian Greer, Email: hysig@hyms.ac.uk.
Stephen Jarvis, Email: s.n.jarvis@ncl.ac.uk.
Claire Williams, Email: cwillia2@staffmail.ed.ac.uk.
References
- Beeby PJ, Bhutap T, Taylor LK. New South Wales population-based birthweight percentile charts. Journal of Paediatrics and Child Health. 1996;32:512–518. doi: 10.1111/j.1440-1754.1996.tb00965.x. [DOI] [PubMed] [Google Scholar]
- Wilcox AJ, Skjoerven R. Birth-Weight and Perinatal-Mortality - the Effect of Gestational-Age. American Journal of Public Health. 1992;82:378–382. doi: 10.2105/ajph.82.3.378. [DOI] [PMC free article] [PubMed] [Google Scholar]
- Carrhill RA, Pritchard CW. Reviewing Birth-Weight Standards. British Journal of Obstetrics and Gynaecology. 1983;90:718–725. doi: 10.1111/j.1471-0528.1983.tb09301.x. [DOI] [PubMed] [Google Scholar]
- Campbell D, Hall M, Lemon J, Carrhill R, Pritchard C, Samphier M. Clinical Birth-Weight Standards for a Total Population in the 1980s. British Journal of Obstetrics and Gynaecology. 1993;100:436–445. doi: 10.1111/j.1471-0528.1993.tb15268.x. [DOI] [PubMed] [Google Scholar]
- Thomson AM, Billewicz WZ, Hytten FE. The Assessment of Fetal Growth. Journal of Obstetrics and Gynaecology British Commonwealth. 1968;75:903–916. doi: 10.1111/j.1471-0528.1968.tb01615.x. [DOI] [PubMed] [Google Scholar]
- Information and Statistics Division SHS. Scotland, birthweight, head circumference and lenght for gestational age. ISD Scotland Publications. 1992.
- Bonellie SR, Raab GM. Why are babies getting heavier? Comparison of Scottish births from 1980 to 1992. British Medical Journal. 1997;315:1205–1205. doi: 10.1136/bmj.315.7117.1205. [DOI] [PMC free article] [PubMed] [Google Scholar]
- Macfarlane A, Mugford M, Johnson A, Garcia J. Counting the changes in childbirth: trends and gaps in national statistics. National Perinatal Epidemiology Unit, Radcliffe Infirmary, Oxford. 1995.
- ChikeObi U, David RJ, Coutinho R, Wu SY. Birth weight has increased over a generation. American Journal of Epidemiology. 1996;144:563–569. doi: 10.1093/oxfordjournals.aje.a008966. [DOI] [PubMed] [Google Scholar]
- Kramer MS, Morin I, Yang H, Platt RW, Usher R, McNamara H, Joseph KS, Wen SW. Why are babies getting bigger? Temporal trends in fetal growth and its determinants. Journal of Pediatrics. 2002;141:538–542. doi: 10.1067/mpd.2002.128029. [DOI] [PubMed] [Google Scholar]
- Wilcox M, Gardosi J, Mongelli M, Ray C, Johnson I. Birth-Weight from Pregnancies Dated by Ultrasonography in a Multicultural British Population. British Medical Journal. 1993;307:588–591. doi: 10.1136/bmj.307.6904.588. [DOI] [PMC free article] [PubMed] [Google Scholar]
- Tukey JW. Exploratory Data Analysis. Addison Wesley; 1977. [Google Scholar]
- Cole TJ. Fitting Smoothed Centile Curves to Reference Data. Journal of the Royal Statistical Society Series a-Statistics in Society. 1988;151:385–418. [Google Scholar]
- Bertino EM., S; Fabris, C; De Curtis M Neonatal anthropometric charts: what they are, what they are not . ARCHIVES OF DISEASE IN CHILDHOOD-FETAL AND NEONATAL EDITION. 2007;92:7–10. doi: 10.1136/adc.2006.096214. [DOI] [PMC free article] [PubMed] [Google Scholar]
- Hemming KH., JL; Glinianaia, SV; Jarvis SN; Platt MJ Differences between European birthweight standards: impact on classification of 'small for gestational age' . DEVELOPMENTAL MEDICINE AND CHILD NEUROLOGY. 2006;48:906–912. doi: 10.1017/S0012162206001988. [DOI] [PubMed] [Google Scholar]
- Tin W, Wariyar UK, Hey EN. Selection biases invalidate current low birthweight weight-for-gestation standards. British Journal of Obstetrics and Gynaecology. 1997;104:180–185. doi: 10.1111/j.1471-0528.1997.tb11041.x. [DOI] [PubMed] [Google Scholar]
- Milner RDG, Richards B. An analysis of birthweight by gestational age of infants born in England and Wales 1967-1971. Journal of Obstetrics and Gynaecology British Commonwealth. 1974;81:956–957. doi: 10.1111/j.1471-0528.1974.tb00414.x. [DOI] [PubMed] [Google Scholar]
- McCowan L, Stewart AW, Francis A, Gardosi J. A customised birthweight centile calculator developed for a New Zealand population. Australian & New Zealand Journal of Obstetrics & Gynaecology. 2004;44:428–431. doi: 10.1111/j.1479-828X.2004.00272.x. [DOI] [PubMed] [Google Scholar]
- Gardosi J, Mongelli M, Wilcox M, Chang A. An Adjustable Fetal Weight Standard. Ultrasound in Obstetrics & Gynecology. 1995;6:168–174. doi: 10.1046/j.1469-0705.1995.06030168.x. [DOI] [PubMed] [Google Scholar]
- Altman DG, Chitty LS. Charts of Fetal Size .1. Methodology. British Journal of Obstetrics and Gynaecology. 1994;101:29–34. doi: 10.1111/j.1471-0528.1994.tb13006.x. [DOI] [PubMed] [Google Scholar]
- Royston P, Wright EM. Goodness-of-fit statstics for age-specific reference intervals. Statistics in Medicine. 2000;19:2943–2962. doi: 10.1002/1097-0258(20001115)19:21<2943::AID-SIM559>3.0.CO;2-5. [DOI] [PubMed] [Google Scholar]
- Yudkin PL, Aboualfa M, Eyre JA, Redman CWG, Wilkinson AR. New Birth-Weight and Head Circumference Centiles for Gestational Ages 24 to 42 Weeks. Early Human Development. 1987;15:45–52. doi: 10.1016/0378-3782(87)90099-5. [DOI] [PubMed] [Google Scholar]
- Thompson JMD, Mitchell EA, Borman B. Sex-Specific Birth-Weight Percentiles by Gestational-Age for New-Zealand. New Zealand Medical Journal. 1994;107:1–3. [PubMed] [Google Scholar]