

Abstract
Motor skills emerge from learning feedforward commands as well as improvements in feedback control. These two components of learning were investigated in a compensatory visuomotor tracking task on a trial-by-trial basis. Between trial learning was characterized with a state-space model to provide smoothed estimates of feedforward and feedback learning, separable from random fluctuations in motor performance and error. The resultant parameters were correlated with brain activity using magnetic resonance imaging. Learning related to the generation of a feedforward command correlated with activity in dorsal premotor cortex, inferior parietal lobule, supplementary motor area and cingulate motor area, supporting a role of these areas in retrieving and executing a predictive motor command. Modulation of feedback control was associated with activity in bilateral posterior superior parietal lobule as well as right ventral premotor cortex. Performance error correlated with activity in a widespread cortical and subcortical network including bilateral parietal, premotor and rostral anterior cingulate cortex as well as the cerebellar cortex. Finally, trial-by-trial changes of kinematics, as measured by mean absolute hand acceleration, correlated with activity in motor cortex and anterior cerebellum. The results demonstrate that incremental, learning dependent changes can be modeled on a trial-by-trial basis and neural substrates for feedforward control of novel motor programs are localized to secondary motor areas.
Keywords: Motor learning, prediction, BOLD, fMRI, human, coordination
Introduction
Learning a new motor skill is based on hidden, intrinsic changes within the nervous system that are inferred by measurable changes of performance (Schmidt, 1975). Functional imaging provides an opportunity to identify these intrinsic changes within the brain. Previous imaging studies establish that activity in the brain changes with learning, and that this change correlates with numerous measures of competency including time on task (Grafton et al., 1992; Grafton et al., 1994; van Mier et al., 1998; Grafton et al., 2001), tracking error (Miall et al., 2001; Diedrichsen et al., 2005; Miall and Jenkinson, 2005), speed and reaction time. These findings establish the feasibility of using imaging with blood oxygen level dependent (BOLD) magnetic resonance imaging (MRI) to capture learning related changes in the brain, but also highlight the need to distinguish different cognitive, kinematic or control mechanisms that lead to these BOLD signal changes.
Here we used a compensatory tracking task in which participants had to counteract the influence of a repeating input function. As learning progressed, participants became more adept at keeping a cursor in a goal region. For this task we can distinguish at least four separable but not necessarily independent components that could lead to learning related BOLD signal changes. 1) Motor learning is by definition accompanied by a change in motor output. Given the known correlations between movement kinematics and brain activity (Dettmers et al., 1996; Turner et al., 1998; Turner et al., 2003), one is faced with the problem of distinguishing changes of brain activity due to learning from changing movement kinematics. It is possible to manipulate tasks such that kinematics remain constant, through use of dual tasks (Seidler et al., 2002). However, these data can be difficult to generalize to other forms of learning as there is evidence that neural substrates of skill learning can differ enormously in the context of training under single and dual tasks (Grafton et al., 1995; Hazeltine et al., 1997; Grafton et al., 1998). A second approach is to identify changes of network dynamics, rather than local BOLD magnitude, to characterize learning (Tunik et al., 2007). A third, model based approach is to parameterize learning and show that these parameters are uncorrelated with low level kinematic features. Then the model parameters can be correlated with brain activity. This is the general strategy of the current study. 2) Performance error is used to correct the on-going movement as well as to serve as signal to change the movement plan of the next movement (Diedrichsen et al., 2005; Suminski et al., 2007). There is a need to distinguish brain activity associated with the perception and correction of error within each trial from modifications across future trials (Fisher et al., 2000). In the current study within trial error was correlated directly with brain activity on a trial by trial basis and between trial effects were incorporated in the learning model. 3) Performance can improve by changing how feedback information is used, i.e., through a change of the feedback control policy (Garvey, 1960; Fuchs, 1962; Fitts, 1964). This improvement can occur irrespective of the ability generate a predictive motor command. For example, performance can improve when tracking randomly moving targets by adopting an optimal feedback control policy that takes into account the inherent temporal delays (Foulkes and Miall, 2000). 4) Predictive or feedforward control can occur by perceptual learning of the trajectory of a target or by motor learning of a particular required movement (Adams, 1987). Both perceptual and motor learning result in predictive control but they have fundamentally different patterns of generalization and neural substrates (Grafton et al., 2001). These different contributions to learning motivated the current experimental approach. The subjects used a frictionless knob and made pronation-supination movements of the forearm to keep a cursor centered while an unknown but consistently repeating input function moved the cursor off the midline. Subjects learned a novel and unique spatio-temporal motor pattern necessary to counteract the hidden input that perturbed the position of a cursor.
We distinguished contributions based on feedforward learning from feedback corrections driven by visual feedback using the temporal delay of the response. Feedback corrections were modeled as a response to position and velocity of the feedback cursor with a 150ms delay. In contrast, predictive responses were modeled as being related to the input function without time delay. To determine whether these feedforward responses were learned as a motor program or through perceptual learning of the input pattern, we used a transfer task after 4 days of training in which the learned skill had to be generalized to a new control situation with either an identical motor response or perceptual pattern instructing the desired movement. As shown below, generalization only occurred with transfer to control situations requiring identical movement.
Control parameters were estimated to describe the strength of feedforward and feedback control on every single trial. To distinguish these learning related changes from trial-by-trial variations of the size of the visual error and the actual motor output, a state space model that provided optimally smoothed estimates of the control parameter was used. In control engineering, a state space representation is a mathematical model of a physical system described as a set of input, output and state variables related by first-order differential equations. State-space models can be used to represent the output of a visuomotor control system as a function of the input and of the hidden state of the system at a particular moment in time, i.e. within a given motor trial. They can also be used to describe the temporal dynamics of how the hidden state develops over time, i.e. how the visuomotor system learns from trial to trial. Similar approaches have been used to model learning and generalization in a force-field reaching task (Thoroughman and Shadmehr, 2000; Donchin et al., 2003; Smith et al., 2004) as well as during sensorimotor adaptation to altered visual feedback (Cheng and Sabes, 2006). A general tenet is that the parameter changes related to learning are relatively smooth (Baddeley et al., 2003), while changes in motor error and motor output fluctuate, uncorrelated, across trials.
Previous state-space models of motor learning have characterized the success of a subject in learning to adjust the execution of a familiar movement, such as pointing to a target in the setting of altered dynamics or visual feedback. In contrast, the current experiment required subjects to learn an unfamiliar movement pattern in the setting of stable dynamics and normal visual feedback. Feedforward learning in the present case represents the capacity to retrieve a newly acquired motor program. The parameter estimate of feedback learning in the present study is an abstract metric describing the ability of a subject to modify their use of feedback information to improve performance. There are many ways a person might accomplish this, including better use of visual attention, smoother movements or enhanced understanding of the controller dynamics. The current measure does not distinguish these sources of improved use of feedback information.
The experimental design also allowed for an assessment of standard measures of performance for each trial. Motor error was measured as the mean absolute position error over a trial and motor output was measured as the mean absolute hand acceleration, Other measures of the amount of motor output could also potentially be used, such as average velocity or force, but these measures typically correlate among each other and with hand acceleration. Note that error and hand acceleration are sensitive to trial-by-trial noise whereas our state-space model estimates of feedback and feedforward learning were calculated to be independent of this non-specific performance variability. We then correlated these four measures with MRI BOLD measures of brain activity on a trial-by-trial basis. In this way, brain activity related to both learning and performance could be localized. The core hypotheses in the present paper tested if there were different brain correlates of feedback policy and feedforward learning and if these would be localized in the same brain areas driven by trial to trial differences of kinematics or error.
While the relationship between brain activity, kinematics and error are well established, the brain systems related to feedforward and feedback control have not been defined. One strategy for distinguishing brain systems underlying feedback and feedforward control used Fitt’s law in a pointing task. With this construct and fMRI it was proposed that there is greater feedback control when targets are small and greater feedforward control with “ballistic” movements towards large targets. fMRI identified areas more strongly activated with large targets (and presumably feedforward control) included primary motor cortex, premotor cortex, and the basal ganglia. Areas associated with more difficult targets (presumably with greater feedback control) included ipsilateral sensorimotor cortex, multiple cerebellar regions, and the thalamus (Seidler et al., 2004). While feedback control is likely to increase for small targets, the assumption that feedforward control would change at all is untested. Subjects could use the same feedforward program, but at a higher velocity. Thus, differences in motor output, movement speed, etc. complicate the interpretation of these results and underscore the need for alternative methods to distinguish feedforward and feedback control.
Changes in feedforward control have also been studied using visuomotor adaptation. Learning to reach with a rotated joystick induces widespread changes of activity including increased activity in the cerebellum (Imamizu et al., 2000; Della-Maggiore and McIntosh, 2005; Graydon et al., 2005) and basal ganglia (Seidler et al., 2006). However, many of these studies have not controlled for other factors, such as movement error, eye movements, and hand motor output. When controlling for these factors, the acquisition of a new visuomotor mapping appears to be connected with increased activity in the right parietal cortex (Krakauer et al., 2004). Finally, it has been proposed that premotor and inferior parietal cortex or basal ganglia retrieve and manipulate specific motor programs i.e. “action vocabularies” used in feedforward control (Graybiel, 2000; Rizzolatti and Craighero, 2004; Johnson-Frey et al., 2005).
Materials & Methods
Task and Performance Measurement
An optically encoding MRI compatible knob with a screwdriver handle and minimal resistive torque sampled rotational position of the forearm at 200Hz. Subjects viewed a computer monitor projected by LCD onto a rear projection screen at the head of the bore via a mirror mounted to the head coil. The screen was colored dark gray and bisected by a stationary vertical red bar that served as the target. The knob controlled the lateral position of a second, thick yellow vertical bar. The knob response was set to be either positional or rate dependent, i.e. the position of the knob was either used as a position command or velocity command for the cursor. In each case the gain setting was adjusted so that the subject could comfortably move the cursor from one side of the screen to the other with pronation-supination movement of the forearm. These distal forearm rotational movements minimized proximal arm and trunk movements. Raw signal was smoothed with a Butterworth filter.
Participants learned a compensatory tracking task driven by a pair of symmetric inputs that alternated from trial to trial. Each trial lasted 10s rest, alternating with 10s of rest. For each trial, the subjects rotated the knob to keep the cursor from deviating from the midline reference. The task requires the cursor to be centered and so gaze remains central, excluding learning with an oculomotor strategy. No specific instructions were given to fixate during the task or rest period. During all training trials, either of two arctan input functions were used to deviate the cursor away from the center and a rate dependent knob was used, i.e. the angular position of the knob translated into a certain velocity of the cursor on the screen. Therefore, the optimal movement to counteract the input function that would keep the cursor centered is the derivative of the arctan input function. The panel in Figure 1 labelled “training” shows the input function and what an ideal motor response would look like for a rightward trial. The input function alternated in sign with even trials rightward and odd trials leftward so that subjects were actually learning two mirror symmetric movements.
Figure 1.

Ideal mappings between input and motor output during training and transfer conditions. During Training (upper left), the hidden input function (solid line) was an arctan function (AT) and the required movement output (dotted line) was the derivative of the input function. On day 5 three transfer tasks were also tested with either the original rate dependent controller (Same controller) or a position dependent controller (New Controller), using either the original arctan input function (Same Input) or the derivative of the arctan function (New Input). When both the input function and control were new (lower right), the required movement was the same as in training.
Experimental Paradigm and Training Schedule
All training trials were performed during imaging, with no prescan or interscan practice. There were 26 trials (13 left, 13 right) per fMRI run. Figure 2 shows the schedule for all training trials over 4 days. Since each trial lasted 10 seconds, mean performance measures for a given trial could be correlated with mean BOLD activity acquired over 5 volume acquisitions (TRs), thus enhancing statistical reliability. In addition, each trial was interspersed with a ten second rest periods to allow the BOLD response to return to baseline between trials. This reduced temporal autocorrelation between trials. Intertrial rest periods as well as inter-scan rest were included to improve the rate of learning. Four MRI runs were completed each training day, and four days of training were completed within seven days. This distribution of trials was based on scheduling limitations and to avoid fatigue occurring with longer fMRI runs or sessions. In all, subjects completed a total of 16 MRI runs containing a total of 208 left and 208 right training trials, spanning a total of 69 minutes of movement related activity.
Figure 2.
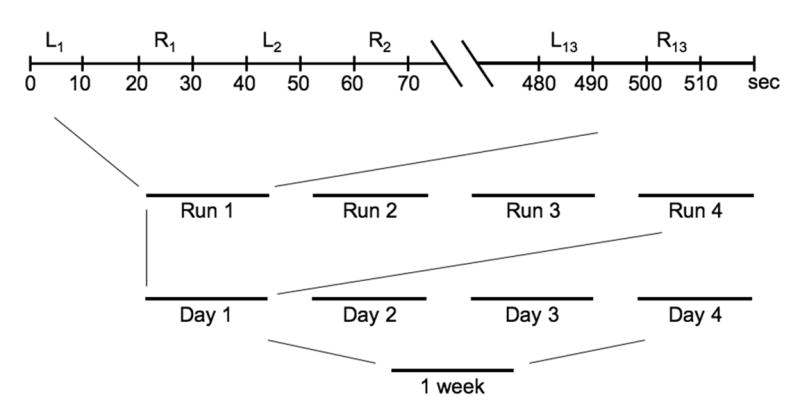
Experiment training schedule. Subjects were trained on four days, completed within one week. On each day they were scanned four times. Each scan included 13 leftward and 13 rightward trials, interspersed with 10 second rest periods. All training was performed during imaging.
A transfer experiment was completed on a fifth day. No additional practice was performed between day four and the transfer experiment. During the transfer experiment, four functional MRI runs were acquired. The numbers of trials per run, trial length and rest periods were the same as prior days. The first run used the original training input function and rate dependent knob. The remaining three runs were randomized with the following combinations: arctan input function with position dependent controller, derivative of the arctan input function with a position dependent controller, or derivative of the arctan input function with a rate dependent controller. Only error measures from day 5 are reported here.
Subjects
13 normal right handed (Oldfield, 1971) adults (laterality quotient >60, mean age 21.4, range 19-25, 4 women: 9 men) with normal corrected vision participated in the study under informed consent in accordance with the Human Subjects Institutional Review Board. Two subjects were excluded secondary to excessive head movement artifacts (>3mm), another subject was only included in the day 5 analysis because of MRI technical problems occurring in days 1-4 (this person did complete all training during imaging), and 4 subjects did not complete day 5 testing. Thus, there was reliable behavioral and fMRI data from 10 subjects to assess brain correlates of training acquired over days 1-4. One of these subjects was subsequently excluded because of high correlations between the two model estimates, error and hand acceleration (see results section). For the behavioral transfer experiment, obtained on day 5, there were reliable behavioral data for 9 subjects.
Performance Model
On each trial the fixed input function f (t) “deviated” the cursor laterally. The cursor position on the screen x(t) was the discrepancy of the input pattern f (t) and the position command from the knob x(t)= f(t)− y(t). For a rate-control device, y(t) was determined by the actual hand position.
We modeled motor behavior with a proportional-derivative control law. In this model, the motor output, ( ÿ ), (corresponding to the rotational velocity of the hand for the rate controlled device) was a linear function of the position error (x) and the velocity error (ẋ), both delayed by τ =150ms. A delay of 150ms was chosen as this is a typical latency for generating corrections to random perturbations in visuomotor tracking (Jagacinski and Hah, 1988; Jagacinski et al., 1993; Hah and Jagacinski, 1994; Jagacinski et al., 1995). To capture feedforward learning we added a third component corresponding to the to-be-learned output pattern f̈ (t), the second derivative of an arctan function.
| (1) |
First we used linear regression of the behavioral output to estimate the control parameters associated with position error, velocity error and formation of a motor program. Because the time-series were smooth, we treated the noise in the linear model e(t) as an auto-regressive process, e(t)= αe(t−1)+η(t), where η(t) is a white-noise process. The autogressive coefficient was estimated from the residuals from an ordinary least square regression for each trial separately and the median estimate α=0.92 was then used for all trials. With this, the estimate of the control parameters becomes
| (2) |
Where is the vector of regression coefficients for trial n, ÿn is the Tx1 vector of wrist velocities, Xn is the 3 × T design matrix holding the position error, the velocity error and the to-be-learned motor output in its three columns, and V is the variance-covariance matrix of e(t).
The Learning model
A second level, state-space model was used to capture learning related changes of feedback and feedforward control parameters across trials. This state-space model starts with the observation that the parameters for the feedback control policy and motor program on each trial, βn fluctuate from trial to trial, and assumed this was partly caused by non-specific changes of the state of the participant attributable to attention or fatigue ( εn ). Furthermore, the estimate β̂n is not perfect, but will show some variability due to motor output noise. Thus, we modeled the parameter ( β̂n ) estimated in trial n as a noisy version of the true, but hidden state variables wn.
| (3) |
Learning related changes, in contrast, were assumed to be slow and smooth. Because we had no a-priori hypothesis about how fast learning in this system would be, we modeled learning by small incremental random changes (state-noise) starting with the initial state of the system μ (Smith et al., 2005).
| (4) |
Expectation Maximization
The EM algorithm provided the expected value of wn , a representation of the learned state of the system, independent of trial-to-trial fluctuations. EM proceeds by estimating both the wn , as well as nine “hyper-parameters” Θ = {q1−3,r1−3,μ}, which describe the size of the variances associated with changes due to learning (qi), and due to trial-by-trial variation (ri). These two parameters jointly determine the smoothness of learning related changes. We refer to these as “hyper-parameters” to distinguish them from the performance model parameters (β̂n ) and the hidden state variables (wn ). The EM algorithm proceeds in two steps. In the E-step, the expected values and variances of the hidden variables wn are calculated, given an initial guess about the hyper-parameters Θ(0). In the M step, new hyper-parameter values are estimated, by maximizing the expected complete log-likelihood function, given the current expected values of the hidden variables, wn. Iteration of these two steps leads to convergence to the maximum-likelihood estimate (McLachlan and Krishnan, 1997). A similar method has been described previously (Cheng and Sabes, 2006). The strength of the algorithm is that both hidden variables and hyper-parameters can be jointly estimated.
Magnetic Resonance Imaging
Imaging was performed with a General Electric Horizon echospeed whole body 1.5 T MRI scanner using a standard birdcage head coil. Head movements were minimized with foam pillows and padding. For functional imaging, an echo planar gradient echo imaging sequence sensitive to blood oxygenation-level-dependent (BOLD) contrast was used: 25 slices per TR (3.5 mm thickness, 1 mm gap), TR of 2000 ms, TE of 35 ms, flip angle of 90°, field of view of 24cm and 64×64 matrix. The first four volumes (10s) of each functional run were discarded to allow magnetization to approach equilibrium, followed by 258 whole brain volumes. A T1 weighted image anatomic scan was acquired using a spoiled gradient recalled 3D sequence (TR 7.7, TE min full, flip angle 15°, FOV 24, slice thickness 1.2, 256 × 256 × 124 matrix).
Image Processing
Spatial normalization and smoothing were carried out in SPM99 (http://www.fil.ion.ucl.ac.uk/spm). Functional images were realigned and co-registered to high-resolution scans, normalized to a standardized stereotaxic space (the MNI template provided with SPM99 using affine and then nonlinear alignment and resliced with 2mm voxels. Data was smoothed with an isotropic Gaussian kernel (8 mm full width half maximum).
Individual subject MRI data from days 1-4 were analyzed using a fixed-effects linear model. Analysis was carried out using FEAT (FMRI Expert Analysis Tool) Version 5.63, part of FSL (FMRIB’s Software Library, www.fmrib.ox.ac.uk/fsl). Time-series statistical analysis was carried out using FILM (Woolrich et al., 2001). Data were modeled with a high pass filter cutoff of 128 s, without motion parameters added to the model. The time course of BOLD activity was modeled with a design matrix containing five regressors describing movement events (10 seconds of movement alternating with 10 seconds of rest), the RMS error for each trial, the mean absolute hand acceleration (HA) for each trial, the smooth learning parameters estimated by the EM algorithm: ( w2 ) describing feedback control based on velocity and ( w3 ) describing feedforward control. The error, hand acceleration and smoothed learning parameters were entered as center-mean parametric modulations of the movement epochs, with one parameter value per movement trial, convolved with an HRF. In addition, the temporal derivatives for each of these five regressors were included. The design matrices also included 15 regressors to distinguish run effects. Examination of the covariance matrices for each of the subjects revealed minimal inter-regressor correlation.
Individual subject contrast estimates were used in a second level random effects analysis. Higher-level analysis was carried out using FLAME “1+2”, FMRIB’s Local Analysis of Mixed Effects in FSL (Beckmann et al., 2003; Woolrich et al., 2004). To reduce the problem of Type II error from multiple comparisons the group analysis proceeded in two steps. In the first step, Z (Gaussianised T/F) statistic images showing significant movement related activity were defined at a corrected level for a whole brain search volume using clusters determined by Z>1.96 and a (corrected) cluster significance threshold of P=0.05 (Worsley et al., 1992). In a second step this set of regions was used as an inclusive mask within which areas demonstrating a significant association with the other regressors were identified at two levels of analysis. In an exploratory analysis the threshold was p<0.005 with a cluster size of 40mm3 or more, based on the approximate size of the original sampling volume. In a confirmatory analysis we used a corrected threshold of p<0.05 within the movement related search volume. Resultant Z images were displayed on partially inflated cortical surfaces using the PALS dataset and Caret visualization tools (http://brainmap.wustl.edu/caret). Anatomic localization was determined from reference atlases (Duvernoy, 1991; Schmahmann et al., 1999).
Results
Behavioral Results
Positional error for both leftward and rightward movements decreased significantly over the four days of training, typical of visuomotor skill acquisition (Repeated measures ANOVA, with factors for direction: not significant (NS), trial: F=13.03, df=207, p<0.0001, and direction by trial interaction: NS), (Figure 3A). Mean absolute hand acceleration also decreased significantly over time (Figure 3B, Repeated measures ANOVA with factors for direction: NS, trial: F=22.204, df=8,207, p<0.0001, and their interaction: NS).
Figure 3.
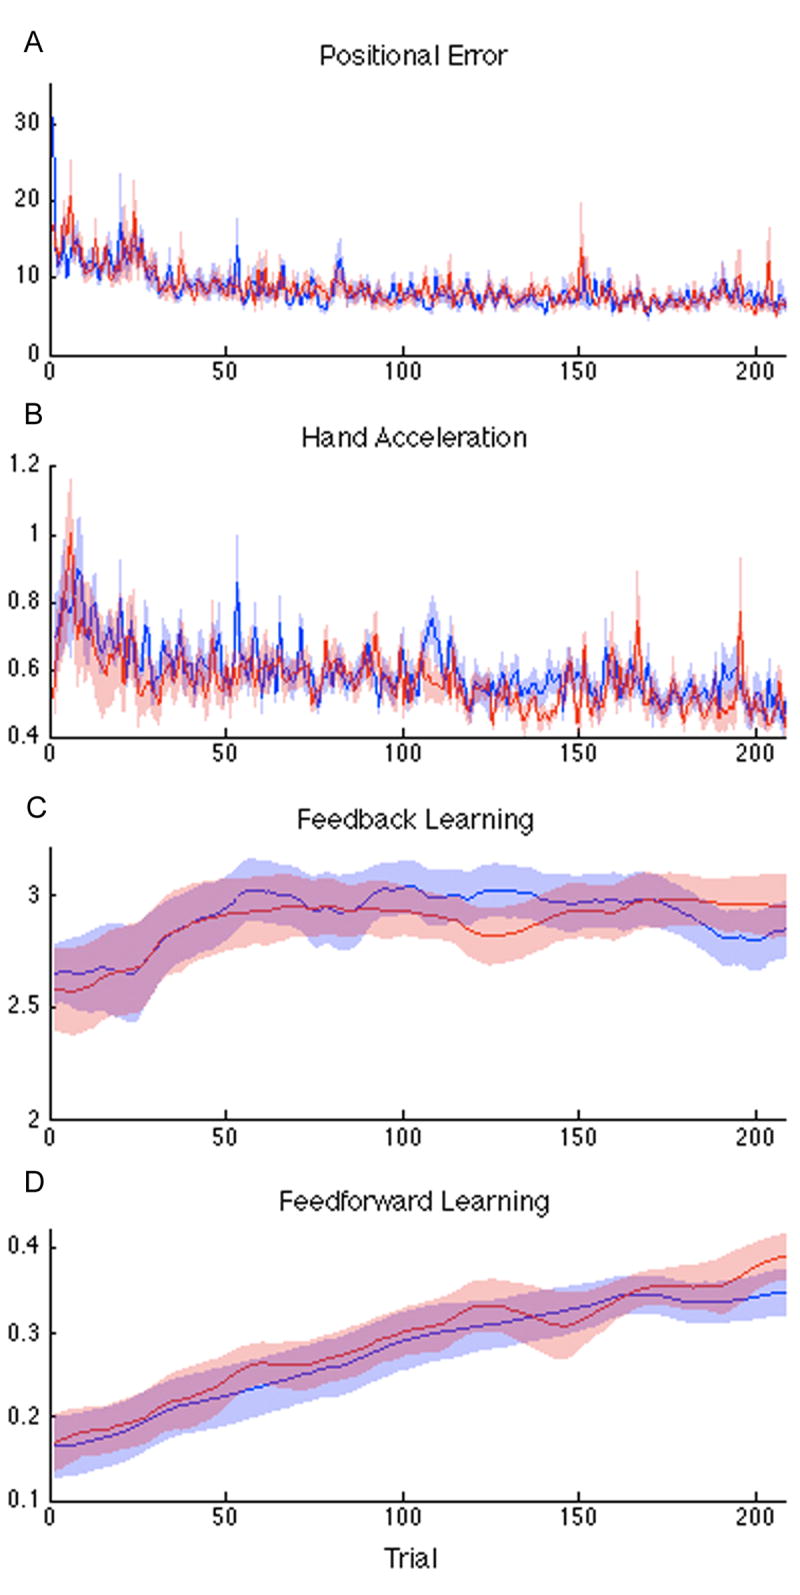
Group average performance over 4 days of training during MRI scanning for leftward (blue) and rightward (red) trials for all subjects. Shading is SEM. (A) Positional error (RMS error, arbitrary units); (B) Mean absolute hand acceleration; (C) State-space estimates for velocity dependent feedback control; (D) State-space estimates for feedforward control.
Figure 4 demonstrates the hand velocity during an early and a late trial for one subject. While the motor output in these two trials was similar, the shift from feedback control early in training to more predictive control late in training is clearly visible. The performance model (Eq. 1, dotted line) captures both the velocity profile and the changes of timing as subjects learn to make more predictive movements. The average R2 of the performance model fit for individual trials was R2=0.83. We tested the significance of the feedback and feedforward control components of the model by leaving them out separately. The average partial R2 of the feedback terms (accounting for the feedforward term) was 0.81. The average partial R2 of the feedforward term (accounting for the feedback term) rose from 0.09 for the first 10 trials to 0.33 for the last 10 trials. The inclusion of each model term produced a significantly (p<.05) better fit on 99.7% of the trials for the feedback terms and on 82% of the trials for the feedforward term. Thus, both feedforward and feedback components contributed significantly to the overall model.
Figure 4.

Model estimates for two individual trials. Representative data are taken from one subject. One trial is from the start of training (upper figure) and the other near the end (lower figure). Ideal hand velocity (thin line) was compared to actual velocity (thick line) on a trial-by-trial basis. The predicted hand velocity (dotted line), calculated from the regression estimate of the performance model, demonstrates the ability of the model to reconstruct the actual hand path. The performance model captures two sources of improvement of between early and late trials. One was the ability to use feedback more effectively, illustrated as a greater overlap between the actual hand velocity and the ideal velocity with a 150msec delay. The other was the ability to use a feedforward command, illustrated as a greater overlap between actual hand velocity and the ideal velocity with no delay.
To distinguish these learning-related changes from random trial-by-trial fluctuations, we used a state space model and EM algorithm to estimate optimally smoothed learning parameters for each subject and direction separately. The rate of change caused by learning processes, and therefore the amount of smoothing that had to be applied, were estimated. For all nine subjects, across trials, there was a high correlation between the state estimates for positional and velocity feedback parameters so only the velocity parameters were used in the subsequent MRI analyses.
At the group level, both the velocity-based feedback (Figure 3C) and feedforward (Figure 3D) components of the EM estimations increased significantly over time: velocity feedback (Repeated measures ANOVA with factors for direction: NS and trial: F=207.57, df=8,207, p<0.0001, and their interaction: NS); and feedforward (Repeated measures ANOVA with factors for direction: NS, trial: F=82.265, df=8,207, p<0.0001, and their interaction: NS). Visual inspection of the mean change at the group level revealed an early rapid control adjustment for velocity error (a similar pattern was seen for positional error) and a slow, steady rise for the state variable describing a predictive motor program.
Transfer test
To confirm that subjects were learning the task with respect to the motor pattern rather than perceptual information (Hah and Jagacinski, 1994), three transfer tasks were obtained on the fifth day of testing (Figure 1). When the nine subjects had to produce a new motor pattern because they switched to a position-based controller (AT, Position control) or because they used the original controller, but a different input function (AT’ Rate control), positional error increased significantly (Figure 5). However, when both the controller and the input function (AT’, Position Control) were switched, such that the required movement pattern was the same as in training, there was no increase in error compared to the original task. In the 3-way ANOVA, the main effect of trial direction, Controller type and Input type were all non-significant. There was a significant Controller X Input interaction: F=18.771, df=48, p<0.0001. No other 2-way or 3-way interactions were significant. This pattern of errors with transfer tasks established that the subjects were learning the required movement and not the input pattern. Furthermore, subjects could generate the correct movement irrespective of the type of controller.
Figure 5.
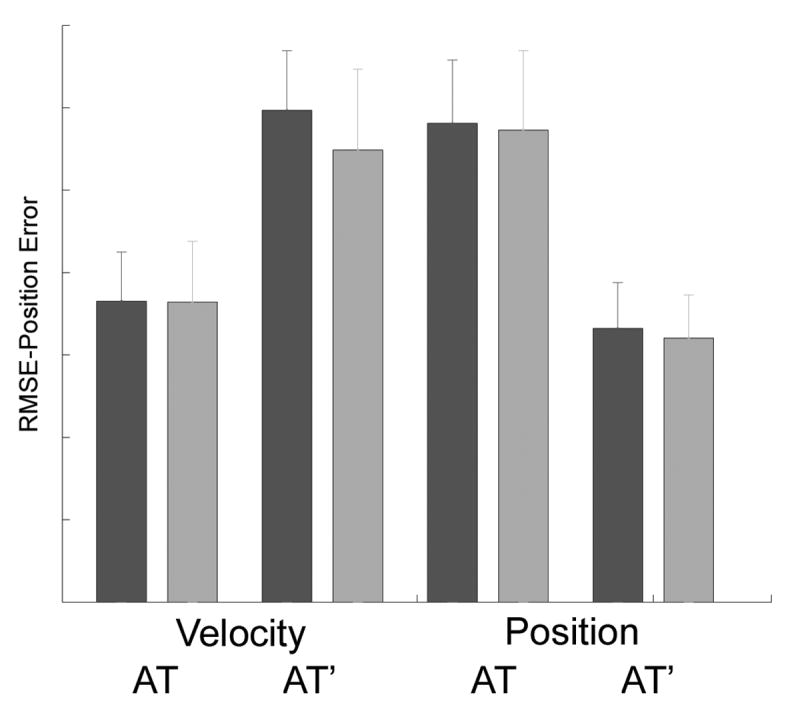
Performance error during transfer tasks. Subjects trained for 4 days on a velocity based controller, with an arc tan input funtion (AT) alternating in left and right directions. On day 5 they were tested with a velocity or position based controller, and with the original input or its derivative (AT’). A position controller with the AT’ input required the same motor as in training. Leftward (dark bars) and righward (light bars) trials show similar results.
Correlation of regressors
For the analysis of the neural correlates of feedforward and feedback control learning, it is essential that these factors can be estimated independently from each other and from other behavioral measures. We therefore calculated the correlation of hand acceleration, positional error, and the smoothed learning parameters representing feedback and feedforward control for each individual. One subject had very strong correlations between all four parameters (minimum pair wise R2 of .44, maximum R2 of .89) and therefore was excluded from all of the subsequent analyses. Of the remaining nine subjects, 80% of the inter-parameter correlations had an R2 < .28 and 90% had an R2 < .38. This establishes that for the majority of subjects, motor output, movement error and learning variables could be estimated independently.
Brain Activation during Motor Execution
The contrast of movement versus rest identified a broad set of cortical and subcortical areas classically associated with motor execution including left sensorimotor cortex, bilateral parietal and premotor cortices, mesial motor areas, bilateral anterior cerebellar cortex, the basal ganglia and thalamus (Figure 6). These findings replicate many prior studies of motor execution and local maxima are not presented. This contrast was generated to serve as a mask within which the subsequent contrasts were tested.
Figure 6.
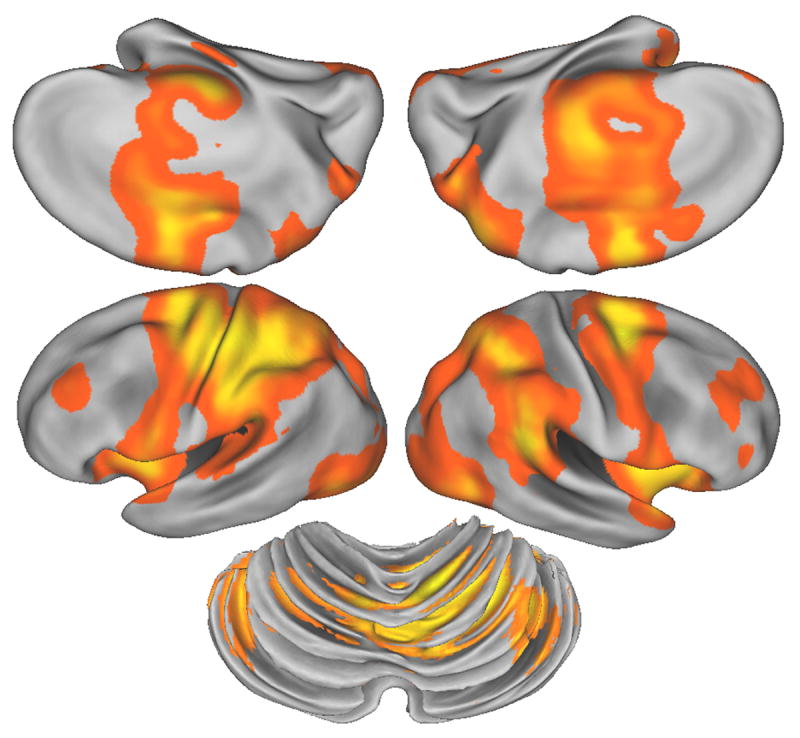
BOLD signal correlation with compensatory tracking versus rest. All colored areas represent significant activation, corrected for whole brain comparisons, (n=9 subjects). This map was used as a mask for the subsequent MRI analyses. Left column is left hemisphere, mesial surface is upper row. Lower central figure is posterior, superior oblique view of the cerebellum. All figures are partially “inflated” representations using the Caret software. Statistical threshold p<0.05 for the likelihood of detecting a cluster within a whole brain search volume.
Brain Correlates of Motor Kinematics
The correlation between absolute mean hand acceleration for each trial and the BOLD signal, corrected for multiple comparisons, identified significant two motor areas: left sensorimotor cortex and right anterior cerebellar cortex (lobule V). Locations of these sites are summarized in Table 1 and shown in Figure 7A. The sensorimotor site extended into both the pre and post-central gyri and was maximal over the hand area within the central sulcus. No additional areas were identified when the threshold was reduced for an exploratory analysis.
Table 1.
| Estimation
Parameter |
Anatomic
Region |
Brodmann’s
Area |
Talairach Coordinate (mm) | Z-scores | ||||||
|---|---|---|---|---|---|---|---|---|---|---|
| X | Y | Z | Volume (mm3) | Error | Hand Accel | Feedback | Feedforward | |||
| Error | ||||||||||
| Right Inferior Parietal Lobule | 40 | 52 | -48 | 32 | 63720 | 4.76 | 0.19 | 1.13 | -0.67 | |
| Left Superior Parietal Lobule | 7 | -10 | -58 | 56 | 4.61 | 0.56 | 0.24 | -1.81 | ||
| Left Inferior Parietal Lobule | 40 | -60 | -46 | 34 | 4.59 | 1.27 | 1.75 | -0.53 | ||
| Right Superior Frontal Gyrus, medial segment (pre-SMA) | 8 | 6 | 24 | 48 | 4.38 | 0.82 | -0.25 | -0.88 | ||
| Bilateral Anterior Cingulate Gyrus | 24,32 | 4 | 12 | 34 | 4.31 | 1.13 | 1.08 | -0.73 | ||
| Left Globus Pallidus | -14 | -2 | 0 | 19040 | 3.93 | 0.58 | -1 | -1.59 | ||
| Right Posterior Cerebellum (Lobule VI) | 30 | -56 | -28 | 3.81 | 1.842 | -0.33 | -2.5 | |||
| Right Anterior Cerebellum (Lobule V) | 18 | -50 | -22 | 3.58 | 1.52 | -2.12 | -1.8 | |||
| Right Posterior Cerebellum (Lobule VI) | 6 | -74 | -24 | 3.62 | 1.36 | -1.14 | -1.84 | |||
| Right Frontal Operculum | 44,45 | 44 | 22 | -6 | 14000 | 3.99 | -0.86 | 0.89 | -1.27 | |
| Right Anterior Superior Temporal Sulcus | 38 | 52 | 16 | -18 | 3.8 | 1.18 | 1.61 | -1.68 | ||
| Right Superior Frontal Sulcus | 6 | 30 | 8 | 58 | 7992 | 4.17 | 1.3 | 0.72 | -1.77 | |
| Right Dorsal Precentral Sulcus | 6 | 44 | 0 | 52 | 3.66 | 0.83 | -0.46 | -1.73 | ||
| Right Superior Frontal Gyrus, medial segment (pre-SMA) | 6 | 6 | 6 | 66 | 3.19 | 1 | 0.77 | -1.49 | ||
| Hand Acceleration | ||||||||||
| Left Central Sulcus (SensoriMotor Cortex) | 3,1,2,4 | -38 | -24 | 66 | 11712 | -0.76 | 4.17 | -0.84 | 0.42 | |
| Right Anterior Cerebellum (Lobule V) | 26 | -44 | -36 | 9392 | -0.11 | 3.91 | 0.76 | -0.92 | ||
| Feedback Learning | ||||||||||
| Right Posterior Intraparietal Sulcus | 7 | 38 | -60 | 60 | 368 | 1.96 | -0.33 | 3.162 | 0.10 | |
| Left Posterior Superior Parietal Lobule | 7 | -22 | -72 | 62 | 40 | -0.29 | 0.21 | 2.459 | -0.01 | |
| Right Anterior Intraparietal Sulcus | 40 | 58 | -26 | 42 | 104 | 0.06 | 0.34 | 2.72 | 1.60 | |
| Right Ventral Precentral Gyrus | 6 | 54 | -2 | 44 | 64 | -0.13 | -0.57 | 2.46 | -0.19 | |
| Left Cingulate Sulcus (Cingulate Motor Area) | 5,24 | -14 | -28 | 44 | 40 | 2.28 | 1.74 | 2.396 | 2.44 | |
| Right Ventral Precentral Gyrus | 44 | 60 | 8 | 16 | 136 | -0.13 | -0.43 | 3.045 | 0.32 | |
| Right Middle Occipital Gyrus | 18 | 36 | -84 | 4 | 184 | 0.15 | -0.36 | 2.816 | -0.09 | |
| Left Inferior Occipital Gyrus | 18 | -50 | -74 | -12 | 40 | 1.65 | -1.31 | 2.49 | -1.36 | |
| Feedforward Learning | ||||||||||
| Left Posterior Superior Frontal Sulcus (PMd) | 6 | -22 | -18 | 52 | 1792 | 0.35 | 0.91 | 0.96 | 2.867 | |
| Right Superior Frontal Gyrus: Medial Segment (SMA) | 6 | 14 | -12 | 56 | 304 | 0.72 | 0.62 | -0.28 | 2.54 | |
| Left Postcentral Gyrus (Sensory Cortex) | 3,1,2 | -40 | -38 | 68 | 264 | -0.46 | 1.27 | -0.73 | 3.29 | |
| Left Intraparietal Sulcus | 7,40 | -46 | -42 | 46 | 56 | -1.00 | 1.63 | 0.96 | 2.66 | |
| Left Inferior Parietal Lobule | 40 | -52 | -28 | 34 | 168 | -1.44 | 1.82 | 1.09 | 2.894 | |
| Left Precentral Gyrus (Motor cortex) | 4 | -26 | -22 | 62 | 256 | 0.79 | 1.69 | 1.16 | 3.666 | |
| Left Cingulate Sulcus (CMA) | 5,24 | -14 | -30 | 40 | 232 | 3.42 | 1.47 | 1.47 | 2.995 | |
| Right Inferior Occipital Gyrus | 18 | 28 | -94 | -14 | 424 | -1.96 | -0.92 | 0.46 | 3.019 | |
| Left Inferior Occipital Gyrus | 18 | -30 | -96 | -18 | 128 | 0.24 | 0.25 | 0.28 | 2.866 | |
Figure 7.
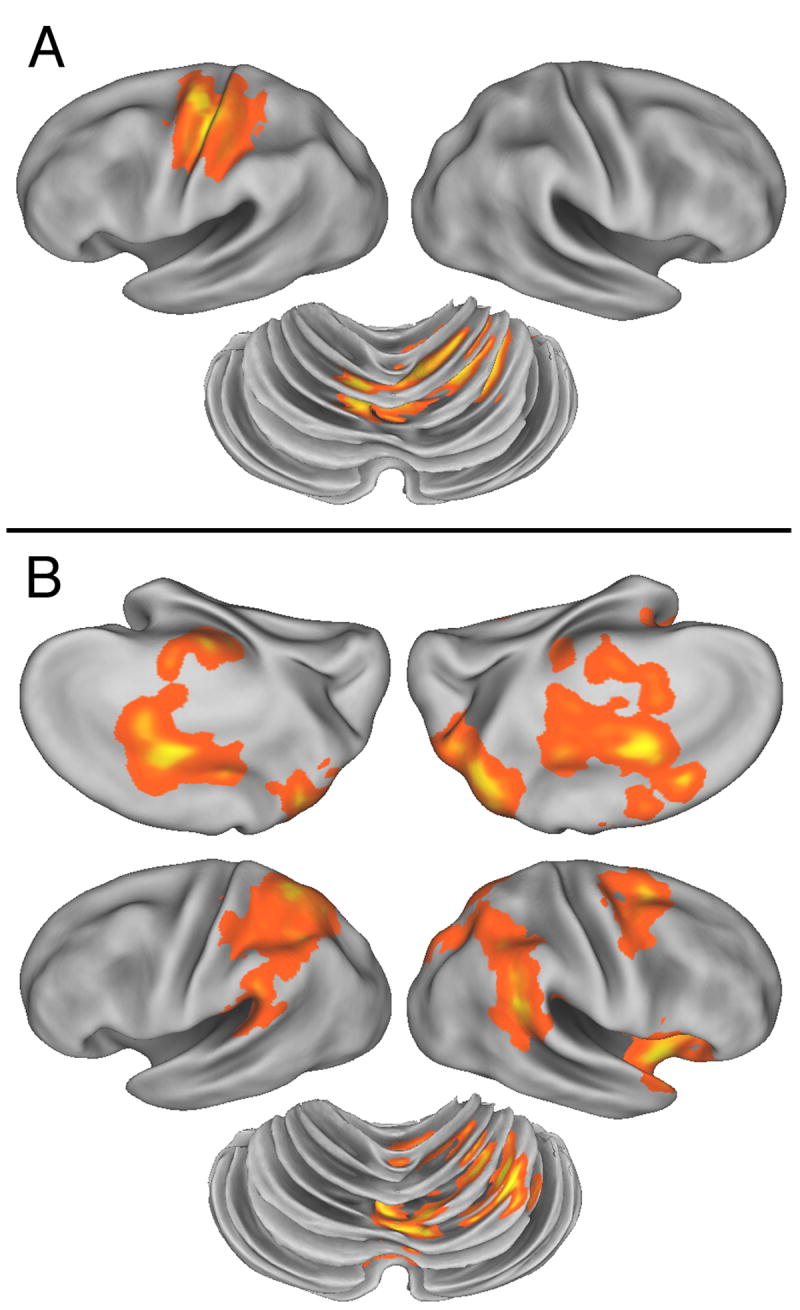
A. BOLD signal correlation with (A) mean absolute hand acceleration; and (B) with positional error. Colored areas show significant correlation within the movement mask shown in figure 5. Same orientations as figure 5. Statistical threshold p<0.05 for the likelihood of detecting a cluster within the volume defined by movement.
Brain Correlates of Motor Error
Performance error correlated with a large set of cortical and subcortical brain regions (Figure 7B, Table 1). Strong positive correlations were identified in bilateral intraparietal sulcus and inferior parietal lobule as well as the posterior SPL extending into the medial wall. An additional strong correlation was found in bilateral anterior cingulate gyrus and adjacent sulcus. Error also correlated with right dorsal premotor cortex and frontal operculum. Performance error also recruited activity at three sites within right cerebellar cortex in lobules V and VI. Given the extensive network that was engaged when a threshold based on correction for multiple comparisons was used, further exploratory analysis were not performed.
Feedback Learning
The model estimates of feedback control describe how subjects slowly modulated the use of feedback across trials. High values indicate a strong reaction to visual feedback error, independent of the size of that error. At an exploratory threshold, these estimates correlated with activity in bilateral posterior superior parietal lobule and right anterior IPS and adjacent IPL (Figure 8A, Table 1). In addition there was recruitment of three sites within the right ventral premotor cortex and the left cingulate motor area. Bilateral correlations were detected in the inferior occipital gyri. No significant correlations were observed in the cerebellum or other subcortical areas.
Figure 8.
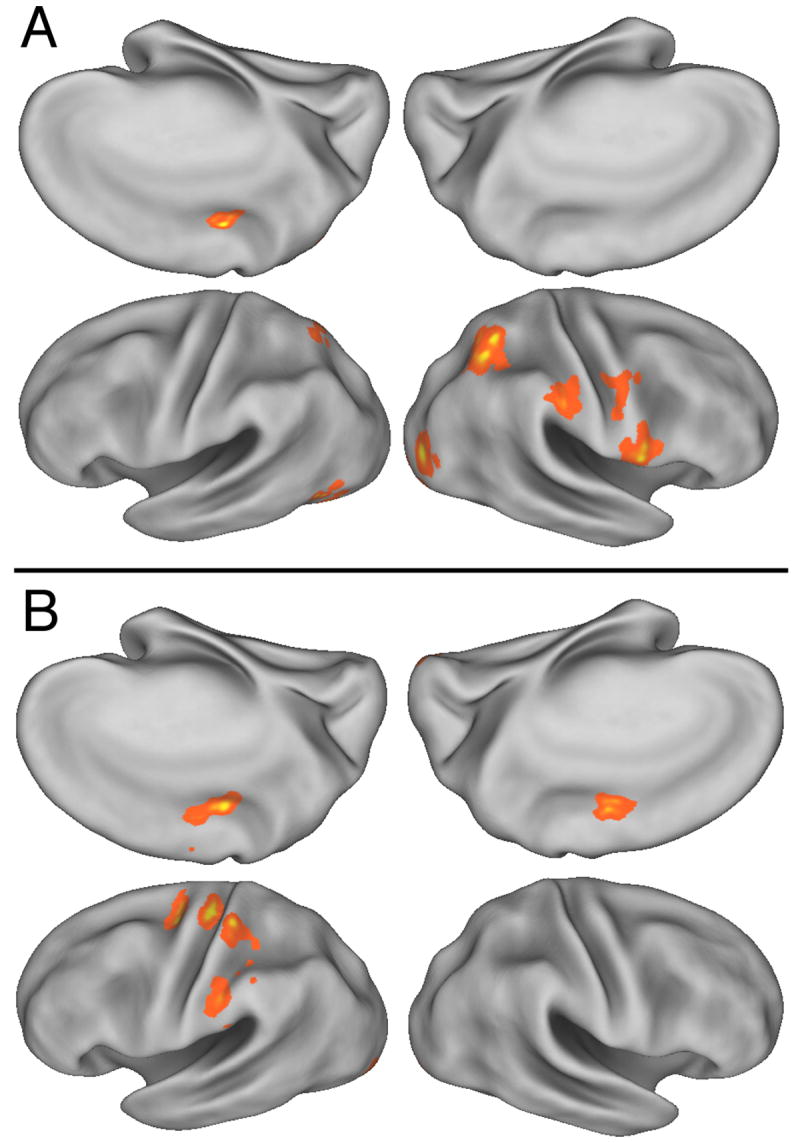
BOLD signal correlation with (A) the learning of velocity-dependent feedback control; and (B) learning a predictive feedforward motor program. Colored areas show significant correlation within the movement mask shown in figure 6. Same orientations as figure 6. Statistical threshold was p<0.005 within the volume defined by movement.
Feedforward Learning
Participants gradually acquired the ability to generate the desired limb movement predictively. At an exploratory threshold we found that the BOLD signal in the left inferior parietal lobule (supramarginal gyrus) and adjacent intraparietal sulcus, left dorsal premotor cortex, adjacent sensorimotor cortex and the cingulate sulcus in the region of the cingulate motor area (Figure 8B, Table 1) correlated positively with the gradual increase in the feedforward control parameter. No significant correlations were observed in the cerebellum or other subcortical areas.
Functional Similarities
Visual comparison of the spatial extent of the activation patterns for the two performance and two learning parameters identified a small set of overlapping activations. Within the cerebellum, there was a common recruitment of right anterior cerebellar cortex as a function of both hand acceleration and error. The cingulate sulcus in the region of the CMA was recruited for error, feedback and feedforward learning. The left sensorimotor cortex was recruited for both hand acceleration and feedforward learning. Bilateral posterior SPL was recruited as a function of both error and feedback learning. We also tabulated the effect sizes (reflected as z-scores) at the peak of each location for all of the parameters, summarized in Table 1. In general, only a few sites demonstrated strong (Z>2) effects for more than one parameter. At a weaker level of significance, there was a tendency for areas with a positive effect with error to show a negative effect with feedforward learning.
Discussion
We examined the formation of a pair of simple symmetric motor programs of fixed duration and amplitude. Detailed analysis by our learning model showed that improvement occurred because of both adjustments in feedback control as well as the acquisition of feedforward control. The parameters describing feedback and feedforward learning showed only weak trial by trial correlations for 9 of 10 participants, allowing us to identify underlying neural substrates for these two sources of learning.
The current results show that different components of learning operate on different time scales. Feedforward learning was still far from perfect even after 4 days of practice. In contrast, subjects’ adjustment of feedback control was more rapid and reached a steady state within approximately 2 days. Accordingly, tracking error decreased rapidly on the first day and showed only minor changes by the last day. These results support the proposition that feedback and feedforward processes operate at the same time, with changes in each occurring at different rates (Smith et al., 2006). This is an important alternative to a traditional cognitive based framework where skill learning is considered to occur in sequential stages (James, 1890; Bryan and Harter, 1897; Bryan and Harter, 1899; Doyon et al., 1998; Floyer-Lea and Matthews, 2005; Lehericy et al., 2005).
We identified performance parameters with a regression method, then separated feedforward learning and feedback learning from trial-to-trial variability by using a state-space model. Our two-stage modeling approach rests on three important assumptions. The first assumption was that the hand behavior could be described with a simple proportional-derivative control law. In the version used, the hand velocity was described in terms of positional and velocity error as well as the input function. This model ignores position-dependent and inertial components of the limb dynamics. Given the simplicity of the task (rotation around the forearm with a nearly frictionless system), this simplification is not unreasonable. Second, the performance model assumed that the control law could treat feedforward and feedback control processes within each trial as independent control processes, based on the intrinsic timing delay inherent in feedback control. Similar strategies have been used to analyze EMG responses related to feedback or feedforward learning in two-dimensional adaptive reaching in force fields (Thoroughman and Shadmehr, 1999). This assumption was supported by the lack of correlation between feedback and feedforward parameters across trials for each subject. However, it is most likely that feedforward and feedback control interact with each other in more complicated ways. More refined experimental methods using both predictable and unpredictable input functions are needed to fully understand the interaction between feedforward learning and modulation of feedback control policy. The third assumption is that learning related changes of motor performance would be smooth, reflecting the incremental improvements in motor control due to learning. The amount of smoothing was estimated from the data itself with an EM algorithm. This approach has been shown to be an improvement over linear fitting approaches (Cheng and Sabes, 2006) for characterizing learning. We were able to arrive at a principled and optimal solution for identifying the magnitude of these incremental changes of learning parameters in the setting of significant performance noise.
Feedforward Learning in a left-lateralized network
The imaging results indicate that feedforward learning correlates with activity in a left-hemispheric network including the left inferior parietal cortex (supramarginal gyrus), left dorsal premotor cortex, adjacent sensorimotor cortex and the cingulate motor area. Premotor cortex is strongly associated with motor planning and anticipatory control prior to movement onset (Mitz et al., 1991; Shen and Alexander, 1997; Crammond and Kalaska, 2000; Wise and Murray, 2000) (Hoshi and Tanji, 2006). Our results generalize this to a condition of anticipatory control while the movement is executed. Left rostral IPL including supramarginal gyrus (SMG) is also strongly associated with retrieving action knowledge, goal oriented actions, pantomime and imitation and lesions here also cause apraxia (Rushworth et al., 1998; Haaland et al., 2000; Johnson-Frey et al., 2005). Rostral IPL and SMG activity are also correlated with the retrieval of both complex and sequential actions or intentions, (Fogassi et al., 2005; Fogassi and Luppino, 2005). We speculate that a network between IPL and dorsal premotor areas forms either a repository for learned skills or at least a scaffold for retrieving and organizing motor memories that are more widely distributed throughout the brain. Learning effects were also observed within left motor cortex. Although the motor cortex was also observed to change as a function of hand acceleration, this kinematic parameter and the feedforward learning model estimates were not correlated. Therefore, the BOLD signal in motor cortex appears to be sensitive both to performance variability and learning related changes. Recent imaging and neurophysiological studies suggest a role for motor cortex in skill learning of sequences (Grafton et al., 1995; Grafton et al., 1998; Karni et al., 1998; Corbetta and Shulman, 2002; Matsuzaka et al., 2007) as well as visuomotor tracking (Grafton et al., 1992; Grafton et al., 2001).
The strong left-lateralization of the BOLD correlation with feedforward learning parameters could be due to the fact that the acquired skill was specific to the right hand. While transfer results on day 5 showed that participants had learned a specific movement, rather than a perceptual representation of the perturbation pattern, it remains unknown how well it could generalize to the left hand (Yamamoto et al., 2006). Alternatively, the left-hemispheric bias may reflect a specialization for the left-hemisphere to store motor skills and action vocabularies (Haaland et al., 2000; Johnson-Frey et al., 2005).
There were relevant negative findings. There was no evidence for a change in signal strength in the cerebellum in relationship to the measures of feedforward learning. Although negative inference is weak with functional imaging, the lack of a finding in cerebellum merits consideration given the longstanding role of this structure for learning across a broad range of skills. Reconciliation of our negative cerebellum results with this fact may ultimately rest on recognition that motor skills are not all the same. While there is strong evidence for adaptive learning to changes of kinematics or dynamics within the cerebellum, there is very little evidence that the cerebellum actually stores memories for new motor programs such as the new movement that subjects learned in our experiment. Loss of the cerebellum does not result in the loss of retrieving and executing complex motor elements for behaviors such as reaching, grasping or riding a bicycle. Rather, the ability to control these elements when the context is manipulated (via rotation, force field or temporal delay) are lost with cerebellar lesions. Similarly, cerebellar activity in functional studies is strongly activated by these manipulations. The feedforward learning parameter in our study captured the extent to which subjects could retrieve a novel movement. The lack of change in cerebellum is further evidence that motor programs are not stored or retrieved in cerebellum. The finding is consistent with the proposition that complex motor programs are stored cortically, and adjusted or modified via cerebellar modulation (Smith and Shadmehr, 2005).
Learning of feedback control
Increases in the use of feedback most strongly recruited the bilateral posterior superior parietal lobule and right anterior intraparietal sulcus and adjacent IPL. In addition there was involvement of the right ventral precentral gyrus (PMv). The anterior SPL, bilaterally, has recently been shown to be more active in a 2-dimensional reaching task with kinematic errors that lead to learning (Diedrichsen et al., 2005). Learning related increases of activity in right ventral premotor cortex and right posterior right intraparietal sulcus have been observed during a right-handed visuomotor adaptation tasks (Shadmehr and Holcomb, 1997; Krakauer et al., 2004). Both adaptation to a visuomotor rotation and changes in feedback control during tracking require a change in the mapping between visual error and motor commands via parietal-premotor circuits. Of note, there was no correlation between changing feedback control policy and cerebellar activity. These results show that the smooth, learning related changes in how feedback is used across trials taking place at a cortical rather than subcortical level.
Cerebellum and error related activity
Cerebellar cortex was strongly correlated with the magnitude of tracking error and the magnitude of the motor correction. The anatomic location is in the anterior parasagittal cerebellar cortex corresponding to the intermediate functional zone based on output via the interpositus nucleus, a zone that is most commonly associated with the control of limb movements. Similar findings in the cerebellar cortex (lobules V, VI and VIII) were found for error during reaching (Diedrichsen et al., 2005). Here the cerebellar cortex was activated equally for any type of reach error, not matter if that error led to subsequent learning or not. The current study extends this finding by showing a trial-by-trial variation of activity in these sites corresponding to the magnitude of perceived error. Cerebellar correlations with perceived error have also been identified in visuomotor tracking requiring eye-hand coordination (Miall et al., 2000; Miall et al., 2001; Miall and Jenkinson, 2005) and with violations of expected sensory predictions in eye blink conditioning (Ramnani et al., 2000). In the current study, error processing in the cerebellar cortex may relate to feedback control based on state information provided by mossy fiber inputs from motor areas and training signals via climbing fibers to change the motor command on a moment to moment basis, without indicating the locus for a motor memory across trials.
Medial motor areas
On the lateral surface of the brain we found a spatial separation (also reflected in the z-scores, Table 1) between sites involved in learning feedback and feedforward control. In contrast, the medial cingulate motor area (CMA) showed correlation with both learning processes. In humans the CMA lies inferior to the SMA proper and is variably recruited across a broad range of motor tasks (Picard and Strick, 1996). In non-human primates, CMA neurons are recruited during either preparation or execution and there is a greater proportion of neurons recruited during execution than the adjacent SMA (Backus et al., 2001; Dum and Strick, 2002; Russo et al., 2002). CMA neurons have also been characterized as monitoring events, perhaps by keeping track of the progress of required behavioral tasks (Hoshi et al., 2005). In the current study the CMA was also correlated weakly with the magnitude of error from trial to trial. Thus, this site may play an integrative role in execution and on-line monitoring.
Error magnitude from trial to trial was strongly correlated with anterior cingulate gyrus activity. This rostral sector of the cingulate cortex is well known to be involved in executive control, conflict monitoring, error detection and task evaluation (Carter et al., 1998; Rushworth et al., 2003; Rushworth et al., 2004). The current results are most supportive of an on-line evaluative role of task performance that is directly sensitive to the magnitude of error.
Summary
Our results demonstrate partially separable brain substrates for feedforward and feedback related control. Except for the cingulate motor area, different brain regions were recruited for these two sources of learning. Although functionally distinct, all of the areas recruited for these sources are richly interconnected anatomically, many with direct connections (Clower et al., 2005; Rozzi et al., 2005; Rushworth et al., 2005) allowing for the dynamic interchange of on-line control and predictive commands to achieve behavioral goals.
Acknowledgments
The authors thank Antonia Hamilton and Eugene Tunik for their helpful comments. Current affiliations: Scott T. Grafton MD, Department of Psychology and The Sage Center for the Study of the Mind, University of California, Santa Barbara, CA. Jack Van Horn, Laboratory of Neuro Imaging, UCLA School of Medicine, Los Angeles CA. Jörn Diedrichsen, School of Psychology, University of Wales, Bangor, Wales.
Grants: Supported by PHS grant NS33504.
Footnotes
Publisher's Disclaimer: This is a PDF file of an unedited manuscript that has been accepted for publication. As a service to our customers we are providing this early version of the manuscript. The manuscript will undergo copyediting, typesetting, and review of the resulting proof before it is published in its final citable form. Please note that during the production process errors may be discovered which could affect the content, and all legal disclaimers that apply to the journal pertain.
References
- Adams JA. Historical review and appraisal of research on the learning, retention and transfer of human motor skills. Psychol Bull. 1987;101:41–74. [Google Scholar]
- Backus DA, Ye S, Russo GS, Crutcher MD. Neural activity correlated with the preparation and execution of visually guided arm movements in the cingulate motor area of the monkey. Exp Brain Res. 2001;140:182–189. doi: 10.1007/s002210100807. [DOI] [PubMed] [Google Scholar]
- Baddeley RJ, Ingram HA, Miall RC. System identification applied to a visuomotor task: near-optimal human performance in a noisy changing task. J Neurosci. 2003;23:3066–3075. doi: 10.1523/JNEUROSCI.23-07-03066.2003. [DOI] [PMC free article] [PubMed] [Google Scholar]
- Beckmann CF, Jenkinson M, Smith SM. General multilevel linear modeling for group analysis in FMRI. Neuroimage. 2003;20:1052–1063. doi: 10.1016/S1053-8119(03)00435-X. [DOI] [PubMed] [Google Scholar]
- Bryan WL, Harter N. Studies in the physiology and psychology of telegraphic language. Psychol Rev. 1897;4:27–53. [Google Scholar]
- Bryan WL, Harter N. Studies on the telegraphic language, the acquisition of a hierarchy of habits. Psychol Rev. 1899;6:345–375. [Google Scholar]
- Carter CS, Braver TS, Barch DM, Botvinick MM, Noll D, Cohen JD. Anterior cingulate cortex, error detection, and the online monitoring of performance. Science. 1998;280:747–749. doi: 10.1126/science.280.5364.747. [DOI] [PubMed] [Google Scholar]
- Cheng S, Sabes PN. Modeling sensorimotor learning with linear dynamical systems. Neural Comput. 2006;18:760–793. doi: 10.1162/089976606775774651. [DOI] [PMC free article] [PubMed] [Google Scholar]
- Clower DM, Dum RP, Strick PL. Basal ganglia and cerebellar inputs to ‘AIP’. Cereb Cortex. 2005;15:913–920. doi: 10.1093/cercor/bhh190. [DOI] [PubMed] [Google Scholar]
- Corbetta M, Shulman GL. Control of goal-directed and stimulus-driven attention in the brain. Nat Rev Neurosci. 2002;3:201–215. doi: 10.1038/nrn755. [DOI] [PubMed] [Google Scholar]
- Crammond DJ, Kalaska JF. Prior information in motor and premotor cortex: activity during the delay period and effect on pre-movement activity. J Neurophysiol. 2000;84:986–1005. doi: 10.1152/jn.2000.84.2.986. [DOI] [PubMed] [Google Scholar]
- Della-Maggiore V, McIntosh AR. Time course of changes in brain activity and functional connectivity associated with long-term adaptation to a rotational transformation. J Neurophysiol. 2005;93:2254–2262. doi: 10.1152/jn.00984.2004. [DOI] [PubMed] [Google Scholar]
- Dettmers C, Connelly A, Stephan KM, Turner R, Friston KJ, Frackowiak RS, Gadian DG. Quantitative comparison of functional magnetic resonance imaging with positron emission tomography using a force-related paradigm. Neuroimage. 1996;4:201–209. doi: 10.1006/nimg.1996.0071. [DOI] [PubMed] [Google Scholar]
- Diedrichsen J, Hashambhoy Y, Rane T, Shadmehr R. Neural correlates of reach errors. J Neurosci. 2005;25:9919–9931. doi: 10.1523/JNEUROSCI.1874-05.2005. [DOI] [PMC free article] [PubMed] [Google Scholar]
- Donchin O, Francis JT, Shadmehr R. Quantifying generalization from trial-by-trial behavior of adaptive systems that learn with basis functions: theory and experiments in human motor control. J Neurosci. 2003;23:9032–9045. doi: 10.1523/JNEUROSCI.23-27-09032.2003. [DOI] [PMC free article] [PubMed] [Google Scholar]
- Doyon J, Laforce R, Jr, Bouchard G, Gaudreau D, Roy J, Poirier M, Bedard PJ, Bedard F, Bouchard JP. Role of the striatum, cerebellum and frontal lobes in the automatization of a repeated visuomotor sequence of movements. Neuropsychologia. 1998;36:625–641. doi: 10.1016/s0028-3932(97)00168-1. [DOI] [PubMed] [Google Scholar]
- Dum RP, Strick PL. Motor areas in the frontal lobe of the primate. Physiol Behav. 2002;77:677–682. doi: 10.1016/s0031-9384(02)00929-0. [DOI] [PubMed] [Google Scholar]
- Duvernoy H. Surface, three-dimensional sectional anatomy and MRI. Springer-Verlag; Wien: 1991. The Human Brain. [Google Scholar]
- Fisher BE, Winstein CJ, Velicki MR. Deficits in compensatory trajectory adjustments after unilateral sensorimotor stroke. Exp Brain Res. 2000;132:328–344. doi: 10.1007/s002219900316. [DOI] [PubMed] [Google Scholar]
- Fitts PM. Perceptual-motor skill learning. In: Melton AW, editor. Categories of human learning. Academic Press; New York: 1964. pp. 243–285. [Google Scholar]
- Floyer-Lea A, Matthews PM. Distinguishable brain activation networks for short- and long-term motor skill learning. J Neurophysiol. 2005;94:512–518. doi: 10.1152/jn.00717.2004. [DOI] [PubMed] [Google Scholar]
- Fogassi L, Ferrari PF, Gesierich B, Rozzi S, Chersi F, Rizzolatti G. Parietal lobe: from action organization to intention understanding. Science. 2005;308:662–667. doi: 10.1126/science.1106138. [DOI] [PubMed] [Google Scholar]
- Fogassi L, Luppino G. Motor functions of the parietal lobe. Curr Opin Neurobiol. 2005;15:626–631. doi: 10.1016/j.conb.2005.10.015. [DOI] [PubMed] [Google Scholar]
- Foulkes AJ, Miall RC. Adaptation to visual feedback delays in a human manual tracking task. Exp Brain Res. 2000;131:101–110. doi: 10.1007/s002219900286. [DOI] [PubMed] [Google Scholar]
- Fuchs AH. The progression-regression hypothesis in perceptual-motor skill learning. J Exp Psychol. 1962;63:177–182. doi: 10.1037/h0041569. [DOI] [PubMed] [Google Scholar]
- Garvey WD. A comparison of the effects of training and secondary tasks on tracking behavior. J Appl Psychol. 1960;44:370–375. [Google Scholar]
- Grafton ST, Hazeltine E, Ivry R. Functional anatomy of sequence learning in normal humans. J Cogn Neurosci. 1995;7:497–510. doi: 10.1162/jocn.1995.7.4.497. [DOI] [PubMed] [Google Scholar]
- Grafton ST, Hazeltine E, Ivry RB. Abstract and effector-specific representations of motor sequences identified with PET. J Neurosci. 1998;18:9420–9428. doi: 10.1523/JNEUROSCI.18-22-09420.1998. [DOI] [PMC free article] [PubMed] [Google Scholar]
- Grafton ST, Mazziotta JC, Presty S, Friston KJ, Frackowiak RS, Phelps ME. Functional anatomy of human procedural learning determined with regional cerebral blood flow and PET. J Neurosci. 1992;12:2542–2548. doi: 10.1523/JNEUROSCI.12-07-02542.1992. [DOI] [PMC free article] [PubMed] [Google Scholar]
- Grafton ST, Salidis J, Willingham DB. Motor learning of compatible and incompatible visuomotor maps. J Cogn Neurosci. 2001;13:217–231. doi: 10.1162/089892901564270. [DOI] [PubMed] [Google Scholar]
- Grafton ST, Woods RP, Tyszka JM. Functional imaging of procedural motor learning: relating cerebral blood flow with individual subject performance. Human Brain Mapping. 1994;1:221–234. doi: 10.1002/hbm.460010307. [DOI] [PubMed] [Google Scholar]
- Graybiel AM. The basal ganglia. Curr Biol. 2000;10:R509–511. doi: 10.1016/s0960-9822(00)00593-5. [DOI] [PubMed] [Google Scholar]
- Graydon FX, Friston KJ, Thomas CG, Brooks VB, Menon RS. Learning-related fMRI activation associated with a rotational visuo-motor transformation. Brain Res Cogn Brain Res. 2005;22:373–383. doi: 10.1016/j.cogbrainres.2004.09.007. [DOI] [PubMed] [Google Scholar]
- Haaland KY, Harrington DL, Knight RT. Neural representations of skilled movement. Brain. 2000;123:2306–2313. doi: 10.1093/brain/123.11.2306. [DOI] [PubMed] [Google Scholar]
- Hah S, Jagacinski RJ. The relative dominance of schemata in a manual tracking task: Input patterns, system dynamics and movement patterns. J Motor Behav. 1994;26:204–214. doi: 10.1080/00222895.1994.9941676. [DOI] [PubMed] [Google Scholar]
- Hazeltine E, Grafton ST, Ivry R. Attention and stimulus characteristics determine the locus of motor-sequence encoding. A PET study. Brain. 1997;120(Pt 1):123–140. doi: 10.1093/brain/120.1.123. [DOI] [PubMed] [Google Scholar]
- Hoshi E, Sawamura H, Tanji J. Neurons in the rostral cingulate motor area monitor multiple phases of visuomotor behavior with modest parametric selectivity. J Neurophysiol. 2005;94:640–656. doi: 10.1152/jn.01201.2004. [DOI] [PubMed] [Google Scholar]
- Hoshi E, Tanji J. Differential involvement of neurons in the dorsal and ventral premotor cortex during processing of visual signals for action planning. J Neurophysiol. 2006;95:3596–3616. doi: 10.1152/jn.01126.2005. [DOI] [PubMed] [Google Scholar]
- Imamizu H, Miyauchi S, Tamada T, Sasaki Y, Takino R, Putz B, Yoshioka T, Kawato M. Human cerebellar activity reflecting an acquired internal model of a new tool. Nature. 2000;403:192–195. doi: 10.1038/35003194. [DOI] [PubMed] [Google Scholar]
- Jagacinski RJ, Greenberg N, Liao MJ, Wang J. Manual performance of a repeated pattern by older and younger adults with supplementary auditory cues. Psychol Aging. 1993;8:429–439. doi: 10.1037//0882-7974.8.3.429. [DOI] [PubMed] [Google Scholar]
- Jagacinski RJ, Hah S. Progression-regression effects in tracking repeated patterns. J Exp Psychol: Hum Percep Perf. 1988;14:77–88. doi: 10.1037//0096-1523.14.1.77. [DOI] [PubMed] [Google Scholar]
- Jagacinski RJ, Liao MJ, Fayyad EA. Generalized slowing in sinusoidal tracking by older adults. Psychol Aging. 1995;10:8–19. doi: 10.1037//0882-7974.10.1.8. [DOI] [PubMed] [Google Scholar]
- James W. Principles of psychology. Holt; New York: 1890. [Google Scholar]
- Johnson-Frey SH, Newman-Norlund R, Grafton ST. A distributed left hemisphere network active during planning of everyday tool use skills. Cereb Cortex. 2005;15:681–695. doi: 10.1093/cercor/bhh169. [DOI] [PMC free article] [PubMed] [Google Scholar]
- Karni A, Meyer G, Rey-Hipolito C, Jezzard P, Adams MM, Turner R, Ungerleider LG. The acquisition of skilled motor performance: fast and slow experience- driven changes in primary motor cortex. Proc Natl Acad Sci U S A. 1998;95:861–868. doi: 10.1073/pnas.95.3.861. [DOI] [PMC free article] [PubMed] [Google Scholar]
- Krakauer JW, Ghilardi MF, Mentis M, Barnes A, Veytsman M, Eidelberg D, Ghez C. Differential cortical and subcortical activations in learning rotations and gains for reaching: a PET study. J Neurophysiol. 2004;91:924–933. doi: 10.1152/jn.00675.2003. [DOI] [PubMed] [Google Scholar]
- Lehericy S, Benali H, Van de Moortele PF, Pelegrini-Issac M, Waechter T, Ugurbil K, Doyon J. Distinct basal ganglia territories are engaged in early and advanced motor sequence learning. Proc Natl Acad Sci U S A. 2005;102:12566–12571. doi: 10.1073/pnas.0502762102. [DOI] [PMC free article] [PubMed] [Google Scholar]
- Matsuzaka Y, Picard N, Strick PL. Skill representation in the primary motor cortex after long-term practice. J Neurophysiol. 2007;97:1819–1832. doi: 10.1152/jn.00784.2006. [DOI] [PubMed] [Google Scholar]
- McLachlan GJ, Krishnan T. The EM Algorithm and Extensions. Wiley; New York: 1997. [Google Scholar]
- Miall RC, Imamizu H, Miyauchi S. Activation of the cerebellum in co-ordinated eye and hand tracking movements: an fMRI study. Exp Brain Res. 2000;135:22–33. doi: 10.1007/s002210000491. [DOI] [PubMed] [Google Scholar]
- Miall RC, Jenkinson EW. Functional imaging of changes in cerebellar activity related to learning during a novel eye-hand tracking task. Exp Brain Res. 2005;166:170–183. doi: 10.1007/s00221-005-2351-5. [DOI] [PubMed] [Google Scholar]
- Miall RC, Reckess GZ, Imamizu H. The cerebellum coordinates eye and hand tracking movements. Nat Neurosci. 2001;4:638–644. doi: 10.1038/88465. [DOI] [PubMed] [Google Scholar]
- Mitz AR, Godschalk M, Wise SP. Learning-dependent neuronal activity in the premotor cortex. Activity during the acquisition of conditional motor associations. J Neurosci. 1991;11:1155–1172. doi: 10.1523/JNEUROSCI.11-06-01855.1991. [DOI] [PMC free article] [PubMed] [Google Scholar]
- Oldfield RC. The assessment and analysis of handedness: the Edinburgh inventory. Neuropsychologia. 1971;9:97–113. doi: 10.1016/0028-3932(71)90067-4. [DOI] [PubMed] [Google Scholar]
- Picard N, Strick PL. Motor areas of the medial wall: a review of their location and functional activation. Cereb Cortex. 1996;6:342–353. doi: 10.1093/cercor/6.3.342. [DOI] [PubMed] [Google Scholar]
- Ramnani N, Toni I, Josephs O, Ashburner J, Passingham RE. Learning- and expectation-related changes in the human brain during motor learning. J Neurophysiol. 2000;84:3026–3035. doi: 10.1152/jn.2000.84.6.3026. [DOI] [PubMed] [Google Scholar]
- Rizzolatti G, Craighero L. The mirror-neuron system. Annu Rev Neurosci. 2004;27:169–192. doi: 10.1146/annurev.neuro.27.070203.144230. [DOI] [PubMed] [Google Scholar]
- Rozzi S, Calzavara R, Belmalih A, Borra E, Gregoriou GG, Matelli M, Luppino G. Cortical Connections of the Inferior Parietal Cortical Convexity of the Macaque Monkey. Cereb Cortex. 2005 doi: 10.1093/cercor/bhj076. [DOI] [PubMed] [Google Scholar]
- Rushworth MF, Hadland KA, Gaffan D, Passingham RE. The effect of cingulate cortex lesions on task switching and working memory. J Cogn Neurosci. 2003;15:338–353. doi: 10.1162/089892903321593072. [DOI] [PubMed] [Google Scholar]
- Rushworth MF, Kennerley SW, Walton ME. Cognitive neuroscience: resolving conflict in and over the medial frontal cortex. Curr Biol. 2005;15:R54–56. doi: 10.1016/j.cub.2004.12.054. [DOI] [PubMed] [Google Scholar]
- Rushworth MF, Nixon PD, Wade DT, Renowden S, Passingham RE. The left hemisphere and the selection of learned actions. Neuropsychologia. 1998;36:11–24. doi: 10.1016/s0028-3932(97)00101-2. [DOI] [PubMed] [Google Scholar]
- Rushworth MF, Walton ME, Kennerley SW, Bannerman DM. Action sets and decisions in the medial frontal cortex. Trends Cogn Sci. 2004;8:410–417. doi: 10.1016/j.tics.2004.07.009. [DOI] [PubMed] [Google Scholar]
- Russo GS, Backus DA, Ye S, Crutcher MD. Neural activity in monkey dorsal and ventral cingulate motor areas: comparison with the supplementary motor area. J Neurophysiol. 2002;88:2612–2629. doi: 10.1152/jn.00306.2002. [DOI] [PubMed] [Google Scholar]
- Schmahmann JD, Doyon J, McDonald D, Holmes C, Lavoie K, Hurwitz AS, Kabani N, Toga A, Evans A, Petrides M. Three-dimensional MRI atlas of the human cerebellum in proportional stereotaxic space. Neuroimage. 1999;10:233–260. doi: 10.1006/nimg.1999.0459. [DOI] [PubMed] [Google Scholar]
- Schmidt RA. A schema theory of discrete motor skill learning. Psychol Rev. 1975;82:225–260. [Google Scholar]
- Seidler RD, Noll DC, Chintalapati P. Bilateral basal ganglia activation associated with sensorimotor adaptation. Exp Brain Res. 2006;175:544–555. doi: 10.1007/s00221-006-0571-y. [DOI] [PubMed] [Google Scholar]
- Seidler RD, Noll DC, Thiers G. Feedforward and feedback processes in motor control. Neuroimage. 2004;22:1775–1783. doi: 10.1016/j.neuroimage.2004.05.003. [DOI] [PubMed] [Google Scholar]
- Seidler RD, Purushotham A, Kim SG, Ugurbil K, Willingham D, Ashe J. Cerebellum activation associated with performance change but not motor learning. Science. 2002;296:2043–2046. doi: 10.1126/science.1068524. [DOI] [PubMed] [Google Scholar]
- Shadmehr R, Holcomb HH. Neural correlates of motor memory consolidation. Science. 1997;277:821–825. doi: 10.1126/science.277.5327.821. [DOI] [PubMed] [Google Scholar]
- Shen L, Alexander GE. Preferential representation of instructed target location versus limb trajectory in dorsal premotor area. J Neurophysiol. 1997;77:1195–1212. doi: 10.1152/jn.1997.77.3.1195. [DOI] [PubMed] [Google Scholar]
- Smith AC, Frank LM, Wirth S, Yanike M, Hu D, Kubota Y, Graybiel AM, Suzuki WA, Brown EN. Dynamic analysis of learning in behavioral experiments. J Neurosci. 2004;24:447–461. doi: 10.1523/JNEUROSCI.2908-03.2004. [DOI] [PMC free article] [PubMed] [Google Scholar]
- Smith AC, Stefani MR, Moghaddam B, Brown EN. Analysis and design of behavioral experiments to characterize population learning. J Neurophysiol. 2005;93:1776–1792. doi: 10.1152/jn.00765.2004. [DOI] [PubMed] [Google Scholar]
- Smith MA, Ghazizadeh A, Shadmehr R. Interacting adaptive processes with different timescales underlie short-term motor learning. PLoS Biol. 2006;4:e179. doi: 10.1371/journal.pbio.0040179. [DOI] [PMC free article] [PubMed] [Google Scholar]
- Smith MA, Shadmehr R. Intact ability to learn internal models of arm dynamics in Huntington’s disease but not cerebellar degeneration. J Neurophysiol. 2005;93:2809–2821. doi: 10.1152/jn.00943.2004. [DOI] [PubMed] [Google Scholar]
- Suminski AJ, Rao SM, Mosier KM, Scheidt RA. Neural and electromyographic correlates of wrist posture control. J Neurophysiol. 2007;97:1527–1545. doi: 10.1152/jn.01160.2006. [DOI] [PubMed] [Google Scholar]
- Thoroughman KA, Shadmehr R. Electromyographic correlates of learning an internal model of reaching movements. J Neurosci. 1999;19:8573–8588. doi: 10.1523/JNEUROSCI.19-19-08573.1999. [DOI] [PMC free article] [PubMed] [Google Scholar]
- Thoroughman KA, Shadmehr R. Learning of action through adaptive combination of motor primitives. Nature. 2000;407:742–747. doi: 10.1038/35037588. [DOI] [PMC free article] [PubMed] [Google Scholar]
- Todorov E. Optimality principles in sensorimotor control. Nat Neurosci. 2004;7:907–915. doi: 10.1038/nn1309. [DOI] [PMC free article] [PubMed] [Google Scholar]
- Todorov E. Stochastic optimal control and estimation methods adapted to the noise characteristics of the sensorimotor system. Neural Comput. 2005;17:1084–1108. doi: 10.1162/0899766053491887. [DOI] [PMC free article] [PubMed] [Google Scholar]
- Tunik E, Schmitt P, Grafton ST. BOLD coherence reveals segregated functional neural interactions when adapting to distinct torque perturbations. J Neurophysiol. 2007 doi: 10.1152/jn.00405.2006. [DOI] [PMC free article] [PubMed] [Google Scholar]
- Turner RS, Desmurget M, Grethe J, Crutcher MD, Grafton ST. Motor subcircuits mediating the control of movement extent and speed. J Neurophysiol. 2003;90:3958–3966. doi: 10.1152/jn.00323.2003. [DOI] [PubMed] [Google Scholar]
- Turner RS, Grafton ST, Votaw JR, Delong MR, Hoffman JM. Motor subcircuits mediating the control of movement velocity: a PET study. J Neurophysiol. 1998;80:2162–2176. doi: 10.1152/jn.1998.80.4.2162. [DOI] [PubMed] [Google Scholar]
- van Mier H, Tempel LW, Perlmutter JS, Raichle ME, Petersen SE. Changes in brain activity during motor learning measured with PET: effects of hand of performance and practice. J Neurophysiol. 1998;80:2177–2199. doi: 10.1152/jn.1998.80.4.2177. [DOI] [PubMed] [Google Scholar]
- Wise SP, Murray EA. Arbitrary associations between antecedents and actions. Trends Neurosci. 2000;23:271–276. doi: 10.1016/s0166-2236(00)01570-8. [DOI] [PubMed] [Google Scholar]
- Woolrich MW, Behrens TE, Beckmann CF, Jenkinson M, Smith SM. Multilevel linear modelling for FMRI group analysis using Bayesian inference. Neuroimage. 2004;21:1732–1747. doi: 10.1016/j.neuroimage.2003.12.023. [DOI] [PubMed] [Google Scholar]
- Woolrich MW, Ripley BD, Brady M, Smith SM. Temporal Autocorrelation in Univariate Linear Modeling of FMRI Data. Neuroimage. 2001;14:1370–1386. doi: 10.1006/nimg.2001.0931. [DOI] [PubMed] [Google Scholar]
- Worsley KJ, Evans AC, Marrett S, Neelin P. A three-dimensional statistical analysis for CBF activation studies in human brain. J Cereb Blood Flow Metab. 1992;12:900–918. doi: 10.1038/jcbfm.1992.127. [DOI] [PubMed] [Google Scholar]
- Yamamoto K, Hoffman DS, Strick PL. Rapid and long-lasting plasticity of input-output mapping. J Neurophysiol. 2006;96:2797–2801. doi: 10.1152/jn.00209.2006. [DOI] [PubMed] [Google Scholar]