

Abstract
This study was aimed at investigating regional and local variability of brain tissue during normal human brain development.
We investigated high-resolution MR-imaging data using SPM99 (Wellcome Department, University College London, UK). A pixel-wise variation coefficient of gray and white matter was calculated to visualize local variability.
Data from 200 normal children (5–18 years) was analyzed. We found a profound interaction between variability of brain structures and normal development in both gray and white matter.
Variability in gray and white matter shows regionally specific, age-related variations, possibly offering a new tool for the assessment of subtle brain abnormalities. Our results emphasize the necessity to take this variability into account when planning pediatric neuroimaging studies.
Keywords: brain development, variability, gray matter, power analysis
Introduction
Neuroimaging studies frequently aim to detect differences between populations by measuring the size or the volume of distinct brain structures, applying semi-automated [1] or manual methods [2]. However, in order to determine what group size is needed in order to reliably find small differences between groups by means of a power analysis, it is necessary to know and consider the normal variability that occurs in a healthy control population [3].
Intersubject variability has been shown to be considerable in a number of studies on specific areas of interest, like the visual [4] or the cortical motor system [5]. Voxel-based approaches have been utilized before, e.g. in a study comparing the human and primate forebrain [6]. The question is even more relevant in the face of the substantial changes the human brain undergoes during normal development, both on a global [7, 8] and a regional scale [9, 10, 11]. These changes in volume, complexity, and shape make it even more difficult to investigate this normal range of brain morphology in children, leaving many questions unanswered. For example, there is still no consent regarding the normal asymmetry of the size of the basal ganglia [2, 12], which may in part be due to the strong volume changes these structures undergo in childhood [10].
In this study, we wanted to address the question in how far local variability changes not only as a function of underlying developmental processes in tissue volume, but rather independent of such changes. We aimed at addressing this question in a large population of healthy, normal children, utilizing a voxel-based whole brain approach for both gray and white matter.
Materials and Methods
Subjects
Healthy children were recruited as part of an ongoing study on normal language development [13]. Institutional review board approval and informed consent were obtained for all subjects. Exclusion criteria were as follows: history of previous neurological illness, head trauma with loss of consciousness, current or past psychostimulant medication, learning disability, IQ less than 80 (measured by the age-appropriate Wechsler Intelligence scale), birth at 37 weeks or less of gestational age, pregnancy, abnormal findings on clinical neurological examination, and clinical or technical contraindications to an MRI-examination (including orthodontic braces). All scans were read for structural abnormalities.
Overall, imaging data from 276 children was analyzed. Data from 76 children was rejected due to insufficient quality, technical failure, or pathological findings, leaving data from 200 children (102 girls [51%], 98 boys [49%]). Average age was 137.1 ± 43.1 months (11.4 ± 3.6 years), median = 132.6 months (11.05 years), range 60–226.5 months (5–18.87 years) at the date of the MR-exam. The age and gender breakdown of this sample is given in Table I. Ethnic background was mainly Caucasian (178 [89%]), followed by African American (12 [6%]), Asian (4 [2%]), Multi-Ethnic (3 [1,5%]), Hispanic (2 [1%]), and Native American (1 [0,5%]). 180 subjects (90%) were right-handed, while 20 subjects (10%) were left-handed.
Table I.
Subject age- and gender breakdown (n = 200).
| 5 – 6 | 7 – 8 | 9 – 10 | 11 – 12 | 13 – 14 | 15 – 16 | 17 – 18 | Total | |
|---|---|---|---|---|---|---|---|---|
| f | 8 | 19 | 22 | 14 | 15 | 13 | 11 | 102 |
| m | 13 | 18 | 19 | 21 | 13 | 6 | 8 | 98 |
In order to assess age effects scans were divided into three sub-groups as done before [14], yielding a “young” (67 subjects, mean age 90.7 ± 15 months), a “medium” (67 subjects, mean age 133.2 ± 11.4 months), and an “old” subgroup (66 subjects, mean age 188.1 ± 21 months). For the purpose of this study, only the young and the old group were compared with each other.
Children were imaged with a Bruker Biospec 30/60 3 Tesla MRI scanner equipped with a head gradient insert (Bruker SK330). A T1-weighted Modified Driven-Equilibrium Fourier Transform (MDEFT [15]) image of the whole brain was acquired (TR = 15 ms, TE = 4.3 ms, τ-time = 550 ms, flip angle = 20°, FOV = 19.2 × 25.6 × 14.4 cm, matrix = 128 × 256 × 96, resolution = 1.5 × 1 × 1.5 mm).
Data processing
Image processing was done using statistical parametrical mapping software, SPM99 (Wellcome Department, University College London, UK [16]) running in MATLAB (MathWorks, Natick, MA). As the single manual step in image preparation and analysis, determination of the anterior commissure was performed by a single investigator for all images. During this procedure, images were also carefully aligned along the main axes to correct for grossly different head positions in the scanner, and rated (regarding the presence of arterial blood flow-artifacts and motion artifacts) as described before [17]. Low-quality images were excluded from further analysis. The remaining high-quality images were reoriented in the axial plane and resliced to 1 × 1 × 1 mm isotropic voxels (sinc-interpolation, 9 × 9 × 9 neighbors). This reduces partial volume effects in further processing by ensuring an optimal fit to the axially oriented templates used in SPM99.
All images were automatically transformed into stereotaxic space by a 12-parameter affine-only, linear transformation in order to avoid regional distortion of the images. This was followed by their segmentation into three separate tissue classes, representing gray matter (GM), white matter (WM), and cerebrospinal fluid (CSF). SPM99 employs a combined a priori-knowledge/pixel intensity approach, resulting in tissue probability maps [1]. By modeling smoothly varying intensity changes, residual image inhomogeneities were compensated for [18], which has been shown to increase the segmentation’s reliability [19]. Non-brain tissue was removed as recently suggested [20].
The resulting images were averaged in each age group and the standard deviation was calculated for each pixel in the brain and represented as an additional image volume, separately for each tissue class (gray and white matter). These were slightly smoothed with a Gaussian filter (full width at half maximum [FWHM] = 3 mm) in order to cluster the data. As regional and global tissue volumes change with age during normal brain development [7, 8, 9, 10], these changes need to be taken into account in order to show true changes in local variability independent of simple volumetric differences. Therefore, the standard deviation of each image was related to the corresponding averaged tissue probability map, yielding a pixel-wise variation coefficient independent of the local tissue concentration. The “old” and the “young” group were compared, and only differences in this coefficient exceeding 20% were considered. An additional extent threshold of 50 contiguous voxels was employed in order to further suppress small clusters of false positive voxels.
Results
Changes in gray matter variability with age
Gray matter (Fig. 1, left) showed a number of areas with higher variability in the older children (blue). These included the anterior and posterior cingulate, the basal ganglia (especially the medial putamen and the globus pallidus) and symmetrical high-parietal regions, adjacent to the central white matter. Higher variability in younger children could only be found in small patches in the insular and basal cortex (red).
Figure 1.
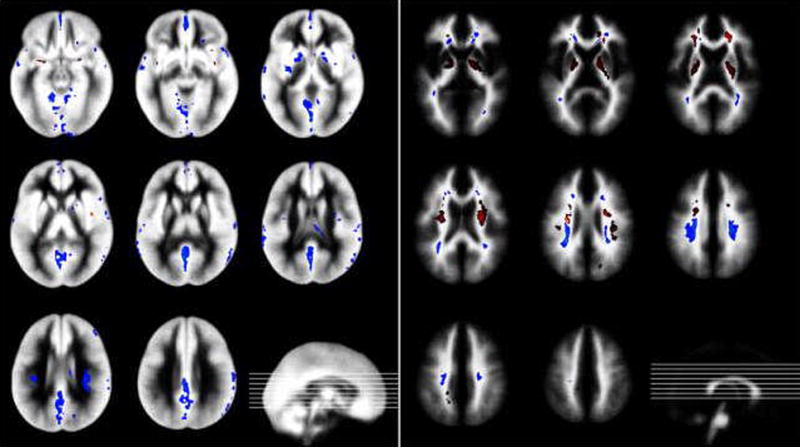
Changes in variability of gray matter (left) and white matter (right) during childhood. Colors denote higher variation coefficients in younger (yellow-red) and older children (blue-green), respectively. Results are overlaid on the averaged probability maps of all children. Inserts: respective location of slices.
Changes in white matter variability with age
In white matter (Fig. 1, right), the long fiber tracts (descending and ascending through the internal capsule) showed the most profound age-related changes, with a substantially higher variability in young children (red). Central medial occipital and high-parietal white matter showed higher variability in older children (blue). In the frontal lobes, areas of both higher and lower variability in older children were found adjacent to each other, especially in medial aspects.
Discussion
Knowing the variability inherent in normal control data is paramount for adequately estimating necessary group sizes by means of statistical procedures [3]. Since the human brain undergoes profound developmental changes on the global as well as the regional level [7, 8, 9, 10, 11], ensuring the use of an appropriate (and appropriately sized) control group seems all the more relevant. In this study, we were able to investigate a large population of truly normal children after applying rigorous exclusion criteria, allowing to consider this reference data representative for the population as a whole [21].
Our data might also be of particular value regarding similar studies in distinct patient populations: for example, how will the variability in this normal sample compare to a sample of children diagnosed with attention-deficit-hyperactivity disorder (ADHD) or other neurobehavioral disorders? Imaging studies in these populations are frequently ambiguous or negative [22], and investigating the variability in a given brain structure might provide very useful clues to the underlying neurobiological deficits.
Before embarking on the discussion of our results, the special methodological approach in this study should be mentioned. By considering the local tissue concentration, our results may not be directly comparably to those of earlier studies [9, 11]. Conceptually, this approach only finds changes in tissue variability that are greater than the corresponding changes in the volume of the underlying tissue compartment. It thus only detects increases or decreases in brain structure variability independent of such volumetric changes and may therefore be more sensitive to individual rather than group effects.
In gray matter, almost all detected changes correspond to higher variability in older children (blue in Fig. 1, left). An explanation for this pattern could be that significant and regionally specific gray matter volume reductions occur in the age range studied here [7, 8], and that therefore regressive rather than progressive events are crucial in shaping the brain of the older child. This selective tissue loss must at least be partly responsible for the more individual morphological pattern emerging in these older children.
Only small clusters show higher variability in younger children, especially in the insula and in basal gray matter bordering the medial cranial fossa (red in Fig. 1, left). It should be mentioned that this could very well be an epiphenomenon of a more variable arterial blood supply in younger children since these clusters all are in close proximity to the middle cerebral artery and its branches and the MR-sequence used shows some vulnerability to blood flow artifacts [15]. In contrast to this, a number of distinct areas show higher variability in older children, specifically including the basal ganglia and both anterior and posterior aspects of the cingulum. Both regions are very interesting from a developmental neuroscience point of view: the basal ganglia, for example, show pronounced volume changes during normal ageing [10]. Our data hints at additional increases in variability, pointing towards a strong influence of individual (re-) modeling processes. This is especially interesting since this brain region has been implicated in the pathophysiology of a number of neuropsychiatric disorders in childhood, especially ADHD and tic-disorders [2, 22]. The cingulate gyrus, especially its anterior aspect, is considered crucial for the interplay and development of higher cognitive and a number of emotional functions [23]. Again, increases in variability could reflect individual adaptive and modeling processes of areas implicated in such functions during a developmentally critical period.
It seems remarkable that only small patches of increased in variability are detected in external cortical areas despite the increases in complexity described in earlier conventional MRI-studies [11]. This could be due to either technical/procedural limitations (see below for further comments) or could reflect the fact that such changes are accompanied by corresponding tissue volume changes and would thus not be detected in this study.
White matter exhibits a more “balanced pattern” in that both age-related increases and decreases in variability could be found in a number of areas (Fig. 1, right). Again, this can be seen to reflect the normal developmental pattern since white matter volume steadily increases with age [8, 14], and in a less regionally specific pattern [7].
Variability is distinctly higher in younger children in the long cortico-spinal tracts (proceeding through the central white matter and the internal capsule). This pattern mirrors earlier findings of age-related changes in diffusion–properties [24], which again replicated earlier structural imaging findings [25]. Pathophysiologically, the necessity for an increased packing and ordering of these long fiber tracts during bodily growth [24] may underlie all of these findings.
Most interestingly, the higher variability in older children in posterior aspects of the central white matter seems to accompany corresponding findings in the gray matter of the posterior cingulum/high parietal areas (exemplified in Fig. 2). It seems that these white matter changes are secondary to the underlying processes in gray matter and thus reflects a secondary remodeling phenomenon. The adjacent, opposite findings in frontal white matter also suggest that a remodeling takes place, possibly reflecting a “frontalization” of cognitive functions in childhood and adolescence [26].
Figure 2.
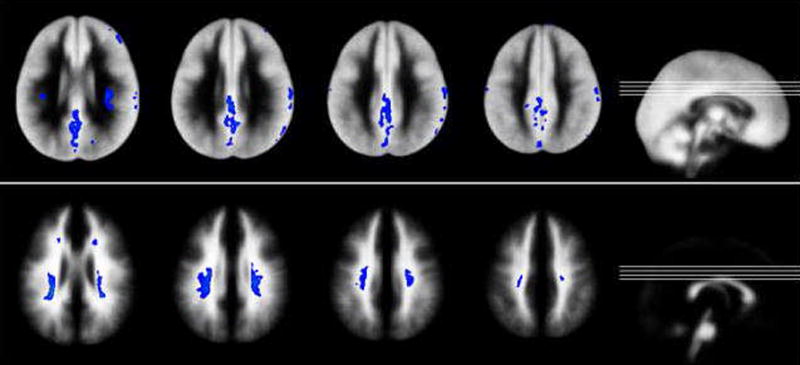
Higher variability in older children: comparison of corresponding changes in gray matter (top) and white matter (bottom). Inserts: location of slices.
Possible limitations of this study
We investigate gray matter density, not gray matter volume as recently suggested [20]. The difference between them is in the reintegration of volume changes during normalization by modulating with the Jacobian determinant. However, we did not employ non-linear normalization schemes (which would have introduced local deformation) and could recently show that, in this age range, the overall linear scaling factor does not correlate with age if based on brain tissue [17]. Therefore, our data can be seen to reflect gray/white matter density as much as volume. As mentioned above, the failure to detect more changes on the outer surface of the cortex might be related to the masking procedure employed to remove non-brain tissue [20]. It is possible that this masking removed some of the more subtle features of the outer cortical appearance (insofar as they were still preserved after the automatic segmentation). However, the alternative would be to risk serious contamination with non-brain tissue that undergoes profound changes in this age group [17]. This was considered even less desirable.
Conclusions
The distinct patterns of high and low variability in the developing brain should be taken into account when estimating the significance of findings in neuroimaging studies in pediatric populations.
This new way to look at imaging data might be useful in further delineating subtle abnormalities in putative developmental disorders like ADHD and others.
The variability inherent in the human brain changes as a function of normal development in a regionally specific way, independent of simple volumetric changes. This might shed a light on underlying developmental processes.
Acknowledgments
This work was funded by a grant from the National Institutes of Child Health and Human Development, RO1-HD38578-01.
We would like to thank Anna M. Weber Byars, Ph.D., and Richard H. Strawsburg, MD, for performing the neuropsychological and neurological examinations, and William S. Ball, Jr., MD, for reading the structural scans. We would also like to thank the anonymous reviewer for very helpful comments. The pediatric data constructed in this study is available for download from our website [www.irc.chmcc.org].
References
- 1.Ashburner J, Friston KJ. Voxel-based morphometry--the methods. Neuroimage. 2000;11:805–821. doi: 10.1006/nimg.2000.0582. [DOI] [PubMed] [Google Scholar]
- 2.Castellanos FX, Castellanos FX, Giedd JN, Eckburg P, Marsh WL, Vaituzis AC, Kaysen D, et al. Quantitative morphology of the caudate nucleus in attention deficit hyperactivity disorder. Am J Psychiatry. 1994;151:1791–1796. doi: 10.1176/ajp.151.12.1791. [DOI] [PubMed] [Google Scholar]
- 3.Campbell MJ, Julious SA, Altman DG. Estimating sample sizes for binary, ordered categorical, and continuous outcomes in two group comparisons. BMJ. 1995;311:1145–1148. doi: 10.1136/bmj.311.7013.1145. [DOI] [PMC free article] [PubMed] [Google Scholar]
- 4.Amunts K, Malikovic A, Mohlberg H, Schormann T, Zilles K. Brodmann’s areas 17 and 18 brought into stereotaxic space-where and how variable? Neuroimage. 2000;11:66–84. doi: 10.1006/nimg.1999.0516. [DOI] [PubMed] [Google Scholar]
- 5.Rademacher J, Burgel U, Geyer S, Schormann T, Schleicher A, Freund HJ, et al. Variability and asymmetry in the human precentral motor system. A cytoarchitectonic and myeloarchitectonic brain mapping study. Brain. 2001;124:2232–2258. doi: 10.1093/brain/124.11.2232. [DOI] [PubMed] [Google Scholar]
- 6.Zilles K, Dabringhaus A, Geyer S, Amunts K, Qu M, Schleicher A, et al. Structural asymmetries in the human forebrain and the forebrain of non-human primates and rats. Neurosci Biobehav Rev. 1996;20:593–605. doi: 10.1016/0149-7634(95)00072-0. [DOI] [PubMed] [Google Scholar]
- 7.Giedd JN, Blumenthal J, Jeffries NO, Castellanos FX, Liu H, Zijdenbos A, et al. Brain development during childhood and adolescence: a longitudinal MRI study. Nat Neurosci. 1999;2:861–863. doi: 10.1038/13158. [DOI] [PubMed] [Google Scholar]
- 8.Courchesne E, Chisum HJ, Townsend J, Cowles A, Covington J, Egaas B, et al. Normal brain development and aging: quantitative analysis at in vivo MR imaging in healthy volunteers. Radiology. 2000;216:672–682. doi: 10.1148/radiology.216.3.r00au37672. [DOI] [PubMed] [Google Scholar]
- 9.Lange N, Giedd JN, Castellanos FX, Vaituzis AC, Rapoport JL. Variability of human brain structure size: ages 4–20 years. Psychiatry Res. 1997;74:1–12. doi: 10.1016/s0925-4927(96)03054-5. [DOI] [PubMed] [Google Scholar]
- 10.Giedd JN, Snell JW, Lange N, Rajapakse JC, Casey BJ, Kozuch PL, et al. Quantitative magnetic resonance imaging of human brain development: ages 4–18. Cereb Cortex. 1996;6:551–560. doi: 10.1093/cercor/6.4.551. [DOI] [PubMed] [Google Scholar]
- 11.Blanton RE, Levitt JG, Thompson PM, Narr KL, Capetillo-Cunliffe L, Nobel A, et al. Mapping cortical asymmetry and complexity patterns in normal children. Psychiatry Res. 2001;107:29–43. doi: 10.1016/s0925-4927(01)00091-9. [DOI] [PubMed] [Google Scholar]
- 12.Mataro M, Garcia-Sanchez C, Junque C, Estevez-Gonzalez A, Pujol J. Magnetic resonance imaging measurement of the caudate nucleus in adolescents with attention-deficit hyperactivity disorder and its relationship with neuropsychological and behavioral measures. Arch Neurol. 1997;54:963–968. doi: 10.1001/archneur.1997.00550200027006. [DOI] [PubMed] [Google Scholar]
- 13.Holland SK, Plante E, Weber Byars A, Strawsburg RH, Schmithorst VJ, Ball WS., Jr Normal fMRI brain activation patterns in children performing a verb generation task. Neuroimage. 2001;14:837–843. doi: 10.1006/nimg.2001.0875. [DOI] [PubMed] [Google Scholar]
- 14.Wilke M, Schmithorst VJ, Holland SK. Normative pediatric brain data for spatial normalization and segmentation differs from standard adult data. Magn Res Med. 2003 doi: 10.1002/mrm.10606. (in press) [DOI] [PubMed] [Google Scholar]
- 15.Ugurbil K, Garwood M, Ellermann J, Hendrich K, Hinke R, Hu X, et al. Imaging at High Magnetic Fields: Initial Experience at 4T. Magn Reson Quart. 1993;9:259–277. [PubMed] [Google Scholar]
- 16.Friston KJ, Holmes AP, Worsley KJ, Poline JP, Frith CD, Frackowiak RSJ. Statistical parametric maps in functional imaging: A general linear approach. Hum Brain Mapp. 1995;2:189–210. [Google Scholar]
- 17.Wilke M, Schmithorst VJ, Holland SK. Assessment of spatial normalization of whole-brain magnetic resonance images in children. Hum Brain Mapp. 2002;17:48–60. doi: 10.1002/hbm.10053. [DOI] [PMC free article] [PubMed] [Google Scholar]
- 18.Ashburner J, Friston K. Multimodal image coregistration and partitioning--a unified framework. Neuroimage. 1997;6:209–217. doi: 10.1006/nimg.1997.0290. [DOI] [PubMed] [Google Scholar]
- 19.Chard DT, Parker GJ, Griffin CM, Thompson AJ, Miller DH. The reproducibility and sensitivity of brain tissue volume measurements derived from an SPM-based segmentation methodology. J Magn Reson Imaging. 2002;15:259–267. doi: 10.1002/jmri.10064. [DOI] [PubMed] [Google Scholar]
- 20.Good CD, Johnsrude I, Ashburner J, Henson RN, Friston KJ, Frackowiak RS. Cerebral asymmetry and the effects of sex and handedness on brain structure: a voxel-based morphometric analysis of 465 normal adult human brains. Neuroimage. 2001;14:685–700. doi: 10.1006/nimg.2001.0857. [DOI] [PubMed] [Google Scholar]
- 21.Rivkin MJ. Developmental neuroimaging of children using magnetic resonance techniques. Ment Retard Dev Disabil Res Rev. 2000;6:68–80. doi: 10.1002/(SICI)1098-2779(2000)6:1<68::AID-MRDD9>3.0.CO;2-9. [DOI] [PubMed] [Google Scholar]
- 22.Frank Y, Pavlakis SG. Brain imaging in neurobehavioral disorders. Pediatr Neurol. 2000;25:278–287. doi: 10.1016/s0887-8994(01)00282-x. [DOI] [PubMed] [Google Scholar]
- 23.Allman JM, Hakeem A, Erwin JM, Nimchinsky E, Hof P. The anterior cingulate cortex. The evolution of an interface between emotion and cognition. Ann N Y Acad Sci. 2001;935:107–117. [PubMed] [Google Scholar]
- 24.Schmithorst VJ, Wilke M, Dardzinski BJ, Holland SK. Correlation of white matter diffusivity and anisotropy with age during childhood and adolescence: a cross-sectional diffusion-tensor MR imaging study. Radiology. 2002;222:212–218. doi: 10.1148/radiol.2221010626. [DOI] [PMC free article] [PubMed] [Google Scholar]
- 25.Paus T, Zijdenbos A, Worsley K, Collins DL, Blumenthal J, Giedd JN, et al. Structural maturation of neural pathways in children and adolescents: in vivo study. Science. 1999;283:1908–1911. doi: 10.1126/science.283.5409.1908. [DOI] [PubMed] [Google Scholar]
- 26.Schlaggar BL, Brown TT, Lugar HM, Visscher KM, Miezin FM, Petersen SE. Functional neuroanatomical differences between adults and school-age children in the processing of single words. Science. 2002;296:1476–1479. doi: 10.1126/science.1069464. [DOI] [PubMed] [Google Scholar]