

Abstract
Novel isosteric analogs of the ceramidase inhibitors (1S, 2R)-N-myristoylamino-phenylpropanol-1 (D-e-MAPP) and (1R, 2R)-N-myristoylamino-4′-nitro-phenylpropandiol-1, 3 (B13) with modified targeting and physicochemical properties were developed and evaluated for their effects on endogenous bioactive sphingolipids: ceramide, sphingosine, and sphingosine 1-phosphate (Cer, Sph, and S1P) in MCF7 cells as determined by high-performance liquid chromatography-mass spectrometry (HPLC-MS/MS). Time- and dose-response studies on the effects of these compounds on Cer species and Sph levels, combined with structure-activity relationship (SAR) data, revealed 4 distinct classes of analogs which were predominantly defined by modifications of the N-acyl-hydrophobic interfaces: N-acyl-analogs (class A), urea-analogs (class B), N-alkyl-analogs (class C), and ω-cationic-N-acyl analogs (class D). Signature patterns recognized for two of the classes correspond to the cellular compartment of action of the new analogs, with class D acting as mitochondriotropic agents and class C compounds acting as lysosomotropic agents. The neutral agents, classes A and B, do not have this compartmental preference. Moreover, we observed a close correlation between the selective increase of C16-, C14- and C18-Cers and inhibitory effects on MCF7 cell growth. The results are discussed in the context of compartmentally targeted regulators of Sph, Cer species, and S1P in cancer cell death, emphasizing the role of C16-Cer. These novel analogs should be useful in cell-based studies as specific regulators of Cer-Sph-S1P inter-metabolism, in vitro enzymatic studies, and for therapeutic development.
Keywords: D-e-MAPP, B13, Ceramidases, Ceramidase inhibitors, Ceramide, Sphingosine, Sphingosine 1-phosphate, Lysosomes, Mitochondria, Cytotoxicity
Introduction
The stimulus-controlled pathways of SPL metabolism provide a rich network of bioactive molecules with pivotal roles in the regulation of diverse cell functions. Of these bioactive SPLs, Cer is known to be a key modulator of cancer cell growth and apoptosis.1 In contrast, the SPL metabolite S1P, which is generated from Cer via ceramidases (CDases) to yield Sph, and then subsequently phosphorylated by sphingosine kinases (SKs), promotes growth and opposes Cer-mediated apoptosis.2, 3 Accumulation of endogenous Cers, and perhaps their metabolites, occurs in response to a variety of external inducers, and can take place in different sub-cellular compartments depending on the inducer and what enzyme of SPL metabolism it regulates.4, 5 Thus, these compartmentally-restricted SPLs may play distinct roles in cellular responses through their actions on varied SPL-specific intra- and extra-cellular targets.6-11
Because of the role of Cer in regulating cell growth and cell death, Cer metabolic and signaling pathways are considered potential targets for anticancer therapy. Many promising approaches have been used to evaluate this concept12, 13 including the application of cell-permeable, short-chain Cers,14-16 liposomal formulations,17, 18 site-specific cationization,19-24 and induction of endogenous Cer by modulation of SPL metabolizing enzymes.20, 25-38
In our investigation of SPL chemistry and the search for new molecules that mimic the action of SPLs and/or regulate their metabolism, we focused on analogs that affect Cer metabolism, attempting to target them to specific sub-cellular compartments.24, 26, 27, 34-37, 39-44
Previously, we synthesized a set of lipophilic phenyl-N-acyl-amino-alcohols (aromatic analogs of Cer) and confirmed that the active analogs increased endogenous Cer and inhibited CDases.26, 27, 34, 36 Experiments in HL60 cells and in in vitro studies showed that the most potent analogs from this group, D-e-MAPP, stereospecifically inhibited alkaline CDase, whereas its enantiomer, L-e-MAPP, served as a substrate for this enzyme.26 Biological activity of D-e-MAPP was later confirmed by several investigators.34, 45-50 Another active analog, B13 (Scheme 1), which differs from D-e-MAPP in stereochemistry and functional groups, inhibited acid CDase, caused the release of cytochrome C, and induced apoptosis.34, 36 Biological activity of B13 was demonstrated in leukemia, malignant melanoma, colon, and prostate cancer cells, and in animal experiments of in vivo cancer growth.34-36 In a previous study, we also showed that isosteric replacement of the amide group of Cer by urea or amine generated inhibitors of neutral CDase, thus illustrating the usefulness of this approach.37 Moreover, in another recent study, we developed the concept of the fixed positive charge-dependent, cellular-targeting Cer, and demonstrated that fixed cationic Cer analogs target preferentially to the mitochondria.19, 21, 23, 24
Scheme 1.
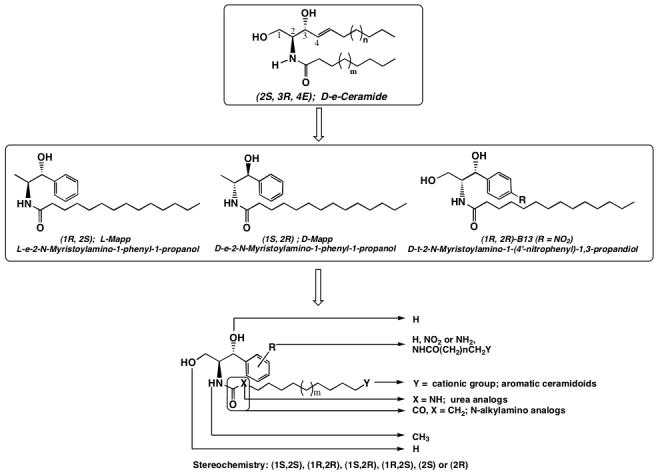
Ceramide, D-e-MAPP and B13 structures and design for aromatic analogs
Extending these findings to the aromatic analogs of Cer, we have synthesized a new group of analogs of D-e-MAPP and B13 with specific structural features, improving and modifying their physiochemical and targeting properties to specific cell compartments (Scheme 1).44 Based on known targeting behavior of alkylamines, we expected that some analogs will locate to lysosomes (e.g. N-alkylamino-analogs, class C).51-54 In contrast, fixed cations are expected to be mitochondriotropic (aromatic ceramidoids, class D).19, 21, 23, 24 Finally, neutral analogs (parent amides, N-methyl-amides, class A, and urea-analogs, class B) may show no compartmental preferences as was shown for exogenous Cers.55, 56
The results with MCF7 cells showed that all the new analogs were equally or more potent than the parent compounds.44 Their activity was predominantly defined by the nature of the modification of the N-acyl-hydrophobic interfaces. The most potent compounds belonged to either class D, the aromatic ceramidoids, or to class C, the aromatic N-alkyl-amino-alcohols. Representative analogs were also evaluated by the National Cancer Institute for a full anticancer screening against a 60-human-tumor-cell assay (NCI’s 60-cell line assay). Again, results showed a class-dependent activity, with classes C and D being the most effective.44
We expected that these new analogs, similar to the parent compounds, would inhibit CDases. Additionally, the action on CDases would have significant effects on the flux between the Cer species, Sph and S1P. Selected analogs are: D-e-MAPP, LCL16, 284, 120, and B13, LCL15, 204, 85 (Figure 1).
Fig. 1.
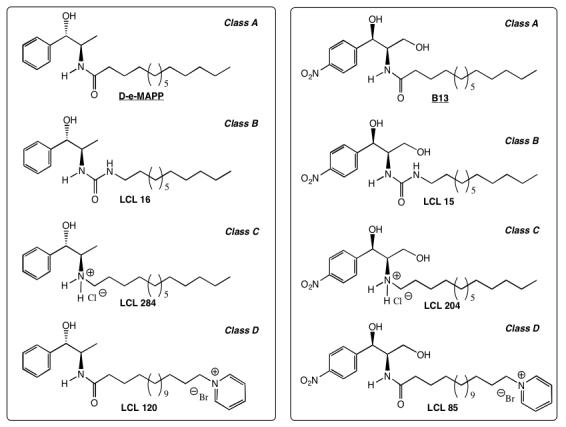
Chemical structures of LCL compounds used in this study
Results from this study clearly distinguish class-dependent effects of these analogs on Cer species, Sph and S1P. However, distinct profiles were observed at low concentrations for D-e-MAPP and B13, previously identified inhibitors of the alkaline and acid CDases. The results are discussed in relation to a proposed compartment-specific action of these compounds.
Results and Discussion
The compounds synthesized for this study represent the second generation of analogs that are based on the N-acyl part modifications of D-e-MAPP and B13 (Scheme 1).44 The selected model compounds generally represent the C14-analogs of the following groups of compounds: class A, D-e-MAPP and B13; class B, urea-analogs LCL16 and LCL15, in which the N-acyl group is replaced by a nonhydrolyzable urea-group; class C, LCL284 and LCL204, N-alkyl-amino-analogs in which the N-acyl-moiety was reduced to an N-alkyl-amino-group; and class D, LCL120 and LCL85, analogs containing a ω-pyridinium salt in the N-acyl-component (shown in Figure 1).
Signature effects of D-e-MAPP and B13 analogs on endogenous Cer and Sph
To study the enhanced cytotoxicity of the novel D-e-MAPP and B13 analogs, we investigated their effects on endogenous SPLs. Concentration-dependent effects at 24 h are shown in Figures 2, 3, 5, and 6. Time-dependent effects for 10 μM treatments are shown in Figures 4 and 7.
Fig. 2.
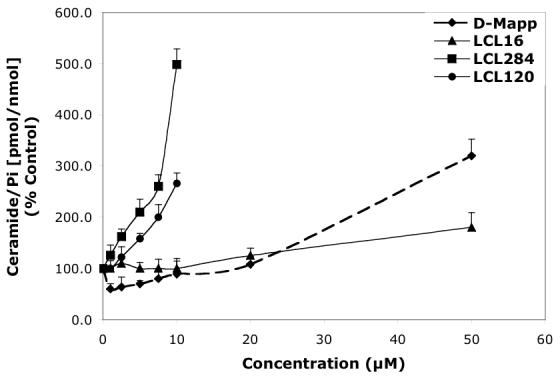
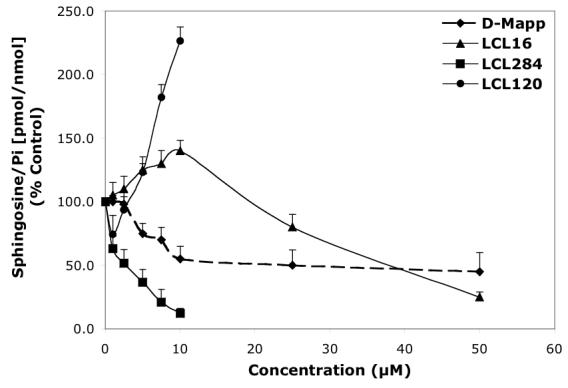
Concentration-dependent effects of the representative D-e-MAPP analogs on endogenous Cer and Sph in MCF7 cells for 24 h treatment. A—Effects of D-e-MAPP, LCL16, 284, and 120 on total Cer. B—Effects of D-e-MAPP, LCL16, 284, and 120 on Sph.
Fig. 3.
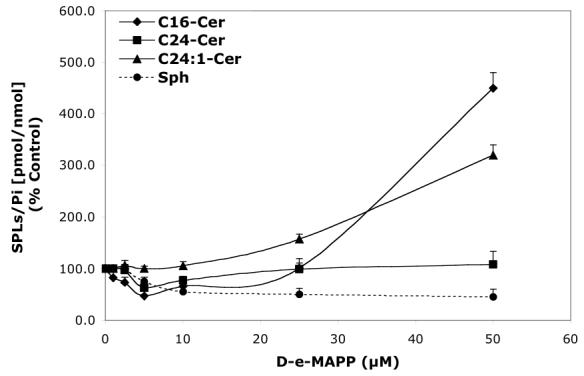
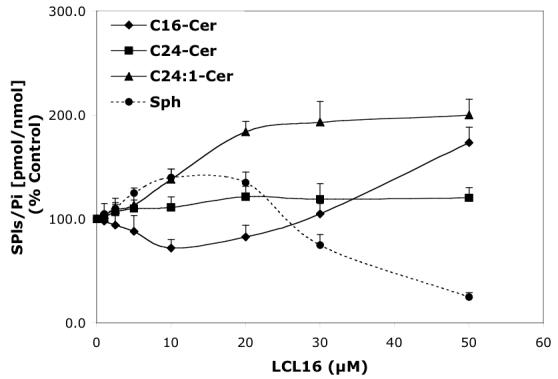
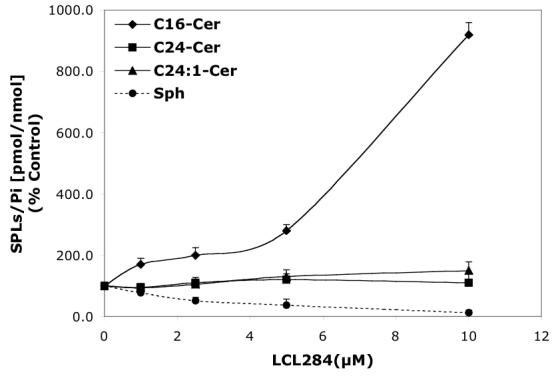
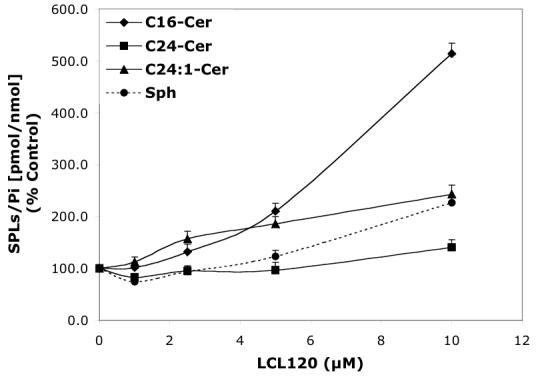
Concentration-dependent regulatory effects of representative D-e-MAPP analogs on balance of endogenous Cer species and Sph for 24 h treatment. A—D-Mapp; B— LCL16; C—LCL284; and D—LCL120.
Fig.5.
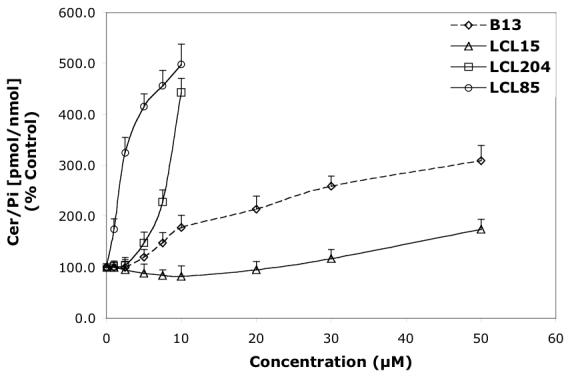
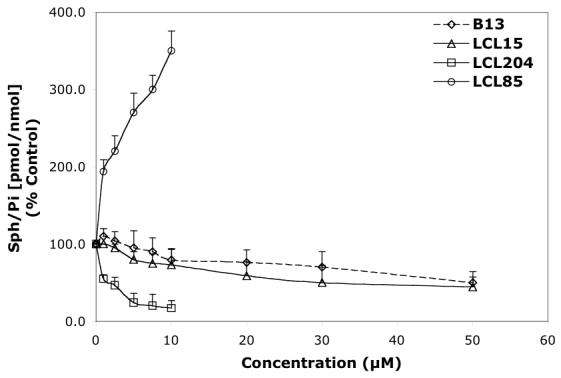
Concentration-dependent effects of the representative B13 analogs on endogenous Cer and Sph in MCF7 cells for 24 h treatment. A—Effect of B13, LCL15, 204, and 85 on total Cer. B—Effect of B13, LCL15, 204, and 85 on Sph.
Fig. 6.
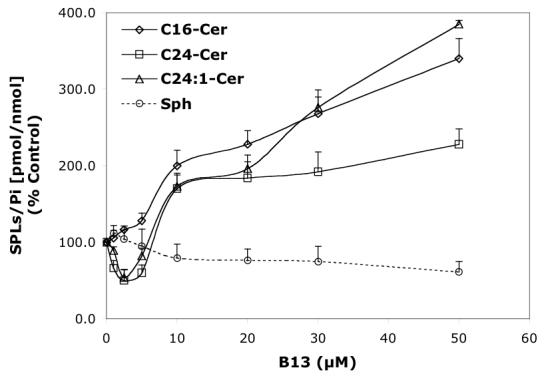
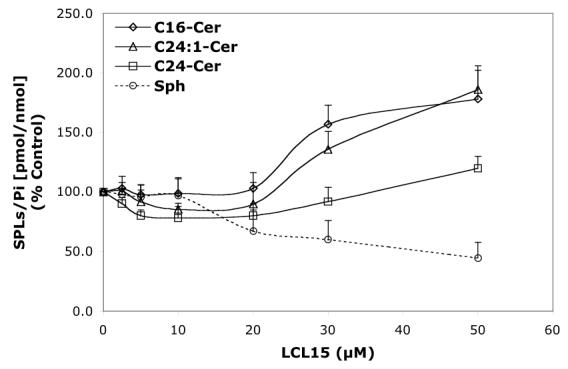
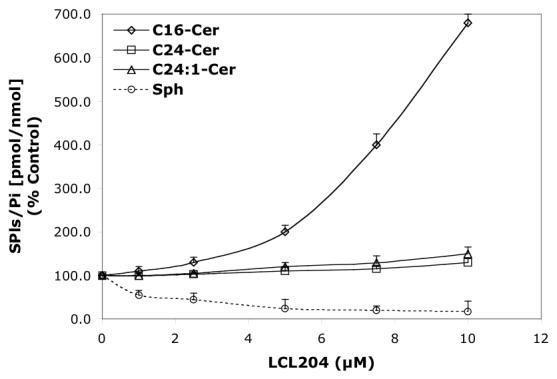
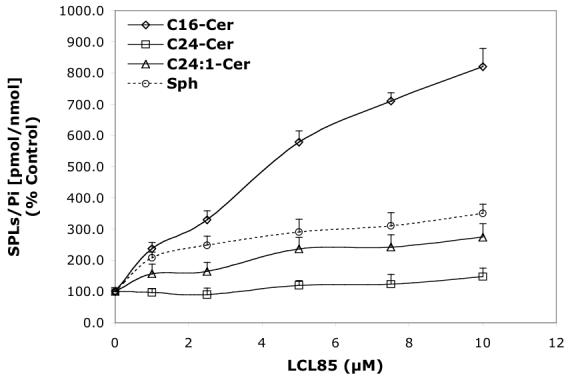
Concentration-dependent regulatory effects of representative B13 analogs on the balance of endogenous Cer species and Sph for 24 h treatment. A—B13; B—LCL15; C—LCL204; and D—LCL85.
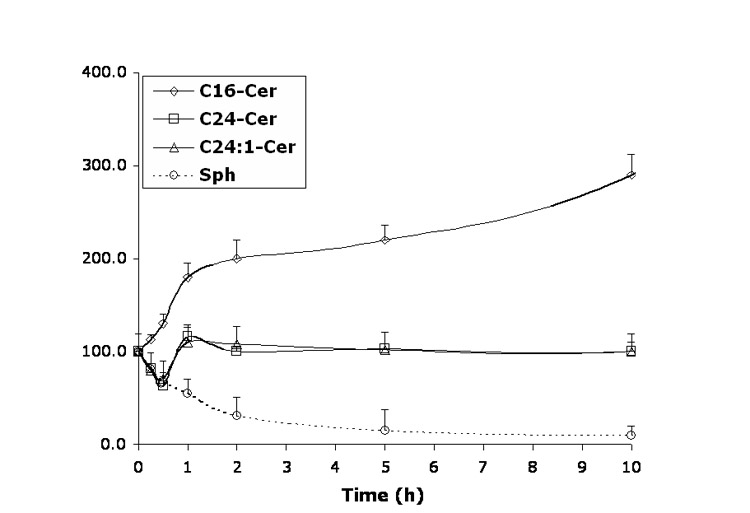
Fig.4.
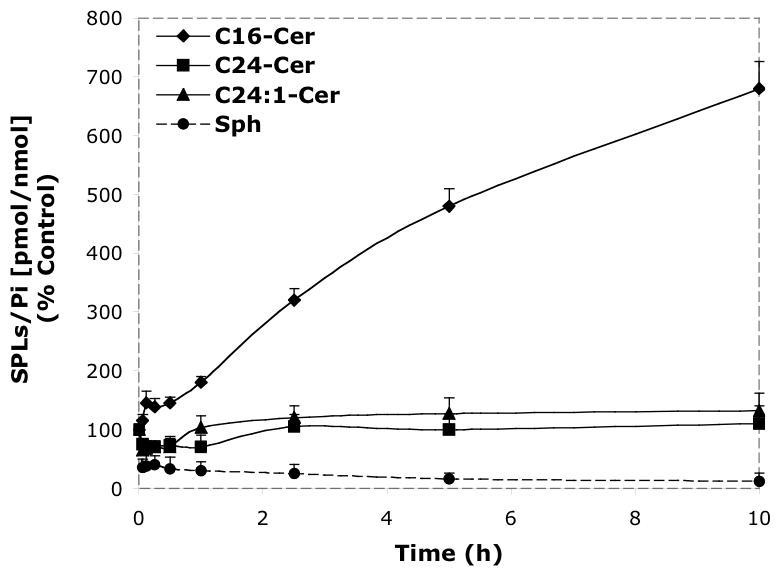
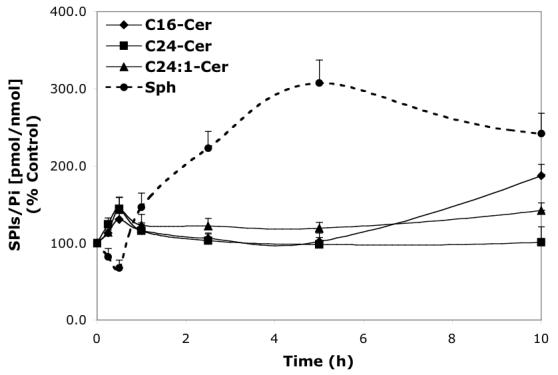
Time-dependent effects of representative D-e-MAPP analogs (10 μM) on balance of endogenous Cer species and Sph. A—D-Mapp; B—LCL16; C—LCL284; D—LCL120.
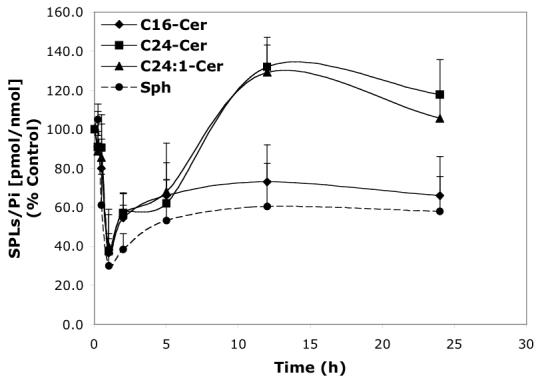
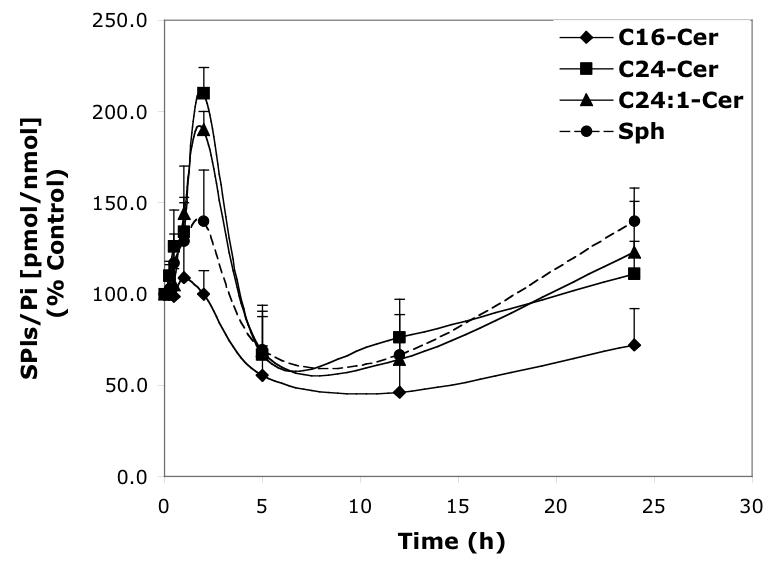
Fig. 7.
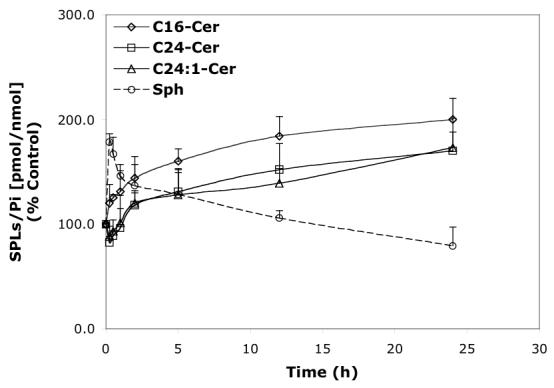
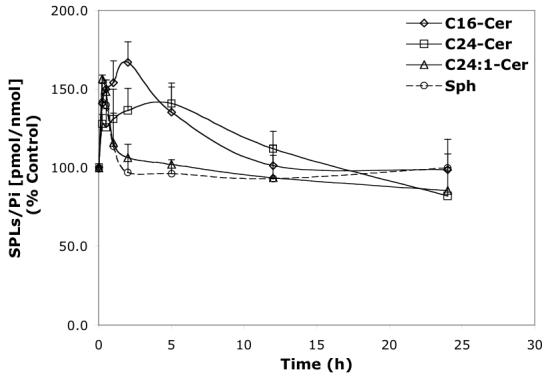
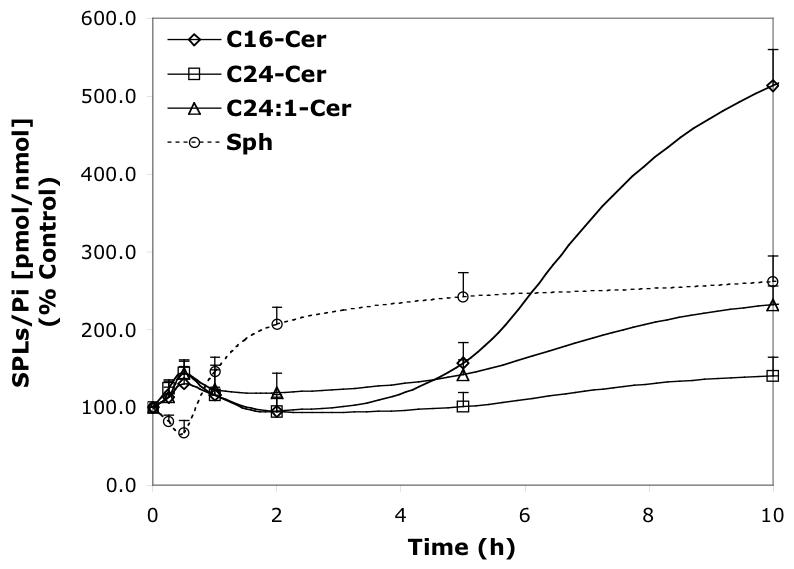
Time-dependent effects of representative B13 analogs (10 μM) on the balance of endogenous Cer species and Sph. A—B13; B—LCL15; C—LCL204; and D—LCL85.
The major (∼94%) Cer components (Cn-Cers) of the MCF7 control cells are: C24:1-, C24- and C16-Cers and changes in these Cers are shown in Figures 3, 4, 6, and 7. The minor Cn-Cers are C14-C18- and C20-Cers. After treatment with the selected analogs, these Cn-Cers followed the same pattern as that of C16-Cer.
• Effects of D-e-MAPP analogs
Concentration-dependent effects on Cer and Sph
D-e-MAPP analogs had significantly varied effects on endogenous Cer and Sph (Figures 2A, 2B respectively), as determined for 24 h treatment. The most effective analog was LCL284, which elevated Cer and decreased Sph in a concentration-dependent manner. The increase in Cer (180%) and decrease in Sph (80%) were observed even at 1 μM. D-e-MAPP showed a concentration-dependent biphasic effect on Cers: downregulation for the lower concentrations (1-10 μM D-e-MAPP) and an increase of Cers starting from 25 μM D-e-MAPP (Figure 2A). A decrease in Sph was observed starting from 2.5 μM D-e-MAPP, reaching a plateau at about 10 μM D-e-MAPP (Figure 2B). L-e-MAPP neither affected endogenous Cers nor Sph at concentrations ranging from 10-50 μM (not shown). LCL16 had no effect on Cer up to 10 μM; however, Cer increased 180% at 50 μM treatment (Figure 2A). LCL16 had a biphasic effect on Sph, which increased up to 10 μM and decreased below control levels at higher concentrations of LCL16 (Figure 2B). A similar effect was observed for LCL17, the enantiomer of LCL16 (data not shown). LCL120, the cationic analog from class D, increased Cer ∼260% (10 μM LCL120) in a concentration-dependent manner (Figure 2A). This compound also increased Sph, starting at 5 μM LCL20 and reached 230% for 10 μM LCL120 treatment (Figure 2B). Its enantiomer, LCL420, followed the same pattern, though to a lesser extent (data not shown).
Effects on endogenous Cer species (Cn-Cers) versus Sph
The specific effects of the selected analogs on Cer species are shown in Figures 3A-D and Figures 4A-D.
D-e-MAPP had a concentration-dependent effect on the major Cer components and Sph (24 h, Figure 3A). Decreases in C16-, C24-Cers, and Sph accompanied by a small increase in C24:1-Cer were observed up to 5 μM D-e-MAPP. At a higher concentrations, all Cer species were variously elevated; however, no effect on C24-Cer was observed. Sph was still decreased up to 50 μM D-e-MAPP.
Next, we performed a time-course treatment with 10 μM D-e-MAPP (Figure. 4A) observing an immediate decrease of all Cer species and Sph (30% of control). C24- and C24:1-Cer slowly recovered over time; however, C16-Cer and Sph were below control levels up to 24 h. C14- and C18-Cers followed the pattern of C16-Cer.
LCL16 had concentration-dependent effects on Cer species and Sph (24 h, Figure 3B). Downregulation of C16-Cer and upregulation of C24:1-Cer were observed up to 10 μM of LCL16. An increase in C16-Cer was observed only for the highest concentration tested (50 μM). LCL16 had almost no effect on C24-Cer up to 50 μM. Sph was slightly increased for the lower concentration (up to 140% for 10 μM LCL16) and decreased to 25% in response to 50 μM of LCL16. A similar but weaker pattern was observed for LCL17 (data not shown). Treatment with 10 μM LCL16 over the time course (Figure 4B) had a biphasic effect on endogenous SPLs. At early time points (1-2.5 h), C24-, C24:1-Cers, and Sph rapidly increased and no effect was observed on C16-Cer. Later, all Cers and Sph were decreased below the control levels subsequent to their slow recovery at 24 h. However, C16-Cer was permanently decreased below the control level up to 24 h. C18- and C14-Cers were also decreased, but less than that observed with C16-Cer. After the time course, up to 48 h, C16-Cer recovered to control levels, but Sph decreased to 25% (data not shown).
LCL284 exerted a very strong effect on Cer species and Sph. Concentration-dependent increases of C14-, C16- and C18-Cers were observed, and C24- and C24:1-Cers were virtually unaffected at 24 h of treatment, even for the lowest concentration of LCL284 used (1 μM, Figure 3C). This effect on Cer species was observed almost immediately (5 min) starting with the upregulation of C14-, C16-, and C18-Cers and downregulation of C24- and C24:1-Cers, as shown for 10 μM LCL284 (Figure 4C). Over this time course, the last two Cers slowly recovered to control levels after 2.5 h, reaching a plateau at 24 h. The increase in C14-Cer, the minor component of endogenous Cer, was the most significant. Levels of C14-, C16-, and C18-Cer after treatment with 10 μM LCL284 for 2.5 h were elevated 430%, 330%, and 260%, respectively. LCL289 (enantiomer of LCL284) followed the pattern of LCL284, but was less effective in elevating C14-, C16-, and C18-Cers (data not shown). Both enantiomers exerted inhibitory effects on Sph. As shown in Figure 4C, LCL284 caused an immediate (within 5 min of treatment) and permanent decrease in Sph (to 25% of control). A permanent decrease in Sph was also observed for the lower concentration as shown in Figure 3C.
LCL120 caused a concentration-dependent increase of C14-, C16-, and C24:1-Cers and Sph without affecting C24-Cer as shown for 24 h treatment (Figure 3D). LCL420, the enantiomer of LCL120, caused similar changes in Cers, but to a lesser extent and without affecting Sph (data not shown). Over the time course (Figure 4D), 10 μM LCL120 caused a biphasic effect on endogenous Cer species and Sph. The early increase of all Cer species (140-190%, the highest for C14-Cer) and the decrease in Sph (60%) was observed within 30 min. This was followed by an increase in Sph (300% at 5 h) and a time-dependent formation of C14-, C16-, and C24:1-Cers (310%, 157%, and 142%, respectively for 10 h treatment). C24-Cer recovered to the control level at 1 h and was not further elevated.
• Effects of B13 analogs
Concentration-dependent effects on endogenous Cer and Sph
The observed differences in the induced levels of Cer and Sph (Figure 5A, B, respectively) by B13 analogs followed the pattern of changes recognized previously for D-e-MAPP analogs (Figures 2A, B) and were similarly correlated with their structural modifications.
Cer was efficiently elevated by Class C and D analogs (LCL204 and LCL85, Figure 5A); however, these analogs had different effects on Sph (Figure 5B). LCL85, the mitochondriotropic B13 analog, increased Sph in a concentration-dependent manner. In contrast, LCL204, the lysosomotropic B13 analog, decreased Sph in a concentration-dependent fashion. The other lysosomotropic analogs tested, LCL385, 343, and 18, also decreased Sph and elevated endogenous Cer (data not shown).
B13 elevated Cer starting at 5 μM treatment, and Cer increased ∼300% with 50 μM treatment (Figure 5A). A small decrease in Sph was noticed at 10 μM (75% of control) and Sph was further decreased to ∼50% of control at 50 μM (Figure 5B).
LCL15, urea-B13, was the least potent in elevating Cer, which only increased 170% when treated with 50 μM LCL15 (Figure 5A). At low concentrations of LCL15 (2.5-10 μM), a small decrease in Cer was observed (∼90% control for 10 μM treatment). LCL15 decreased Sph more efficiently than B13, starting at 5 μM treatment (80% of control) and decreasing to 45% of control with 50 μM (Figure 5B).
Effects on endogenous Cer species and Sph
Next, the specific effects of the selected compounds on Cer molecular species (Cn-Cer) were determined (Figures 6A-D and Figures 7A-D).
B13 had a concentration-dependent effect on Cer species (24 h, Figure 6A). A decrease in C24- and C24:1-Cer, and a small increase in C16-Cer were observed at low concentrations, whereas the higher concentrations of B13 increased all Cer species. B13 (50 μM) increased C24:1-, C16-, and C24- Cers to 380%, 340%, and 220%, respectively. The minor components of endogenous Cer, C14- and C18-Cers, were also elevated. B13 (10 μM) induced early changes in endogenous Cer species and Sph (Figure 7A). Small increases in C16 and C14-Cers (up to 120%) and a small decrease in C24- and C24:1-Cers, (to 80%) followed by an increase of all Cer species (C16-Cer was the most greatly effected) were observed. Interestingly, the early upregulation of C16- and C14-Cer and the downregulation of C24- and C24:1-Cer were accompanied by an increase in Sph. Over time, Sph was decreased, returning to control levels (12 h treatment), followed by a further small decrease (∼80% of control) at 24 h. (Figure 7A).
LCL15 stimulated Cer species in a concentration-dependent manner, and inhibited Sph (Figure 6B). C24- and C24: 1-Cers were slightly decreased (to 80%) by LCL15 concentrations up to 20 μM. and C24: 1-Cer increased with LCL15 concentrations beyond 30 μM. C16-Cer was elevated at concentrations of LCL15 starting at 25 μM. Sph decreased when treated with 20 μM LCL15. However, LCL15 (10μM) increased (up to 30 min) all Cn-Cers and Sph (Figure 7B). Over time, C16- and C24-Cers were progressively increased (up to 2.5 h); however, Sph and C24:1-Cer decreased rapidly, reaching control levels at 2.5 h. C16- and C24-Cer were slowly decreased to control level (∼18 h of treatment).
LCL204 caused a concentration-dependent increase of C16-Cer, no changes for C24- and C24:1-Cers, and a decrease in Sph (Figure 6C). C14- and C18-Cers were also effectively elevated, with C14-Cer being increased the most (850% for 10 μM, data not shown). Sph was effectively decreased, even for the lowest concentration of LCL204 tested (1 μM).
In a time course study, treatment with 10 μM LCL204 immediately decreased Sph and C24- and C24:1-Cers and increased C16- and C14-Cers (Figure 7C). Long-chain Cers recovered to control levels at 1 h and stayed relatively unchanged up to 24 h. C16-Cer (and C14-, C18-Cers) gradually increased over the time course. Sph was permanently decreased up to 24 h.
LCL85 induced a concentration-dependent increase of Sph (up to 350%), C16- and C14-Cers (up to ∼800%), C24:1-Cer (270%), and C24-Cer (140%); (24 h, Figure 6D). Next, we investigated the time dependence of these effects on endogenous Sph and Cer species. As shown in Figure 7D, all Cer species were increased and Sph decreased within the first 0.5 h of treatment. With the time progression, Sph recovered quickly and increased over the time course. All Cer species were lowered to control levels after 1 h treatment and were unchanged for the next 4 h. Thereafter, we observed a steady increase in Cer species up to 24 h, with the highest effects seen with C14-Cer (760%, data not shown). However, at the end of the experiment, the level of C16-Cer (820%, Figure 6D) surpassed that of C14-Cer. In comparison, C24:1-Cer increased ∼260%, and C24-Cer increased ∼130% (24 h, Figure 6D).
Elucidation of specific patterns in the Cer species-Sph levels and balance induced by the action of D-e-MAPP and B13 analogs
Analysis of the previously described results revealed several distinctive class-dependent patterns on the cellular levels C16-Cer, C24:1-Cer, and Sph. These patterns are elucidated and discussed below and illustrated in Table 1.
Table 1.
Identification of the specific patterns in the Cer species-Sph level and balance induced by the action of D-e-MAPP and B13 analogs
| Pattern | C16-Cer | C24:1-Cer | C24-Cer | Sph | Class | Compound | LC a) | ET b) |
|---|---|---|---|---|---|---|---|---|
| I | ↑c) | ↑ | ↑ | ↓d) | A, B | D-e-MAPP, B13, LCL15, LCL16 | ||
| I | ↑ | ↑ | ↑ | ↓ | D | LCL85, 120 | x | |
| II | ↑ | ↓ | ↓ | ↓ | C | LCL284, 204 | x | |
| III | ↑ | —e) | — | ↓ | C | LCL284, 204 | ||
| IV | ↑ | ↑ | — | ↑ | D | LCL120, 85 | ||
| V | ↓ | ↑ | — | ↑ | B | LCL15, 16 | x | |
| VI | ↑ | ↑ | ↑ | ↑ | B | LCL15, 16 | x | x |
| VII | ↓ | — | ↓ | ↓ | A | D-e-MAPP | x | |
| VIII | ↓ | ↓ | ↓ | ↓ | A | D-e-MAPP | x | x |
| IX | — | ↓ | ↓ | — | A | B13 | x | |
| X | ↑ | ↓ | ↓ | ↑ | A | B13 | x | x |
LC : low concentration
ET: early treatment
↓ : down regulation
↑ : up regulation
— : no effect.
Pattern I was characterized by the upregulation of C16-, C24: 1-Cers and downregulation of Sph, and this was identified for the neutral compounds: D-e-MAPP, B13, LCL16, and LCL15, when applied at a high concentration (Figures 3A, 6A, 3B, and 6B), and for class D for early treatments (Figures 4D and 7D).
Pattern II was distinguished by the upregulation of C16-Cer and downregulation of C24:1-Cer and Sph. This was a signature pattern for the early effects of treatment with the lysosomotropic class C agents (Figures 4C and 7C). Extended treatments with these analogs followed Pattern III, consistent with the upregulation of C16-Cer, downregulation of Sph, and the absence of an effect on C24:1- and C24-Cers (Figures 3C, 4C, 6C, and 7C).
Pattern IV was characterized by the upregulation of C16- and C24:1-Cers and Sph with no detectable effect on C24-Cer. This pattern was a characteristic of the mitochondriotropic analogs, class D, (Figures 3D, 4D, 6D, and 7D).
It is noteworthy that the neutral analogs applied at low concentrations did not follow the SPL profile described by Pattern I.
Thus, LCL16 induced upregulation of C24:1-Cer and Sph and downregulation of C16-Cer (Figure 3B Pattern V). However, for the short treatment (up to 2.5 h), we observed an increase of long chain Cers and Sph (Figure 4B, Pattern VI) followed by a decrease of all Cer species and Sph below control levels (at 5 h) and then a slow recovery of all but C16-Cer at 24 h (Figure 4B).
D-e-MAPP downregulated C16-Cer, C24-Cer, and Sph and did not change C24:1-Cer (Figure 3A, Pattern VII). However, for the short treatment, all SPLs decreased significantly below the control level (30-40% of control, Figure 4A, Pattern VIII).
B13 decreased C24: 1- and C24-Cers, minimally increased C16-Cer, and did not detectably affect Sph (Figure 6A, Pattern IX), but during the short treatment, an increase of Sph was observed (Figure 7A, Pattern X).
Pattern I may indicate the inhibitory action on a “non-Cer-species (Cn-Cer)-specific” CDase, accounting for non-specific elevation of Cers and downregulation of Sph.
Pattern II, identified above for the lysosomotropic agents, may result from their inhibitory effect on acid CDase, with the enzyme selectively involved in the hydrolysis of C16-Cer. Alternatively, acid CDase may hydrolyze all Cers, but this could be accompanied by the selective resynthesis of C24:1-Cer from the liberated Sph, giving the appearance of a selectivity for C16-Cer.
However, Pattern III, observed after extended treatment with these agents, may indicate a more complete inhibition of acid CDase, i.e., no increase of Sph or C24:1-Cer. Importantly, the rapid and dramatic decrease in Sph was not recovered by the action of other SPL-metabolizing enzymes, indicating that the main source of cellular Sph is via the hydrolytic action of acid CDase. Fast proteolysis of acid CDase occurred in response to LCL204,40, 43 a result that support our earlier observations.
The dual pattern of C24:1-Cer changes observed under Patterns II and III, could also be consistent with inhibitory effects of these agents on acid SMase at the higher concentrations.40
Interestingly, we also observed that LCL204 and LCL284 decreased endogenous S1P. Thus, 10 μM LCL204 caused a rapid (at 0.5 h) and permanent (up to 24 h) decrease of S1P to 15% of control (data not shown).
Pattern IV was observed for the aromatic ceramidoids LCL120 and LCL85, class D. Starting at 1 h treatment, an increase of Sph was followed by increases of all Cers except for the C24-Cer species. This pattern could not be explained by the action on CDases alone. Considering aromatic ceramidoids as mitochondriotropic agents24, their possible enzymatic targets should be located in or around the mitochondria. These results raise the intriguing possibility of the existence of a mitochondrial Cn-Cer-Sph balance, and this balance may be regulated by either CDase/Cer synthase enzymes, or perhaps via some specific transferases: O-acyl-Cers transferases,57, 58 or O-acyl-Sph transferases (1- and 3-O acyl-Sph formed by the theoretical transfer of the N-acyl group of Cer to its primary or secondary hydroxyl groups).59
Because the increase in S1P was observed only after treatment with the aromatic ceramidoids (Figure 8, time treatment between 5-10 h), we suggest that this S1P was generated from the mitochondrial pool of Sph.
Fig. 8.
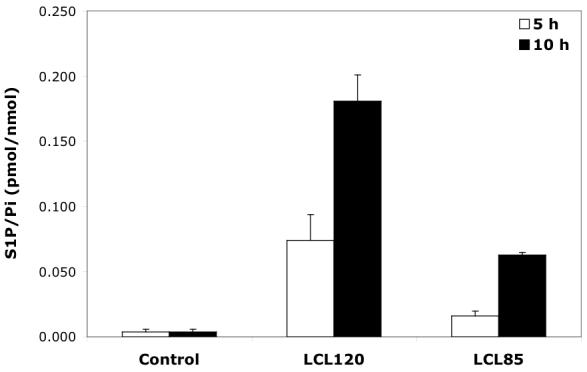
Effect of 10 μM aromatic ceramidoids on S1P formation.
Contrary to this, Pattern I—typical for the inhibition of CDases—was identified for the short treatment with these compounds, suggesting that cationic analogs affected some CDases, possibly on their way to mitochondria.
Patterns V and VI were identified in response to low concentrations of LCL16. Longer treatment with 10 μM LCL16 suggests an increased activity of CDase using C16-Cer as a substrate to form long-chain Cers, especially C24:1-Cer, from the liberated Sph (Pattern V). Supporting this theory, an increase in acid CDase expression after LCL16 was observed with Western blot experiments (Figure 9). Pattern VI identified for the early treatments suggested activation of Cer- and Sph-related transferases. However, LCL16 acted as a typical CDase inhibitor (Pattern I) if applied at a high concentration.
Fig. 9.
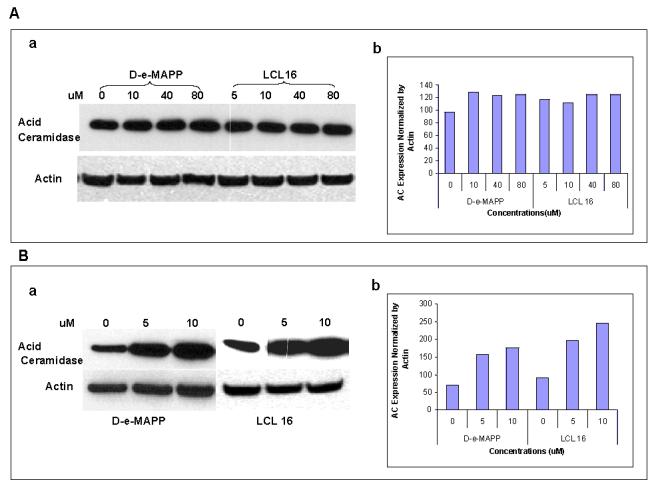
Effect of D-e-MAPP and LCL16 on ACDase. A—5 h treatment; A-a. Western blotting; A-b. Densitometry analysis; B—24 h treatment; B-a. Western blotting; B-b. Densitometry analysis.
Patterns VII and VIII were observed for the low concentration of D-e-Mapp. The decrease in C16-Cer suggested increased activity of CDase using C16-Cer as a substrate (Pattern VII). Increased acid CDase expression after D-e-MAPP was observed with Western blot experiments (Figure 9), suggesting indirect action on this enzyme. However, Pattern VIII observed for its early effects suggested action on targets other than CDase/Cer synthase enzymes (e.g. specific acyl transferases).
Pattern IX, which was observed for the low concentrations of B13, suggested an effect on enzymes utilizing the long-chain Cers, however Pattern X, which was observed during early treatment, suggests an effect on CDase using long chain Cers as substrates to generate Sph and transfer it to C16-Cer.
In summary, all analogs showed regulatory effects on Cer species and Sph, emphasizing their effects on C16-Cer changes. The identified patterns depended on the group classification, concentration used, and time treatments. Changes in Cer species and Sph were related to the effects of these compounds on CDase or Cer-associated transferase enzymes.
Lysosomotropic properties of N-alkylamino- analogs of D-e-MAPP and B13 analogs
Recently published studies with LCL204 in DU145 prostate cancer cells showed that this compound localized to lysosomes resulting in rapid destabilization followed by the specific degradation of the key ceramide metabolizing proteins, acid CDase and acid SMase, by a lysosomal protease.40, 42, 43
Similar experiments performed in MCF7 cells with selected analogs evaluated in this study showed that only analogs from class C—LCL 284 and LCL204—but not analogs from the other classes, caused lysosomal destabilization and degradation of acid CDase as shown for the 10 μM concentration after 5 h treatment (Figure 10).
Fig. 10.
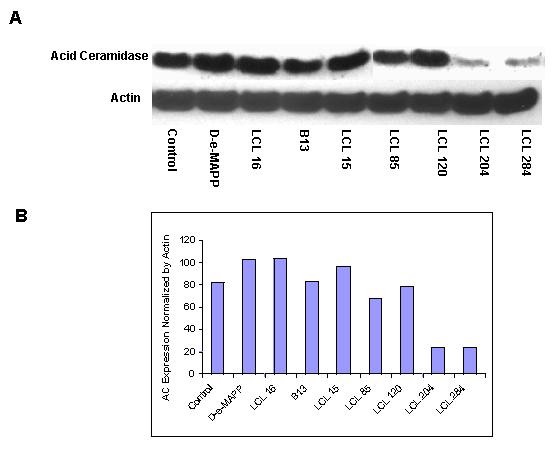
Effects of 10μM selected inhibitors on ACDase after 5h of treatment. A. Western blotting; B. Densitometry analysis.
Endogenous C16-Cer and cell cytotoxicity
SAR studies on cell-growth inhibition (shown for 48 h of treatment)44 correlated well with the increase of C16-Cer caused by the lysosomo- and mitochondriotropic analogs and B13, but not by D-e-MAPP or urea analogs, class B (Figure 11). A linear relationship was found for the B13 family: LCL85, LCL204, B13, and LCL15 with LCL85 increasing C16-Cer to the greatest degree over the IC50 value of this analog (Figure 11B). In contrast, members of the D-e-MAPP family did not show a similar linear relationship for these parameters (Figure 11A). The class B compounds, LCL15 and LCL16, did not increase C16-Cer at the corresponding IC50 values of the analogs. These results suggest that: (i) cell growth inhibition caused by B13 and analogs from Class C and D follows increases of endogenous C16-Cer, (ii) differences between D-e-MAPP and B13 most likely reflect their distinctive effects on SPL metabolism, and (iii) cell-growth inhibition by LCL16 and LCL15 is related to a different mechanism of action than for class C and D analogs because no increase of C16-Cer was observed.
Fig. 11.
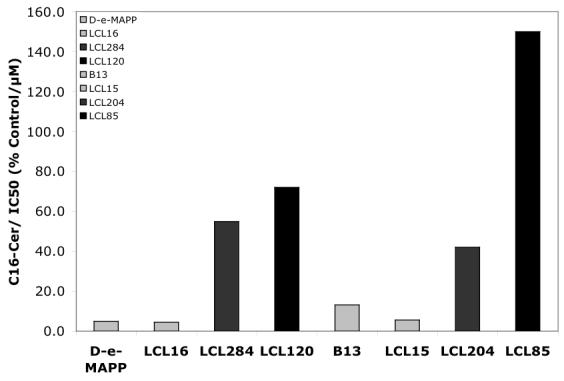
Correlation between the increased endogenous C116- Cer and MCF7 cell-growth inhibition (IC50 values) caused by D-e-MAPP and B13 and their representative analogs.
Analogs C and D were similarly correlated regarding the increase of C14- and C18-Cers (data not shown). However, the long-chain Cers, C24-Cer and C24:1-Cer, were not correlated in this manner. In general, C24-Cer was not elevated by these treatments, and C24:1-Cer was only slightly increased by the mitochondriotropic agents. This is also consistent with studies in MCF-7 cells which demonstrated a role for C24- and C24:1-Cers, generated by neutral SMase, in regulating cell cycle growth but not apoptosis.60
Summary and Conclusions
The compounds developed and examined in this study were grouped into 4 classes (A-D) based on their chemical structures, activity on MCF7 cell growth, and effects on endogenous SPLs: Cer species and Sph. The 4 groups were as follows: class A: N-acyl-analogs (neutral); class B: urea-analogs (neutral); class C: N-alkyl-analogs (lysosomotropic analogs); and class D: ω-cationic analogs (mitochondriotropic analogs). Specific class-dependent effects of the representative analogs (Figure 1) on endogenous Cer and Sph were defined. The neutral analogs were not effective in elevating endogenous Cer; however, they had different effects on endogenous Sph. Mitochondrio- and lysosomotropic analogs were very effective in elevating endogenous Cer, and they exhibited different profiles on endogenous Sph.
Class A
D-e-MAPP and B13, when applied at a high concentration, upregulated C16-, C24:1-Cers and downregulated Sph, indicating an inhibitory action on a “non-Cer-species (Cn-Cer)-specific” CDase. However, at a low concentration D-e-MAPP upregulated C24:1-Cer and downregulated C16-Cer and Sph, suggesting an increased activity of CDase using C16-Cer as a substrate that could also lead to production of C24:1-Cer through selective resynthesis from the liberated Sph. This possibility requires further study.
Class B
LCL16 and LCL15, when applied at a high concentration, upregulated C16-, C24:1-Cers and downregulated Sph, indicating inhibitory action on a “non-Cer-species (Cn-Cer)-specific” CDase. However, at a low concentration, LCL16 upregulated C24:1-Cer and Sph and downregulated C16-Cer, suggesting an increased activity of CDase using C16-Cer as a substrate.
Class C
These analogs caused an immediate and permanent decrease of Sph and a time-dependent effect on Cer species. Short treatment with LCL284 and 204 upregulated C16-Cers and downregulated C24 and C24:1-Cers and Sph, indicating an inhibitory effect on “C16-Cer-specific acid CDase” and suggesting an early participation of acid CDase in a turn-over process, involving selective hydrolysis of C16-Cer and resynthesis C24:1-Cer from the liberated Sph. Extended treatment with these analogs increased C16-Cers and decreased Sph with almost no effect on C24- and C24:1-Cers, suggesting a complete inhibition of this enzyme.
Class D
These analogs caused biphasic effects on Cer species and Sph. For the short treatment, LCL120 and 85 upregulated C16-, C24:1-Cers and downregulated Sph, indicating the inhibition of “non-Cer-species-specific CDase” and suggesting possible effects on some CDases on their way to the target compartments. For the extended treatment (starting from 1 h), these analogs upregulated Sph followed by increases of all Cer species but C24-Cer. This pattern could not be explained by the action on CDases alone, suggesting possible effects on some acyl transferases.
The neutral analogs D-e-MAPP and B13, which have already been established as inhibitors of alkaline and acid CDases, and results with LCL16 suggested that they act as inhibitors of non-Cer-species-specific CDases (decrease Sph and increase all Cer species, except C24-Cer in response to D-e-MAPP) when used at a high concentration. However, distinctive differences were noticed when these inhibitors were used at a lower concentration, suggesting their effects on C16-Cer-specific CDase (or related enzymes). A parallel increase of acid CDase suggests an indirect effect on the synthesis of this protein.
Examining the actions of the lysosomotropic inhibitors, which have been shown to rapidly degrade acid CDase and acid SMase40, we suggest that a biological role of acid CDase is to hydrolyze C16-Cers, and possibly provide Sph for the selective resynthesis of S1P or C24:1-Cer. This analysis suggests that acid CDase may act as a regulator of pro-apoptotic and anti-apoptotic activities in the cancer cells. Inhibition of the hydrolytic activities of this enzyme permanently decreased Sph, eliminating resynthesis of C24:1-Cer and S1P. The sharp drop in Sph was not compensated by the action of other SPL-metabolizing enzymes that could generate Sph. Competition between Cer synthases and SK activities on Sph released from C16-Cer may be the key issue for the formation of S1P or C24:1-Cer. This raises a question about the connections between S1P and C24:1-Cer. An additional question is also raised about the source of C16-Cer, since these analogs also caused degradation of acid SMase.
Parallel experiments performed by our group on DU145 cells overexpressing acid CDase additionally supported the hypothesis proposed here regarding the biological roles of acid CDase.61 Results from these experiments showed a significant decrease of C16-Cer and an increase of C24- and C24:1-Cers.
The independently synthesized AD2646, sharing the structure of LCL204 shown here (the free base of LCL204, Figure 1), acted as a bioactive molecule in HL60 cells, elevating endogenous Cer formed from exogenously added pyrenedodecanoic acid, inhibiting biosynthesis of cellular SM and glycosphingolipids from exogenous fluorescent Cers, and inhibiting human acid CDase in vitro.28, 30, 32 These results indicate multimodal actions of AD2646 on various SPL enzymes. Considering that AD2646 acts as lysosomotropic agents presented here, lysosomal dysfunction in HL60 cells is also predicted in response to this agent.
Regarding analogs from class D, the mitochondrial agents, we suggest the existence of a mitochondrial (or mitochondrial-associated) metabolic pathway that regulates interconversion of Cer and Sph, and consequently affects the levels and balance of these two bioactive SPLs. This metabolic pathway may involve a CDase/Cer synthase set of enzymes, and/or could perhaps involve the action of specific O-acyl-transferases as suggested in the Part 144 based on the activity profile of LCL120 and 420. These O-acyl transferases, some of which have been described57, 58, may release C16-Cer and Sph from their O-acylated forms—O-acyl-C16-Cer and O-acyl-Sph. Because increased S1P was observed only after treatment with the aromatic ceramidoids, we suggest that this S1P may be generated from a mitochondrial pool of Sph. The observed increase of S1P also suggested the action of a mitochondrial or mitochondrially associated SK.
SAR on cell growth inhibition and effects on endogenous Cer species showed a significant and intimate correlation between the cytotoxic effects observed at 48 h of treatment with the active analogs and the increase of C16-Cer observed up to 24 h of treatment. Aromatic ceramidoids represented the most potent analogs which increased C16-Cer and Sph. The combined action of these two lipids could account for the increased apoptotic effects of the ceramidoids.
Experimental
D-e-MAPP and B13 analogs
Compounds used for this study were prepared as presented in the first part of this series, Novel Analogs of D-e-MAPP and B13. Part1. Synthesis and Evaluation as Potential Anticancer Agents 44 where a detailed synthetic procedures and compound characterization are listed under Chemistry (Experimental section).
Cell Culture
MCF7 cells (breast adenocarcinoma, pleural effusion) were purchased from American type Culture Collection (ATCC, Rockville, MD, USA) and grown in RPMI 1640 media (Life Technologies, Inc) supplemented with 10% fetal calf serum (FCS, Summit Biotechnology, CO, USA) and maintained under standard incubator conditions (humidified atmosphere 95% air, 5% CO2, 37 °C).
Cell Experiments
Cells were seeded at a density of ∼50%, corresponding to 1 × 10⁶ cells, in 10 ml of 10 % fetal calf serum (FCS) and after 24h incubation, cells were treated with LCL compounds dissolved in ethanol, keeping ethanol level at 0.1%. Control cells were prepared under identical condition and treated with the same amount of ethanol.
HPLC-MS/MS analysis of endogenous Cers and Sph
Advanced analyses of Cer species and Sph were performed by the Lipidomics Core at MUSC on a Thermo Finnigan TSQ 7000, triple-stage quadrupole mass spectrometer operating in a Multiple Reaction Monitoring (MRM) positive ionization mode as described.62 Briefly, cells were isolated from the culture media, washed twice with a cold PBS and scraped into PBS. Cell pellets were fortified with the internal standards IS (17C base D-erythro-sphingosine: 17Sph, 17C D-erythro-sphingosine-1-phosphate: 17S1P, D-erythro-N-palmitoyl-13C-D-erythro-sphingosine: 13C16-Cer and N-heptadecanoyl-D-erythro-sphingosine: 18C17-Cer) and extracted into a one-phase solvent system with ethyl acetate/iso-propanol/water (60/30/10 % v/v), ∼ 4 mL from which a 1 mL portion was separated and used for determination of phospholipids levels (Pi was used for data normalization) after reextraction by the method of Bligh and Dyer. The remaining extract was used for analysis of S1P, Sph and Cer species after evaporation under nitrogen and reconstitution in 100 μl of acidified (0.2% formic acid) methanol. Samples were injected on the HP1100/TSQ 7000 LC/MS system and gradient-eluted from the BDS Hypersil C8, 150 × 3.2 mm, 3 μm particle size column, with 1.0 mM methanolic ammonium formate /2 mM aqueous ammonium formate mobile phase system. Peaks corresponding to the target analytes and IS were collected and processed using the Xcalibur software. Quantitative analysis of endogenous SPLs and cellular level of compounds used for cell treatments were based on calibration curves generated by spiking an artificial matrix with known amounts of the target analyte synthetic standards and an equal amount of the IS. The target analyte peak area ratios from the samples were similarly normalized to their respective IS and compared to the calibration curves using a linear regression model. Final results were expressed as the level of the particular SPLs/phospholipids (Pi) and expressed as SPLs/Pi (pmol/nmol). Changes in SPLs were expressed in comparison to the control cells representing treatment with the equal amount of ethanol only.
Acid CDAase by Western blot
Western blots of ACDase expression levels were performed as previously described.40
Fig. 12.
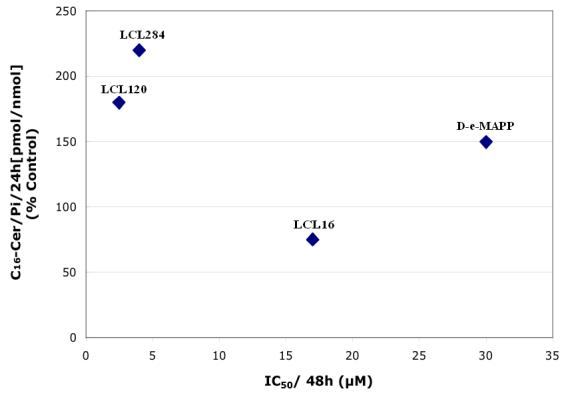
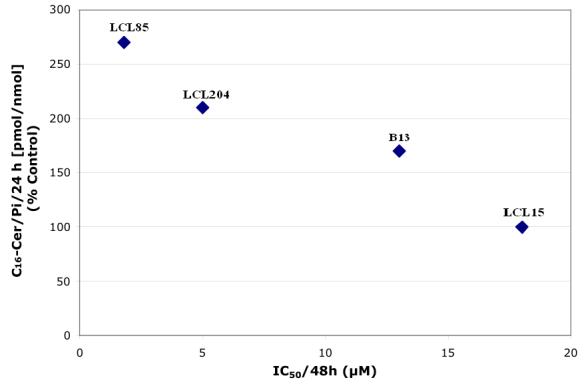
Correlation between increase of endogenous C16-Cer at 24h and inhibition of cell growth at 48h (IC50). A— D-e-MAPP family; B— B13 family.
Acknowledgements
Financial support was provided by the NIH NCI—IPO1CA097132. Special acknowledgement is for NCRR—CO6RR018823 providing laboratory space for Lipidomics Core in CRI building. We thank Dr. Jennifer Schnellmann for editorial assistance.
Footnotes
Publisher's Disclaimer: This is a PDF file of an unedited manuscript that has been accepted for publication. As a service to our customers we are providing this early version of the manuscript. The manuscript will undergo copyediting, typesetting, and review of the resulting proof before it is published in its final citable form. Please note that during the production process errors may be discovered which could affect the content, and all legal disclaimers that apply to the journal pertain.
References
- 1.Pettus BJ, Chalfant CE, Hannun YA. Biochim Biophys Acta. 2002;1585:114. doi: 10.1016/s1388-1981(02)00331-1. [DOI] [PubMed] [Google Scholar]
- 2.Maceyka M, Payne SG, Milstien S, Spiegel S. Biochim Biophys Acta. 2002;1585:193. doi: 10.1016/s1388-1981(02)00341-4. [DOI] [PubMed] [Google Scholar]
- 3.Taha TA, Mullen TD, Obeid LM. Biochim Biophys Acta. 2006;1758:2027. doi: 10.1016/j.bbamem.2006.10.018. [DOI] [PMC free article] [PubMed] [Google Scholar]
- 4.Bionda C, Portoukalian J, Schmitt D, Rodriguez-Lafrasse C, Ardail D. Biochem J. 2004;382:527. doi: 10.1042/BJ20031819. [DOI] [PMC free article] [PubMed] [Google Scholar]
- 5.Futerman AH, Hannun YA. EMBO Rep. 2004;5:777. doi: 10.1038/sj.embor.7400208. [DOI] [PMC free article] [PubMed] [Google Scholar]
- 6.Wickel M, Heinrich M, Weber T, Brunner J, Kronke M, Schutze S. Biochem Soc Trans. 1999;27:393. doi: 10.1042/bst0270393. [DOI] [PubMed] [Google Scholar]
- 7.Ogretmen B, Kraveka JM, Schady D, Usta J, Hannun YA, Obeid LM. J Biol Chem. 2001;276:32506. doi: 10.1074/jbc.M101350200. [DOI] [PubMed] [Google Scholar]
- 8.Lozano J, Berra E, Municio MM, Diaz-Meco MT, Dominguez I, Sanz L, Moscat J. J Biol Chem. 1994;269:19200. [PubMed] [Google Scholar]
- 9.Kolesnick RN, Goni FM, Alonso A. J Cell Physiol. 2000;184:285. doi: 10.1002/1097-4652(200009)184:3<285::AID-JCP2>3.0.CO;2-3. [DOI] [PubMed] [Google Scholar]
- 10.Hanada K, Kumagai K, Yasuda S, Miura Y, Kawano M, Fukasawa M, Nishijima M. Nature. 2003;426:803. doi: 10.1038/nature02188. [DOI] [PubMed] [Google Scholar]
- 11.Chalfant CE, Szulc Z, Roddy P, Bielawska A, Hannun YA. J Lipid Res. 2004;45:496. doi: 10.1194/jlr.M300347-JLR200. [DOI] [PubMed] [Google Scholar]
- 12.Ogretmen B, Hannun YA. Nat Rev Cancer. 2004;4:604. doi: 10.1038/nrc1411. [DOI] [PubMed] [Google Scholar]
- 13.Reynolds CP, Maurer BJ, Kolesnick RN. Cancer Lett. 2004;206:169. doi: 10.1016/j.canlet.2003.08.034. [DOI] [PubMed] [Google Scholar]
- 14.Fillet M, Bentires-Alj M, Deregowski V, Greimers R, Gielen J, Piette J, Bours V, Merville MP. Biochem Pharmacol. 2003;65:1633. doi: 10.1016/s0006-2952(03)00125-4. [DOI] [PubMed] [Google Scholar]
- 15.Lopez-Marure R, Gutierrez G, Mendoza C, Ventura JL, Sanchez L, Reyes Maldonado E, Zentella A, Montano LF. Biochem Biophys Res Commun. 2002;293:1028. doi: 10.1016/S0006-291X(02)00315-7. [DOI] [PubMed] [Google Scholar]
- 16.Ogretmen B, Pettus BJ, Rossi MJ, Wood R, Usta J, Szulc Z, Bielawska A, Obeid LM, Hannun YA. J Biol Chem. 2002;277:12960. doi: 10.1074/jbc.M110699200. [DOI] [PubMed] [Google Scholar]
- 17.Shabbits JA, Mayer LD. Biochim Biophys Acta. 2003;1612:98. doi: 10.1016/s0005-2736(03)00108-1. [DOI] [PubMed] [Google Scholar]
- 18.Stover T, Kester M. J Pharmacol Exp Ther. 2003;307:468. doi: 10.1124/jpet.103.054056. [DOI] [PubMed] [Google Scholar]
- 19.Dindo D, Dahm F, Szulc Z, Bielawska A, Obeid LM, Hannun YA, Graf R, Clavien PA. Mol Cancer Ther. 2006;5:1520. doi: 10.1158/1535-7163.MCT-05-0513. [DOI] [PubMed] [Google Scholar]
- 20.Kraveka JM, Li L, Szulc ZM, Bielawski J, Ogretmen B, Hannun YA, Obied LM, Bielawska A. J Biol Chem. 2007 doi: 10.1074/jbc.M700647200. [DOI] [PMC free article] [PubMed] [Google Scholar]
- 21.Novgorodov SA, Szulc ZM, Luberto C, Jones JA, Bielawski J, Bielawska A, Hannun YA, Obeid LM. J Biol Chem. 2005;280:16096. doi: 10.1074/jbc.M411707200. [DOI] [PubMed] [Google Scholar]
- 22.Rossi MJ, Sundararaj K, Koybasi S, Phillips MS, Szulc ZM, Bielawska A, Day TA, Obeid LM, Hannun YA, Ogretmen B. Otolaryngol Head Neck Surg. 2005;132:55. doi: 10.1016/j.otohns.2004.08.015. [DOI] [PubMed] [Google Scholar]
- 23.Senkal CE, Ponnusamy S, Rossi MJ, Sundararaj K, Szulc Z, Bielawski J, Bielawska A, Meyer M, Cobanoglu B, Koybasi S, Sinha D, Day TA, Obeid LM, Hannun YA, Ogretmen B. J Pharmacol Exp Ther. 2006;317:1188. doi: 10.1124/jpet.106.101949. [DOI] [PubMed] [Google Scholar]
- 24.Szulc ZM, Bielawski J, Gracz H, Gustilo M, Mayroo N, Hannun YA, Obeid LM, Bielawska A. Bioorg Med Chem. 2006;14:7083. doi: 10.1016/j.bmc.2006.07.016. [DOI] [PubMed] [Google Scholar]
- 25.Bedia C, Triola G, Casas J, Llebaria A, Fabrias G. Org Biomol Chem. 2005;3:3707. doi: 10.1039/b510198k. [DOI] [PubMed] [Google Scholar]
- 26.Bielawska A, Greenberg MS, Perry D, Jayadev S, Shayman JA, McKay C, Hannun YA. J Biol Chem. 1996;271:12646. doi: 10.1074/jbc.271.21.12646. [DOI] [PubMed] [Google Scholar]
- 27.Bielawska A, Linardic CM, Hannun YA. J Biol Chem. 1992;267:18493. [PubMed] [Google Scholar]
- 28.Dagan A, Wang C, Fibach E, Gatt S. Biochim Biophys Acta. 2003;1633:161. doi: 10.1016/s1388-1981(03)00122-7. [DOI] [PubMed] [Google Scholar]
- 29.Gouaze V, Liu YY, Prickett CS, Yu JY, Giuliano AE, Cabot MC. Cancer Res. 2005;65:3861. doi: 10.1158/0008-5472.CAN-04-2329. [DOI] [PubMed] [Google Scholar]
- 30.Granot T, Milhas D, Carpentier S, Dagan A, Segui B, Gatt S, Levade T. Leukemia. 2006;20:392. doi: 10.1038/sj.leu.2404084. [DOI] [PubMed] [Google Scholar]
- 31.Grijalvo S, Bedia C, Triola G, Casas J, Llebaria A, Teixido J, Rabal O, Levade T, Delgado A, Fabrias G. Chem Phys Lipids. 2006;144:69. doi: 10.1016/j.chemphyslip.2006.07.001. [DOI] [PubMed] [Google Scholar]
- 32.He X, Dagan A, Gatt S, Schuchman EH. Anal Biochem. 2005;340:113. doi: 10.1016/j.ab.2005.01.058. [DOI] [PubMed] [Google Scholar]
- 33.Morales A, Paris R, Villanueva A, Llacuna L, Garcia-Ruiz C, Fernandez-Checa JC. Oncogene. 2007;26:905. doi: 10.1038/sj.onc.1209834. [DOI] [PubMed] [Google Scholar]
- 34.Raisova M, Goltz G, Bektas M, Bielawska A, Riebeling C, Hossini AM, Eberle J, Hannun YA, Orfanos CE, Geilen CC. FEBS Lett. 2002;516:47. doi: 10.1016/s0014-5793(02)02472-9. [DOI] [PubMed] [Google Scholar]
- 35.Samsel L, Zaidel G, Drumgoole HM, Jelovac D, Drachenberg C, Rhee JG, Brodie AM, Bielawska A, Smyth MJ. Prostate. 2004;58:382. doi: 10.1002/pros.10350. [DOI] [PubMed] [Google Scholar]
- 36.Selzner M, Bielawska A, Morse MA, Rudiger HA, Sindram D, Hannun YA, Clavien PA. Cancer Res. 2001;61:1233. [PubMed] [Google Scholar]
- 37.Usta J, El Bawab S, Roddy P, Szulc ZM, Yusuf, Hannun A, Bielawska A. Biochemistry. 2001;40:9657. doi: 10.1021/bi010535k. [DOI] [PubMed] [Google Scholar]
- 38.Abe A, Radin NS, Shayman JA, Wotring LL, Zipkin RE, Sivakumar R, Ruggieri JM, Carson KG, Ganem B. J Lipid Res. 1995;36:611. [PubMed] [Google Scholar]
- 39.Elojeimy S, Liu X, McKillop JC, El-Zawahry AM, Holman DH, Cheng JY, Meacham WD, Mahdy AE, Saad AF, Turner LS, Cheng J, T AD, Dong JY, Bielawska A, Hannun YA, Norris JS. Mol Ther. 2007 doi: 10.1038/sj.mt.6300167. [DOI] [PubMed] [Google Scholar]
- 40.Holman DH, Turner LS, El-Zawahry A, Elojeimy S, Liu X, Bielawski J, Szulc ZM, Norris K, Zeidan YH, Hannun YA, Bielawska A, Norris JS. Cancer Chemother Pharmacol. 2007 doi: 10.1007/s00280-007-0465-0. [DOI] [PubMed] [Google Scholar]
- 41.Liu X, Elojeimy S, El-Zawahry AM, Holman DH, Bielawska A, Bielawski J, Rubinchik S, Guo GW, Dong JY, Keane T, Hannun YA, Tavassoli M, Norris JS. Mol Ther. 2006;14:637. doi: 10.1016/j.ymthe.2006.06.005. [DOI] [PubMed] [Google Scholar]
- 42.Norris JS, Bielawska A, Day T, El-Zawahri A, ElOjeimy S, Hannun Y, Holman D, Hyer M, Landon C, Lowe S, Dong JY, McKillop J, Norris K, Obeid L, Rubinchik S, Tavassoli M, Tomlinson S, Voelkel-Johnson C, Liu X. Cancer Gene Ther. 2006;13:1045. doi: 10.1038/sj.cgt.7700965. [DOI] [PubMed] [Google Scholar]
- 43.Norris JS, Norris KL, Holman DH, El-Zawahry A, Keane TE, Dong JY, Tavassoli M. Future Oncol. 2005;1:115. doi: 10.1517/14796694.1.1.115. [DOI] [PubMed] [Google Scholar]
- 44.Szulc ZM, Mayroo N, Bai A, Bielawski J, Norris J, Hannun YA, Bielawska A. Bioorg Med Chem. 2007 doi: 10.1016/j.bmc.2009.01.057. (submitted) [DOI] [PMC free article] [PubMed] [Google Scholar]
- 45.Alphonse G, Bionda C, Aloy MT, Ardail D, Rousson R, Rodriguez-Lafrasse C. Oncogene. 2004;23:2703. doi: 10.1038/sj.onc.1207357. [DOI] [PubMed] [Google Scholar]
- 46.Auge N, Nikolova-Karakashian M, Carpentier S, Parthasarathy S, Negre-Salvayre A, Salvayre R, Merrill AH, Jr., Levade T. J Biol Chem. 1999;274:21533. doi: 10.1074/jbc.274.31.21533. [DOI] [PubMed] [Google Scholar]
- 47.Lepine S, Lakatos B, Courageot MP, Le Stunff H, Sulpice JC, Giraud F. J Immunol. 2004;173:3783. doi: 10.4049/jimmunol.173.6.3783. [DOI] [PubMed] [Google Scholar]
- 48.Maupas-Schwalm F, Auge N, Robinet C, Cambus JP, Parsons SJ, Salvayre R, Negre-Salvayre A. FASEB J. 2004;18:1398. doi: 10.1096/fj.03-1123fje. [DOI] [PubMed] [Google Scholar]
- 49.Payne SG, Brindley DN, Guilbert LJ. J Cell Physiol. 1999;180:263. doi: 10.1002/(SICI)1097-4652(199908)180:2<263::AID-JCP14>3.0.CO;2-H. [DOI] [PubMed] [Google Scholar]
- 50.Rodriguez-Lafrasse C, Alphonse G, Aloy MT, Ardail D, Gerard JP, Louisot P, Rousson R. Int J Cancer. 2002;101:589. doi: 10.1002/ijc.10652. [DOI] [PubMed] [Google Scholar]
- 51.Dubowchik GM, Padilla L, Edinger K, Firestone RA. J Org Chem. 1996;61:4676. doi: 10.1021/jo960367f. [DOI] [PubMed] [Google Scholar]
- 52.Firestone RA, Pisano JM, Bonney RJ. J Med Chem. 1979;22:1130. doi: 10.1021/jm00195a026. [DOI] [PubMed] [Google Scholar]
- 53.Kaufmann AM, Krise JP. J Pharm Sci. 2007;96:729. doi: 10.1002/jps.20792. [DOI] [PubMed] [Google Scholar]
- 54.Niemann A, Baltes J, Elsasser HP. J Histochem Cytochem. 2001;49:177. doi: 10.1177/002215540104900205. [DOI] [PubMed] [Google Scholar]
- 55.Babia T, Ledesma MD, Saffrich R, Kok JW, Dotti CG, Egea G. Traffic. 2001;2:395. doi: 10.1034/j.1600-0854.2001.002006395.x. [DOI] [PubMed] [Google Scholar]
- 56.Hu W, Xu R, Zhang G, Jin J, Szulc ZM, Bielawski J, Hannun YA, Obeid LM, Mao C. Mol Biol Cell. 2005;16:1555. doi: 10.1091/mbc.E04-07-0594. [DOI] [PMC free article] [PubMed] [Google Scholar]
- 57.Abe A, Hiraoka M, Shayman JA. J Lipid Res. 2006;47:2268. doi: 10.1194/jlr.M600183-JLR200. [DOI] [PubMed] [Google Scholar]
- 58.Shayman JA, Abe A, Hiraoka M. Glycoconj J. 2004;20:25. doi: 10.1023/B:GLYC.0000016739.32089.55. [DOI] [PubMed] [Google Scholar]
- 59.Van Overloop H, Van der Hoeven G, Van Veldhoven PP. J Lipid Res. 2005;46:812. doi: 10.1194/jlr.D400034-JLR200. [DOI] [PubMed] [Google Scholar]
- 60.Marchesini N, Osta W, Bielawski J, Luberto C, Obeid LM, Hannun YA. J Biol Chem. 2004;279:25101. doi: 10.1074/jbc.M313662200. [DOI] [PubMed] [Google Scholar]
- 61.Saad AF, Meacham WD, Bai A, Elojeimy S, Mahdy AEM, Turner LS, Cheng J, Bielawska A, Bielawski J, Keane TE, Hannun YA, Norris JS, Liu X. Oncogene. 2007 doi: 10.4161/cbt.6.9.4623. (submitted) [DOI] [PubMed] [Google Scholar]
- 62.Bielawski J, Szulc ZM, Hannun YA, Bielawska A. Methods. 2006;39:82. doi: 10.1016/j.ymeth.2006.05.004. [DOI] [PubMed] [Google Scholar]