Abstract
Juvenile neuronal ceroid lipofuscinosis (JNCL) is an autosomal recessively inherited neurodegenerative disorder that results from mutations in the CLN3 gene. JNCL is characterized by accumulation of autofluorescent lysosomal storage bodies, vision loss, seizures, progressive cognitive and motor decline, and premature death. Studies were undertaken to characterize the neuronal ceroid lipofuscinosis phenotype in a Cln3 knockout mouse model. Progressive accumulation of autofluorescent storage material was observed in brain and retina of affected mice. The Cln3-/- mice exhibited progressively impaired inner retinal function, altered pupillary light reflexes, losses of inner retinal neurons, and reduced brain mass. Behavioral changes included reduced spontaneous activity levels and impaired learning and memory. In addition, Cln3-/- mice had significantly shortened life spans. These phenotypic features indicate that the mouse model will be useful for investigating the mechanisms underlying the disease pathology in JNCL and provide quantitative markers of disease pathology that can be used for evaluating the efficacies of therapeutic interventions.
Keywords: behavior, neurodegeneration, mouse model, lysosomal storage, retina, brain, Batten disease, electroretinogram, CLN3
Introduction
The neuronal ceroid lipofuscinoses (NCLs) are autosomal recessively inherited lysosomal storage disorders associated with progressive neurodegeneration and the accumulation of autofluorescent storage bodies in various tissues (Wisniewski and Zhong, 2001). In humans, there are a number of forms of NCL that differ from one another in the age at which symptoms first appear, the rate of disease progression, and the patterns of symptoms (Dyken, 1988; Goebel and Wisniewski, 2004; Wisniewski and Zhong, 2001; Wisniewski et al., 2001). Almost all NCL patients exhibit severe vision loss and progressive cognitive impairment that reflects progressive pathological changes in the central nervous system, including engorgement of neurons with storage material, brain and retinal atrophy, and generalized neuronal degeneration (Goebel and Wisniewski, 2004). Currently there are no known treatments to delay or halt the progression of the NCLs; the development of therapeutic interventions has been impeded by the lack of defined objective markers of disease status. In humans, the different forms of NCL result from mutations in at least eight distinct genes (Goebel and Wisniewski, 2004; Siintola et al., 2006; Siintola et al., 2007; Steinfeld et al., 2006; Wisniewski et al., 2001).
The most prevalent form of human NCL is the juvenile type, commonly designated Batten disease. Children with this disorder typically begin to exhibit symptoms at 5 to 7 years of age and seldom live past their mid-twenties. Juvenile NCL results from mutations in the CLN3 gene which encodes a putative membrane protein of unknown function (Consortium, 1995; Kaczmarski et al., 1999; Mao et al., 2003; Mitchison et al., 1997; Phillips et al., 2005; Rakheja et al., 2004). Animal models could be of great value in developing a better understanding of the mechanisms underlying neuropathology in JNCL and in developing therapies for this disorder. Three mouse Cln3 knockout models have been created (Cotman et al., 2002; Katz et al., 1999; Mitchison et al., 1999) that could be useful in developing therapeutic interventions if they exhibit quantifiable signs of disease. Experiments were performed to determine whether a homozygous Cln3 knockout mutation in mice resulted phenotypic alterations that resembled the human disease phenotype. This is the first description of a Cln3-/- model that has been studied across the entire lifespans of mice and in a mouse strain in which the phenotypic effects of mutations in other NCL genes have also been characterized.
Materials and methods
Experimental Animals
The Cln3-/- mouse model for juvenile NCL was generated by gene targeting in RW4 mouse embryonic stem cells as previously described (Katz et al., 1999), and the knockout mice were subsequently backcrossed to the C57BL/6J strain for more than 15 generations. To confirm that the Cln3-/- mice were congenic to normal C57BL/6J animals over the entire genome except the region immediately surrounding the Cln3 gene, the founder mice were genotyped at 110 microsatellite loci that are polymorphic between the C57BL/6J and 129Sv/J (RW4) strains and that span the mouse genome at approximately 15 cM intervals (MaxBax panel, Charles River). Mice that were found to be homozygous for the C57BL/6J alleles at all loci tested were used for further breeding. To ensure that only a small region of the genome surrounding the Cln3 locus came from the 129Sv/J strain, the mice obtained were also genotyped at polymorphic marker loci D7MIT253, D7MIT105, and D7MIT109 located -7.6 cM, +3.1 cM, and +5.6 cM respectively from the Cln3 locus (located at 60.4 cM on mouse chromosome 7). Backcrosses were continued until founder mice homozygous for the C57BL/6J genotypes at all three loci were obtained. The resultant mouse model used in these studies is available from the Mutant Mouse Regional Resource Centers (strain 016150; strain name B6.129X1-Cln3tm1Mkat; http://www.mmrrc.org/index.html) coordinated by The Jackson Laboratory, Bar Harbor, Maine. C57BL/6J mice that were homozygous for the wildtype Cln3 allele were used as controls.
Mice were maintained on a 12 hr/12 hr light/dark cycle and provided with food and water ad libitum. Light intensities at the cage bottoms during the light phase of the daily cycle was 15-25 lux, room temperature was maintained between 18 and 22°C, and relative humidity was maintained between 30 and 50%. All animal experiments were approved by the University of Missouri-Columbia Animal Care and Use Committee and were conducted in accordance with the Guidelines of the U.S. National Institute of Health regarding the care and use of animals for experimental procedures.
Longevity
Analyses were performed to determine whether the Cln3 mutation affected longevity. Cohorts of the knockout mice and normal C57BL/6J controls were set aside at weaning and maintained under the standard housing conditions until they died of natural causes. Longevity was determined from records of birth dates and death dates for each animal.
Assessment of storage material accumulation in brain and retina
Mice were euthanized at various ages via carbon dioxide inhalation to determine if the Cln3-/- mice exhibited progressive accumulation of autofluorescent lysosomal storage material characteristic of the NCLs. The brains and retinas were immediately removed, fixed, and processed for fluorescence microscopy as described previously (Katz et al., 2005). Sections of frozen tissue were cut at a thickness of 5 μm on a cryostat, mounted in 0.17 M sodium cacodylate buffer, and examined with a Zeiss Axiophot microscope equipped with epiillumination. Fluorescence emissions were stimulated with light from a 50-W, high pressure mercury vapor source. Samples were examined and photographed using a 40X Plan Neofluor objective lens with a 1.30 numerical aperture, a 395-440 nm bandpass exciter filter, an FT-460 chromatic beam splitter, and an LP-515 barrier filter. Daylight-balanced color slide film (Koday Elite Chrome 100) was used for photography.
Electron microscopic analyses were also performed to assess the ultrastructure of the storage bodies in the knockout mice. Mice were euthanized with carbon dioxide inhalation at 12 months of age. The brains and eyes were immediately removed and placed in a mixed aldehyde fixative (Katz et al., 2005). With the brain immersed in fixative, coronal brain slices were made centered half way between the front and back edges of the cerebrum and through the center of the cerebellum. The brain slices were incubated in the fixative for at least two hours at room temperature with gentle agitation. Small regions of the cerebral cortex and cerebellar cortex were then dissected and processed for electron microscopy (Katz et al., 1982). Retina samples were prepared for electron microscopy as described previously (Lei et al., 2006). Thin sections of the tissues were examined and photographed with a JEOL 1200 EX transmission electron microscope.
Spontaneous Activity Assessment
The spontaneous activities of 12-month-old mutant and control mice were assessed with a VersaMax activity monitoring system (Accuscan Instruments, Inc.). Mice were placed in a plastic enclosure (41 cm by 41 cm by 30.5 cm high) with clear sides and top. The enclosure was transected by an x, y, z array of infrared beams, each with a corresponding detector. The movement and location of the mouse within the enclosure is monitored by recording which light beams are being interrupted by the mouse as a function of time.
Behavioral assessments were performed in an isolated closed room that was maintained under identical conditions for all of the evaluations. The only light in the testing room came from overhead fixtures that produced a mean illumination level in the testing enclosure of 40 lux.
On the day of a test the mice to be evaluated were placed in individual cages in the testing room by 3 hours after the onset of the daily light cycle. All testing was performed between 6 and 10 hours after light onset. Cages containing mice awaiting testing were placed out of sight of the testing apparatus. To begin testing, a mouse was placed in the monitoring enclosure and electronic monitoring was initiated. During monitoring, the data acquisition computer was covered with an opaque black cloth so that no light from the computer was visible. As soon as testing was initiated, the tester left the room through a revolving darkroom door and did not return to the room until after the end of the test session. Activity of each mouse was monitored for 20 minutes, however the first 5 minutes of each session was not included in the analyses to avoid including variability in the time it took the tester to cover the computer and leave the room. At the end of each monitoring session, the test enclosure was cleaned to remove any residue left by the mouse. The spontaneous activities of six normal C57BL/6J and seven Cln3-/- mice were compared.
Learning and memory assessment
Learning and memory were assessed in the Cln3-/- and control mice using the VersaMax activity monitoring system equipped with a hole poke accessory. This accessory consisted of a floor with 16 equally spaced holes. Beneath each hole was a well into which a piece of food bait (a piece of peanut butter flavored cereal) was placed. Mice were acclimated to the testing chamber by allowing them to explore the chamber for 20 minutes with food present and accessible in each well. The animals were then fasted for approximately 24 hours before being evaluated. For testing, a piece of bait was placed in each well, but access to the bait was blocked by a screen in all but one of the holes. A mouse was placed in one corner of the testing chamber and allowed to move about freely with no external cues. The monitoring system automatically recorded each hole the mouse explored. Each animal was allowed to remain in the testing chamber until it found the hole in which the food was accessible and retrieved the food. After allowing the mouse to eat most of the food bait, the animal was removed from the testing chamber for 5 minutes and then placed back in the chamber at the same starting position for another trial. Trials were repeated in succession for each mouse until the target hole was the first one visited for three trials in a row. The number of trials required to reach this performance criterion was recorded for each mouse. The performance on this test was assessed in 6 to 14 control and Cln3-/- mice in each age group (12 and 24 months).
Electroretinograms and pupillary light reflex measurements
Retinal function was assessed with electroretinogram (ERG) recordings from Cln3-/- and normal age-matched C57BL/6J mice at 12 and 24 months of age. Scotopic and photopic ERG recordings were performed using a previously published protocol (Lei et al., 2006; Wendt et al., 2005). Mice were kept in total darkness for at least 12 hours and were then anesthetized under dim red light with a mixture of ketamine (75 mg/kg i.m.) and xylazine (13.6 mg/kg i.m.). Pupils were dilated with 1% tropicamide and the mice were placed on a 38° C heating pad. The dark-adapted ERGs were then recorded bilaterally for each animal. To measure cone responses, the anesthetized mice were adapted for 10 minutes to a white background light with intensity of 30 cd/m2 to suppress rod system function. With the background light turned on, the ERGs were then recorded to white flash stimuli of -0.35 and 0.65 log cd-s/m2.
Pupillary light reflexes (PLRs) were measured in the same mice used for ERG recordings as well as in additional mice. The PLR measurements were performed essentially as described previously (Lei et al., 2006). All PLR recordings were performed between 4 and 8 hours after the onset of the daily light cycle. The mice were kept in darkness for at least 2 hours prior to recording and were prepared under dim red light. The animals were sedated with a mixture of ketamine (50 mg/kg i.m.) and xylazine (10 mg/kg i.m.) and changes in pupil size in response to light stimuli were recorded.
Retinal cell density determinations
Eyes were collected from 12 and 24 month old Cln3-/-and normal C57BL/6J mice and were fixed and embedded as described above for the electron microscopic preparations. Sections of the retinas were cut a thickness of 0.5 μm and stained with Toluidine blue. With the assistance of the Metamorph image analysis program (Universal Imaging Corp., Downingtown, PA), nuclei in the inner and outer nuclear layers were counted in two 350 μm long regions of the retina extending from 400 to 750 μm from either edge of the optic nerve head. Counts were performed on two retinal sections from each animal. The cell density for each animal was calculated as the mean of these 4 counts.
To determine whether the Cln3 knockout mutation resulted in a loss of ganglion cells from the retina by 12 months of age, the axons of the ganglion cells were counted where they traverse the optic nerve. The axons were counted in cross-sections of the optic nerves from 12-month-old knockout and control mice. Eyes were enucleated from the animals with approximately 1 mm of optic nerve still attached. The eyes were fixed as described above and dissected to obtain a stub of optic nerve attached to a small piece of the eyeball surrounding the attachment site. The samples were processed and embedded for electron microscopic examination. Thin optic nerve cross-sections were cut and mounted on slotted grids for electron microscopic examination. A 1 μm thick section was taken from each sample immediately adjacent to the region from which thin sections were obtained. The total cross-sectional area of the optic nerve was determined from a light micrograph of the latter section. The optic nerve cross-sections were divided into five concentric circular regions centered on the center of the optic nerve. A series of micrographs was obtained from each region in proportion to the fraction of the total cross-sectional area of the optic nerve represented by that region. The number of axon cross-sections per unit optic nerve cross-sectional area was then determined for each micrograph. A total of 2500 μm2 optic nerve cross-sectional area was analyzed for each optic nerve. The counted number of axons per μm2 was multiplied by the total optic nerve cross-sectional area to obtain an estimate of the total number of axons in each optic nerve. Axons were counted manually in a masked manner.
Brain weights
Brain weights were determined for 12-month-old knockout and control mice as a gross assessment of whether the Cln3 mutation resulted in brain degeneration. Mice were euthanized via decapitation and the brains were quickly dissected out and weighed. Care was taken to consistently dissect out all brains in the same manner. Prior to euthanizing the animals body weights were obtained so that we could assess whether smaller brain size was associated with smaller body size.
Statistical analyses
In cases where just two groups of animals were being compared (such as optic nerve axon numbers in 12-month-old mice), Student’s T-test was used for statistical analyses. In all other cases, statistical analyses were performed using analysis of variance. The SigmaStat program (SPSS Inc.) was used to perform all statistical analyses. Results are expressed as mean ± SD unless otherwise noted.
Results
Longevity
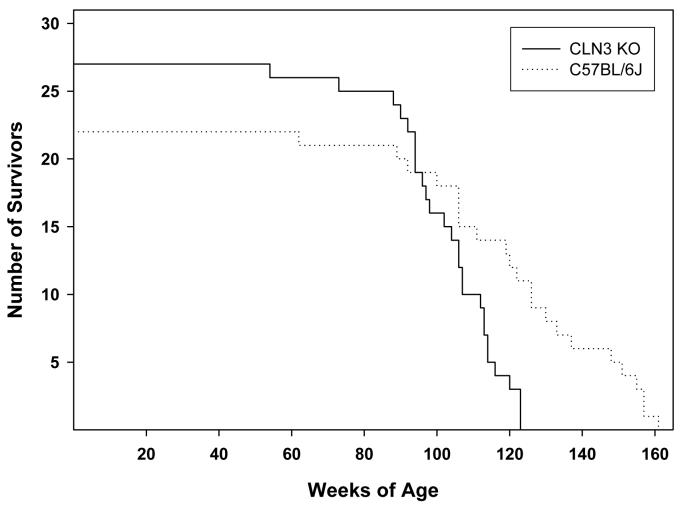
Mice that were homozygous for the Cln3 knockout mutation had significantly shortened life spans compared to normal congenic control mice (Fig. 1). The mean survival time for the mutant mice was 103 weeks compared to 123 weeks for the congenic normal mice, a difference of over 19% (p<0.001). Maximum life span in the normal mice was 161 weeks compared to 123 weeks in the knockout animals, a difference of over 30%.
Fig. 1.
Survival plots for Cln3-/- and C57BL/6J mice.
Storage body accumulation
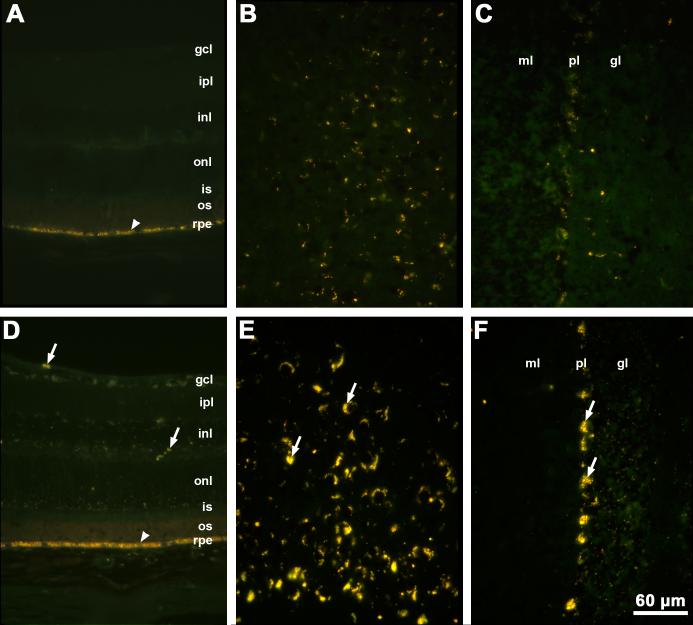
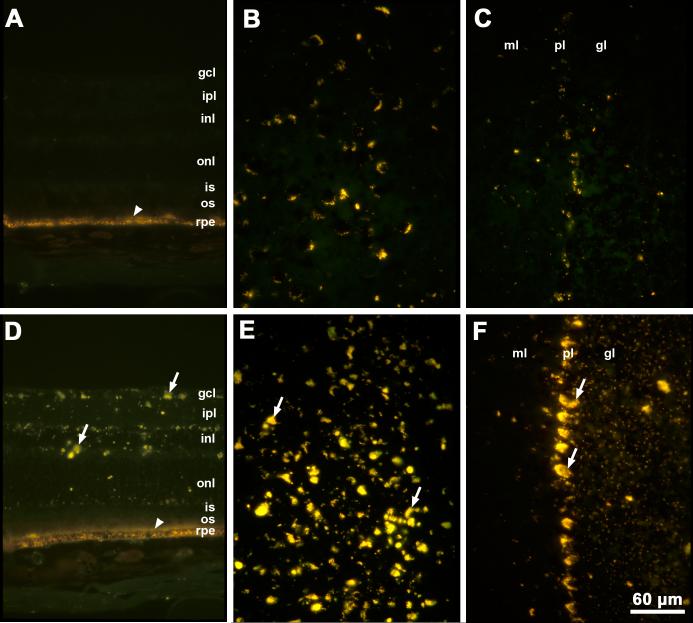
Autofluorescent storage material was observed in the brains and retinas of Cln3-/-mice as early as 5 weeks of age. By 12 months of age, substantial accumulation of autofluorescent storage material was observed in the brains and retinas of Cln3-/-mice relative to C57BL/6J control animals (Fig. 2). Normal age pigment (lipofuscin) has fluorescence properties that are indistinguishable from those of the disease-specific lysosomal storage bodies. Lipofuscin was observed in the brains and in the retinal pigment epithelium of the control mice (Fig. 2). However, the amounts of autofluorescent material were substantially greater in the brains of age-matched Cln3-/-mice (Fig. 2). In the neural retina autofluorescent storage material was present only in the knockout animals (Fig. 2). The amounts of autofluorescent storage increased greatly between 12 and 24 months of age (Fig. 3).
Fig. 2.
Fluorescence micrographs of cryostat sections of retina (A), cerebral cortex (B) and cerebellum (C) from a 12 month old normal C57BL/6J mouse and of retina (D), cerebral cortex (E), and cerebellum (F) from a 12 month old Cln3-/- mouse. Arrows indicate autofluorescent storage material. Arrowheads indicate retinal pigment epithelium with normal autofluorescent age pigment. Bar in (F) indicates magnification in all six micrographs. Layers of the retina are indicated by gcl: ganglion cell layer; ipl: inner plexiform layer; inl: inner nuclear layer; onl: outer nuclear layer; is: photoreceptor inner segments; os: photoreceptor outer segments; rpe: retinal pigment epithelium. Layers of the cerebellum are indicated by ml: molecular layer; pl: Purkinje cell layer; gl: granular layer.
Fig. 3.
Fluorescence micrographs of cryostat sections of retina (A), cerebral cortex (B) and cerebellum (C) from a 24 month old normal C57BL/6J mouse and of retina (D), cerebral cortex (E), and cerebellum (F) from a 24 month old Cln3-/- mouse. Arrows indicate autofluorescent storage material. Arrowheads indicate retinal pigment epithelium with normal autofluorescent age pigment. Bar in (F) indicates magnification in all six micrographs. Layers in the retina and cerebellum are indicated as noted in the legend to Fig. 1.
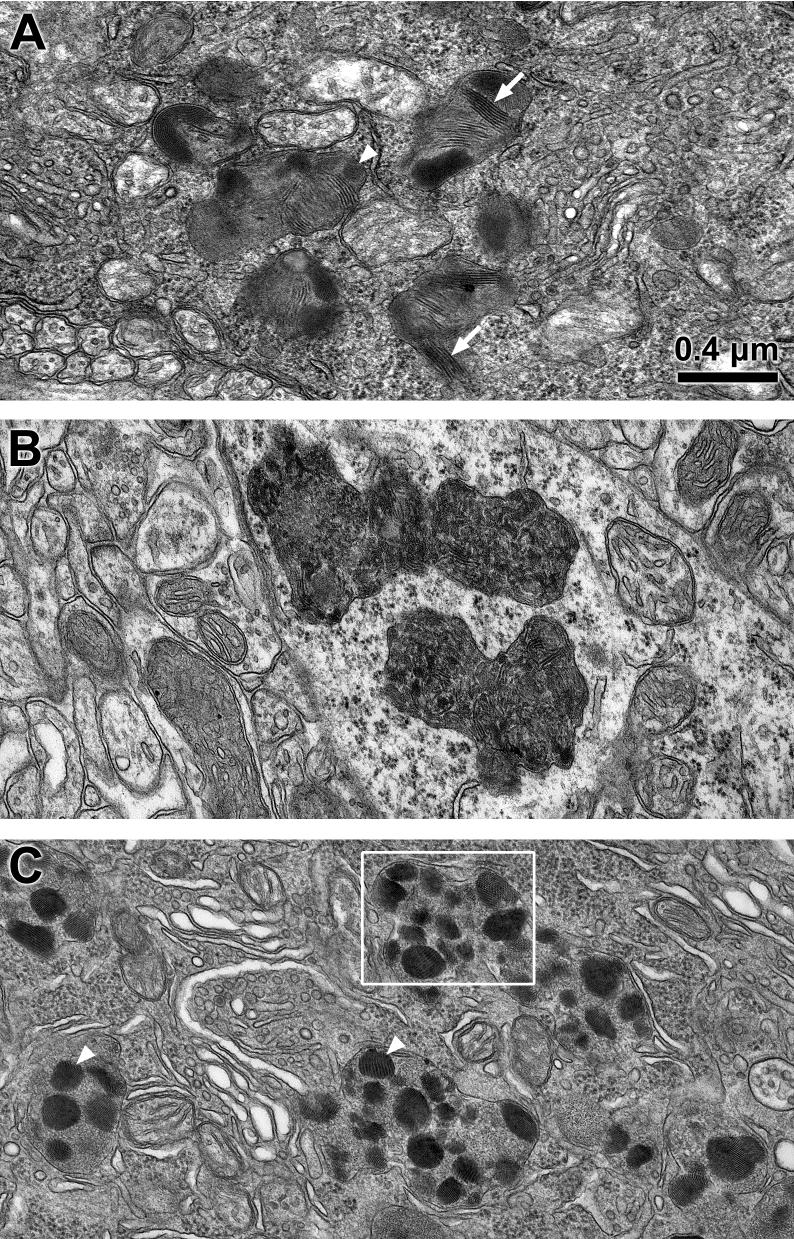
The ultrastructure of the storage material in neural tissues was somewhat variable. In the retinal ganglion cells, the most prominent features of the storage material were stacks of parallel arrays of membrane-like structures, similar to rectilinear and fingerprint profiles that have been described in human JNCL (Figs. 4 and 5). Also present in the retinal ganglion cell storage bodies were small crystalloid aggregates (Figs. 4C and 5). In the cerebral cortex, large masses of storage bodies were observed with electron microscopy in the perinuclear regions of many neurons. The contents of these storage bodies were heterogeneous mixtures of loosely packed membrane-like curvilinear, granular, and crystalloid aggregates (Fig. 4B). In the cerebellum, the largest accumulations of storage bodies were in the Purkinje cells (Fig. 4C). The storage bodies in these cells contained more prominent crystalloid structures embedded in a matrix composed mainly of small aggregates of material (Fig. 4C, Fig. 5). The crystalloid structures appeared as stacks of parallel linear components similar to structures designated as “fingerprint profiles” in human JNCL (Wisniewski et al., 2001), as arrays of woven fiber-like constituents, or as regular patterns of small circular profiles depending on the plane of section (Fig. 5). A similar pattern of regularly packed circular profiles was observed in storage bodies in human variant late infantile NCL due to mutations in CLN6 (Wisniewski et al., 2001).
Fig. 4.
Electron micrographs of storage bodies (s) in a retinal ganglion cell (A), cerebral cortex neuron (B) and cerebellar Purkinje cell (C) of a 24 month old Cln3-/- mouse. Storage bodies contained membrane-like (arrows) and crystalline (arrowheads) inclusions. Box in (C) indicates area shown at higher magnification in Fig. 5. Bar in (A) indicates magnification of all three micrographs.
Fig. 5.
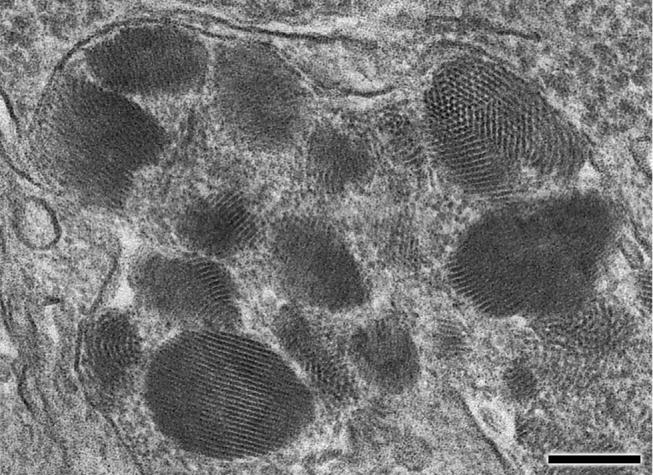
High magnification electron micrograph of storage body inclusions from a cerebellar Purkinje cell shown in Fig. 4. The storage body contains aggregates of material that form regular rectilinear arrays very similar to “fingerprint profiles” described in storage bodies from human JNCL patients. In some planes of section this material appears to be composed of small circular tubes cut in cross-section. Bar is 0.2 μm.
Behavioral changes
Evaluation of spontaneous activity in 12-month-old animals revealed significant differences between the Cln3-/- and control mice in the majority of the parameters that were evaluated (Table 1). Most of these differences reflected decreased overall activity in the knockout mice. For example, the total distance moved by the Cln3-/- mice during the test period was an average of 32% less than that of the normal control animals. No differences were observed in place preference within the cage or in the tendency to revolve in place.
Table 1.
Spontaneous behavioral parameters for 12 month old Cln3-/- and C57BL/6J mice
| Parameter | C57BL/6J (n=6) | Cln3-/- (n=7) | P |
|---|---|---|---|
| Horizontal beam interruptions | 5028 ± 228 | 4102 ± 149 | 0.005 |
| Total distance moved (cm) | 2934 ± 216 | 2006 ± 189 | 0.008 |
| Number of horizontal movements | 231 ± 6.6 | 201 ± 9.0 | 0.025 |
| Time spent moving (sec) | 290 ± 18 | 218 ± 20 | 0.023 |
| Vertical beam interruptions | 269 ± 17 | 156 ± 19 | 0.001 |
| Number of vertical movements | 116 ± 8.6 | 73 ± 7.3 | 0.003 |
| Time spent vertical (sec) | 91 ± 6.1 | 59 ± 9.7 | 0.021 |
| Stereotypic beam breaks | 2879 ± 179 | 2383 ± 73 | 0.020 |
| Number of stereotypic episodes | 168 ± 1.8 | 156 ± 4.0 | 0.027 |
| Time spent in stereotypic behavior (sec) | 251 ± 15 | 239 ± 15 | 0.563 |
| Number of clockwise revolutions | 10 ± 1.8 | 7.1 ± 1.3 | 0.234 |
| Number of counterclockwise revolutions | 9.7 ± 1.0 | 6.6 ± 1.4 | 0.127 |
| Distance traveled in cage margin (cm) | 1944 ± 217 | 1158 ± 115 | 0.007 |
| Time spent in cage margin (sec) | 652 ± 23 | 575 ± 45 | 0.174 |
| Distance traveled in cage center (cm) | 991 ± 51 | 849 ± 99 | 0.255 |
| Time spent in cage center (sec) | 248 ± 23 | 325 ± 45 | 0.174 |
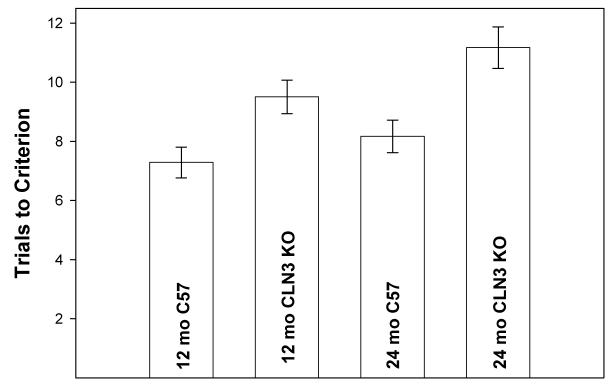
The ability of the mice to learn and remember the location of a hidden food reward was evaluated at 12 and 24 months of age. At 12 months of age, there was not a significant difference between the Cln3-/- and control mice in performance on this test (Fig. 6). However, at 24 months of age the Cln3-/- mice required a mean of 11.2 trials to reach the performance criterion whereas the control mice reached this criterion in a mean of only 8.1 trials (p<0.01).
Fig. 6.
Performance of Cln3-/- and control mice on the “hole poke” learning and memory behavioral test. Data represent the mean ± SEM for 6 to 14 mice per group.
Electroretinograms
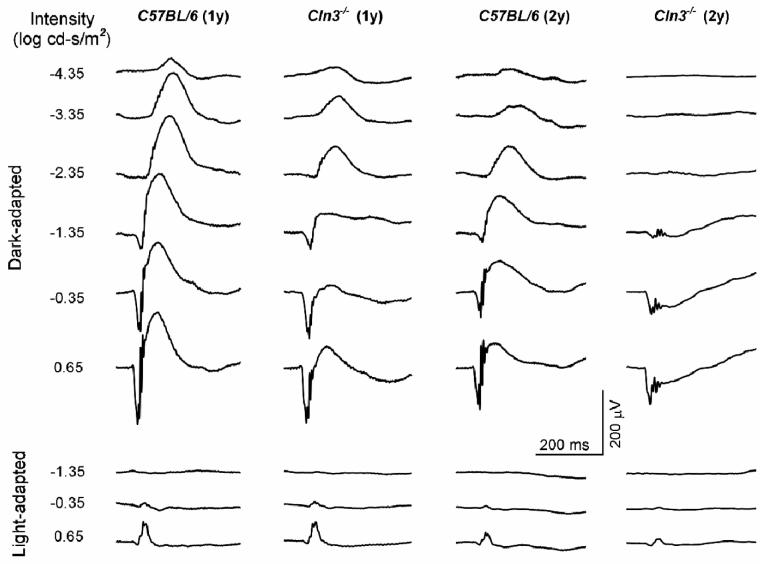
At 12 months of age, scotopic ERG b-wave amplitudes were significantly reduced in the Cln3-/- mice compared to age-matched controls across a wide range of stimulus intensities (Figs. 7,8). For example, at the highest stimulus light intensity (0.65 log cd-s/m2), the average scotopic ERG b-wave amplitude of the Cln3-/- mice was only 209.4 ± 39.8 μV (n=11), compared to 344.5 ± 38.6 μV (n=9) for the control mice (p<0.01). The average a-wave amplitudes, on the other hand, did not differ significantly between the Cln3-/- and control mice at 12 months of age. Decreases in the ERG b-wave and preservation of the a-wave amplitudes resulted in a decrease of the b-wave/a-wave ratio (Fig. 7). At the highest stimulus intensity this ratio was 1.26 ± 0.12 in the 12 month-old Cln3-/- mice but 1.76 ± 0.15 in the age-matched control animals (p<0.01).
Fig. 7.
Representative ERGs recorded from Cln3-/- mice and C57BL/6J mice at 1 and 2 years of age. In 1-year-old mice, the dark-adapted b-wave amplitudes of the Cln3-/- mouse moderately decrease, but the a-wave amplitudes are comparable to the age-matched control. In 2-year-old mice, the dark-adapted b-wave amplitudes of the Cln3-/- mouse are significantly reduced, while the a-waves are preserved. Negative ERG waveforms are evident in Cln3-/- mouse. The light-adapted b-wave amplitudes of Cln3-/- mouse decrease. (Background light: 30 cd/m2)
Fig. 8.
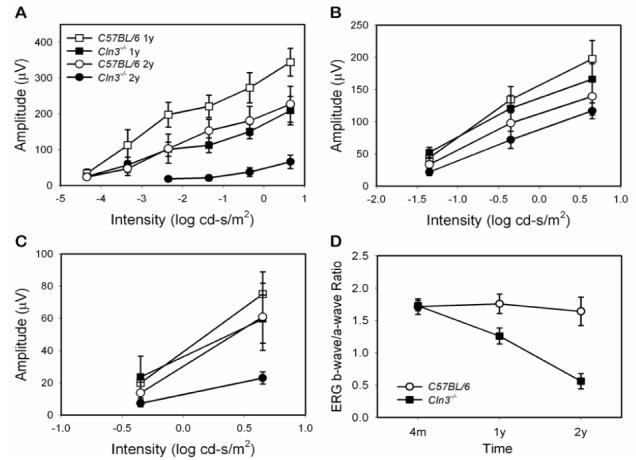
ERG intensity-response amplitude curves for Cln3-/- mice and age- and sex-matched control C57BL/6J mice at 1 and 2 years of age (A, B, C) and the time course of the ERG b-wave/a-wave ratio (D). Nine Cln3-/- mice were evaluated at both 1 and 2 years of age, 11 control mice were evaluated at 1 year of age and 9 control mice were evaluated at 2 years of age. A. Dark-adapted b-wave. B. Dark-adapted a-wave. C. Light-adapted b-wave. Cln3-/- mouse ERG b-wave amplitudes decrease progressively starting at 1 year of age. Data shown are mean ± SD of response amplitudes. The background illumination for light-adapted ERG is 30 cd/m2.
Scoptopic ERG b-wave response amplitudes decreased significantly between 12 and 24 months of age for both the Cln3-/- and control mice (Figs. 6 and 7), but the decreases were much more profound in the knockout animals. For example, at the highest stimulus intensity the average ERG b-wave amplitude of 24-month-old Cln3-/- mice was 66.4 ± 18.8 μV (n=9) compared to 227.1 ± 50.18 μV (n=9) for the age-matched control mice (p<0.01). The a-wave amplitudes also decreased significantly between 12 and 24 months of age for both the Cln3-/- mice and the control animals. However, the mean a-wave amplitudes did not differ significantly between the knockout and control animals at 24 months of age. As at 12 months of age, decreases in ERG b-wave amplitudes and preservation of the a-wave amplitudes resulted in a decrease of the b-wave/a-wave ratio in the 24-month-old Cln3-/- mice. At the highest stimulus intensity, this ratio was only 0.56 ± 0.17, compared to a ratio of 1.64 ± 0.22 for the age-matched control mice (p<0.01).
To assess cone system function, we analyzed the photopic ERGs recorded under a rod-suppressing condition in Cln3-/- and control mice. The average photopic ERG b-wave amplitude elicited with the highest intensity in the 12-month-old Cln3-/- mice was significantly smaller than that of the age-matched control mice (59.6 ± 15.0 μV, n=11 vs. 75.1 ± 13.8 μV, n=9, p < 0.05). In 24-month-old mice, the average photopic b-wave amplitude of the Cln3-/- group (23.0 ± 3.8 μV, n=8) was significantly lower than that of the control group (61.0 ± 20.8 μV, n=8) (p <0.01).
Pupillary Light Reflex
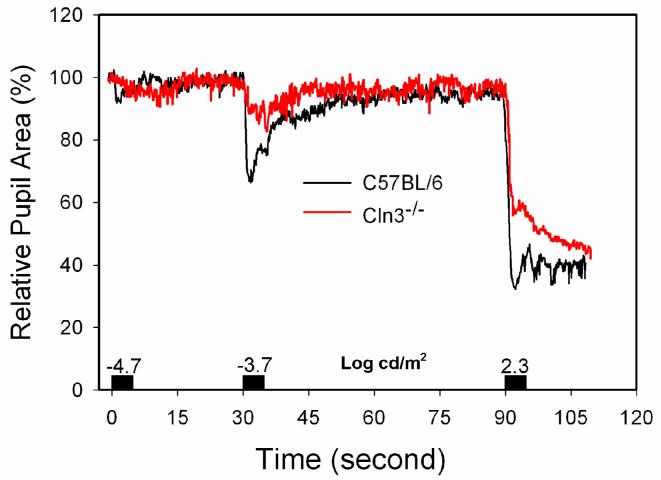
In 12-month-old animals PLR amplitudes and velocities did not differ significantly between Cln3-/- mice and age-matched controls at any stimulus intensity level. The 24-month-old Cln3-/- mice, however, exhibited slower PLR responses with reduced amplitudes when compared with controls (Fig. 9). At the -4.7 log cd/m2 stimulus intensity level, which is close to the threshold of the light-evoked pupillary reflex, the average time to peak PLR amplitude was increased in the Cln3-/- mice, while PLR amplitudes were comparable in both Cln3-/- and control mice. At the -3.7 log cd/m2 stimulus intensity, the Cln3-/- mice exhibited lower PLR amplitudes (pupil area after stimulus = 88.35 ± 9.49 % of dark-adapted area) than the controls (pupil size after stimulus = 64.35± 10.34 % of the dark-adapted area) (p<0.05, Man-Whitney U test). At the highest stimulus intensity level (2.3 log cd/m2), PLR maximum amplitudes did not differ significantly between the knockout and control mice, but the time course of the responses was altered in the Cln3-/- animals. In the control mice, the pupil constricted rapidly to a minimum size after the onset of the stimulus, and remained at this reduced size for some time after the end of the stimulus (Fig. 9). In the Cln3-/- animals, on the other hand, light-induced pupillary constriction was biphasic, with an initial rapid constriction followed by a further slow constriction that continued after the end of the light stimulus (Fig. 9).
Fig. 9.
Averaged PLR vs. time curves from 24-month-old Cln3-/- (n=4) and from age-matched wild-type (n=5) mice. Black blocks over the time axis represent the duration of light stimulation and the numbers indicate the stimulus intensities (log cd/m2). The Cln3-/- mice exhibited decreased and sluggish PLRs.
Retinal cell densities
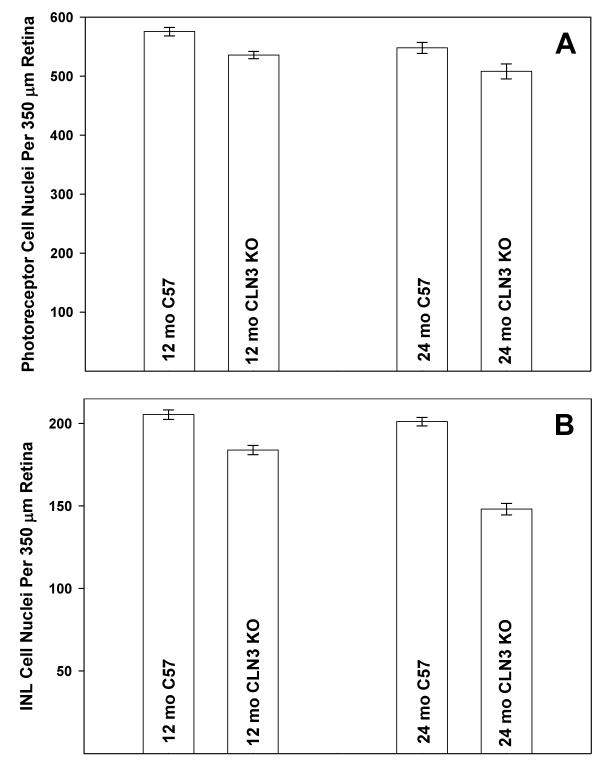
At both 12 and 24 months of age, mean photoreceptor cell density in the Cln3-/- mice was about 7% less than in the age-matched control animals (p<0.05) (Fig. 10A). No significant changes in photoreceptor cell density occurred between 12 and 24 months of age in either Cln3-/- or control mice. The Cln3 mutation resulted in more substantial losses of cells with nuclei in the inner nuclear layer (INL) of the retina (Fig. 10B). At 12 months of age, INL cell density was 11% lower in the Cln3-/- mice than in the control animals (p<0.001). At 24 months of age, INL density in the Cln3-/- mice was 26% lower than that in the control animals (p<0.001). INL cell density in the control mice did not change significantly between 12 and 24 months of age, but declined by 20% in the Cln3-/- mice (p<0.001).
Fig. 10.
Photoreceptor and inner nuclear layer cell densities in Cln3-/- and control mice at 12 and 24 months of age. Data shown are mean ± SEM for 6 to 7 mice per group.
The numbers of ganglion cells in the retinas of 12-month-old Cln3-/- and control mice were estimated from optic nerve axon counts (Fig. 11). The knockout mice had substantially fewer ganglion cell axons in the optic nerve (46,430 ± 7,190; n=4) than did the age-matched control mice (84,180 ± 4,980; n=4) (p< 0.01). The loss of axons was accompanied by decreases in optic nerve cross-sectional areas, while the axon densities were not significantly different between the two groups and ultrastructural appearances of the axon cross-sections were not distinguishable (Fig. 11).
Fig. 11.
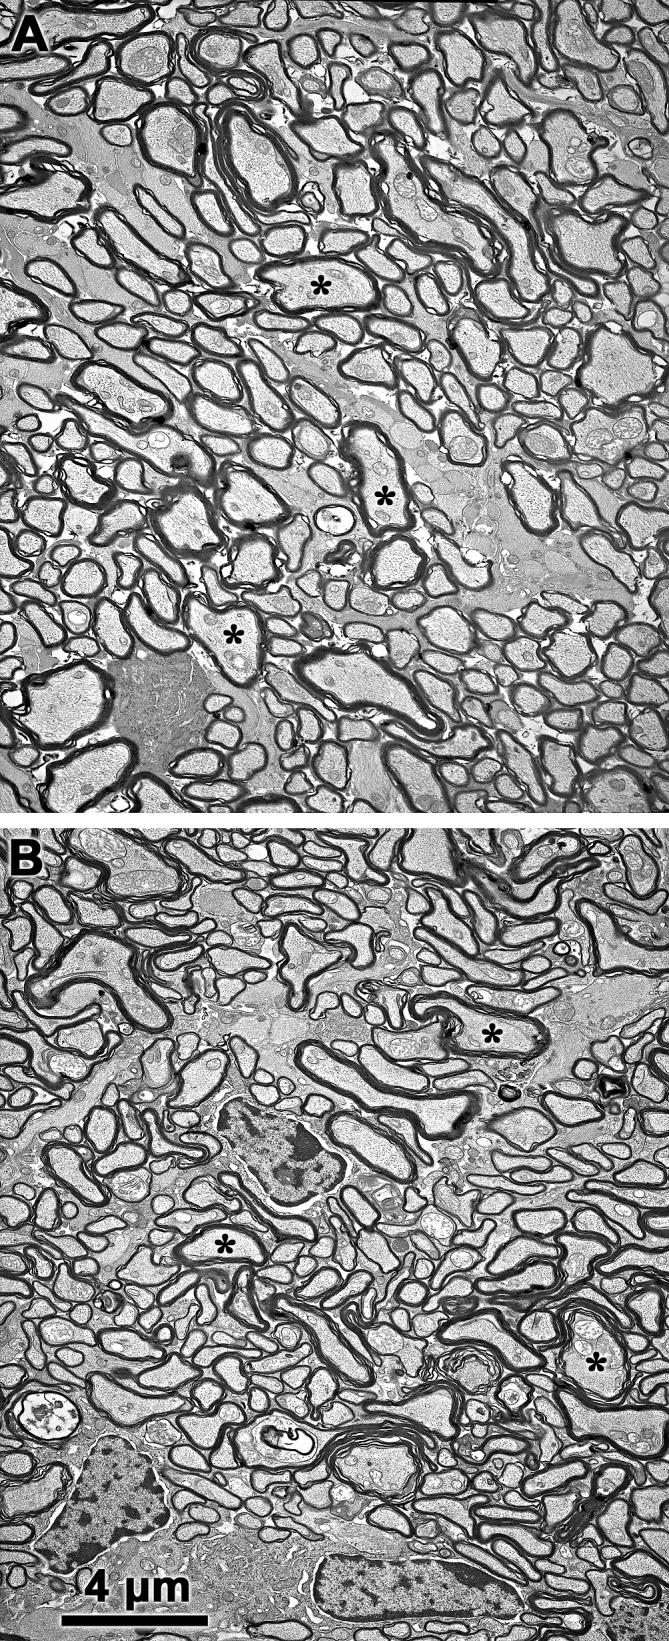
Representative electron micrographs of optic nerve cross-sections from 12-month-old control (A) and Cln3-/- (B) mice. Axons (asterisks indicate representative axons) are clearly delineated by their myelin sheaths. Although there were significantly fewer axons in the Cln3-/- mice than in the control animals, the densities of the axons were similar in the control and knockout mice and there were no apparent differences in ultrastructural appearance between the normal and mutant mice. Bar in (B) indicates magnification for both micrographs.
Brain weights
Brain weights were determined in knockout and control mice at 12 months of age. In the control animals, the mean and standard deviation of the brain weights was 458 ± 12 mg (n=15). For the knockout mice the mean and standard deviation of the brain weights was 423 ± 15 mg (n=17). Thus, mean brain weight was approximately 8% lower in the knockout animals than in age-matched controls (p<0.001). There was not a significant difference in average body weights between the knockout and control mice at 12 months of age (33.6 ± 4.1 g (n=15) for the control animals and 34.7 ± 4.9 g (n=17) for the knockout mice.
4. Discussion
Children homozygous for null mutations in the CLN3 gene suffer from the severe progressive neurodegenerative disorder JNCL. Clinical symptoms include progressive vision loss, severe cognitive and motor decline, and seizures (Dyken, 1988; Goebel and Wisniewski, 2004; Weleber, 1998; Wisniewski and Zhong, 2001; Wisniewski et al., 2001). In the later stages of the disease affected children become severely handicapped. Death typically occurs by the mid-twenties. There are currently no effective therapies for this disorder and the mechanisms underlying neurodegeneration are unknown. In addition, the function of the CLN3 protein has not yet been determined (Phillips et al., 2005). To gain a better understanding the mechanisms underlying the disease pathology and to test potential approaches to therapy, it is important that a suitable animal model for JNCL be developed. Toward this end, three laboratories have generated mice with null mutations in the Cln3 gene (Cotman et al., 2002; Katz et al., 1999; Mitchison et al., 1999). Of these models, that described in the present study is the only one with the mutation on a pure C57BL/6J stain background. The normal phenotypes for many parameters of relevance to JNCL have been much more extensively characterized C57BL/6J mouse strain than they have been for other strains such as 129S6 or CD1 mice, the strains in which the other Cln3 mutations occur. Furthermore, the C57BL/6J strain is highly inbred resulting in less variability between individuals than in outbred strains such as CD1. In addition, mouse models for other neuronal ceroid lipofuscinoses, including CLN1, CLN6, and CLN8, have been established on the C57BL/6J strain background (Gupta et al., 2001; Lei et al., 2006; Ranta et al., 1999; Wheeler et al., 2002). Having all mouse NCL mutant models on the same strain background will facilitate phenotypic comparisons between the different mutations.
Phenotypic analyses of the mouse gene knockout models indicate that the effects of Cln3 gene disruption in mice are generally less profound than they are in humans (Pontikis et al., 2004; Seigel et al., 2002; Weimer et al., 2006). For example, life expectancy in affected human subjects is reduced by about two-thirds, even with excellent medical care, whereas the mean life spans of the Cln3-/- mice evaluated in this study are reduced by only 19% relative to control mice. Nevertheless, the knockout animals exhibit quantifiable neuropathological changes that will be useful in assessing the efficacy of experimental therapeutic interventions.
Retinal function, as assessed by ERG recordings in the current study, is significantly impaired in the knockout mice by 12 months of age, and function declines further as the animals age (Figs. 7 and 8). The onset of this functional impairment is relatively late, as no significant alterations in ERG responses were observed in the knockout mice at 4 months of age (Wendt et al., 2005). The functional deficits appear to be primarily restricted to the inner retina, as the a-waves, generated by the photoreceptor cells, were not significantly altered compared to those of control mice whereas the b-waves, generated by bipolar cells in the inner retina, were substantially reduced in amplitude. Consistent with the functional data, the knockout mice exhibited only minor decreases in photoreceptor cell densities, but substantial losses of cells with nuclei in the inner nuclear layer.
The retinal ganglion cells integrate signals generated by other retinal neurons and transmit these signals to the brain. Because of their much larger visual fields, loss of or damage to ganglion cells are likely to have more profound effects on visual function than proportional pathology in the other retinal neurons. Ganglion cell function is not detected with routine ERG measurements, so it was not possible to assess ganglion cell function from our electrophysiological recordings. However, by 12 months of age, there was a substantial loss of ganglion cells from the Cln3-/- retinas, as assessed by optic nerve axon numbers. The decrease in axon numbers was accompanied by a decrease in optic nerve cross-sectional area while axon densities were not altered relative to age-matched control mice. In contrast, in a study of 129S6 mice with a Cln3 knockout mutation, optic nerve axon densities were lower and axon diameters were higher in the mutant than in the control mice (Sappington et al., 2003). However, no attempt to estimate total axon numbers was made in the study on the 129S6 mice and the ages of the animals that were analyzed in the latter study were not provided. Therefore, it is not possible to determine whether the effects of the Cln3 mutations on the optic nerve differ in the two Cln3 knockout models. Vision loss is one of the earliest signs in JNCL, but whether this loss involves early loss of ganglion cells is not known. Retinal pathology has only been examined in the end-stage of the human disease, by which time the entire retina has undergone severe degeneration (Bensaoula et al., 2000). In the knockout mice evaluated in the present study, disease-specific storage body accumulation occurs early in the inner retina, indicating that storage body accumulation and cell loss are correlated.
Retinal morphology has been studied in two other mouse models of JNCL (Cotman et al., 2002; Seigel et al., 2002; Weimer et al., 2006). Seigel and colleagues (Seigel et al., 2002) evaluated the effects of a Cln3 knockout mutation in the 129/SvEvTac (129S6) mouse strain. In the latter model, evidence of apoptosis among retinal cells was observed at 18 months of age but not earlier. It was reported in this study that “there was no obvious loss of cell types in the retina up to 18 months of age”; however, no quantitative assessments of retinal cell densities were undertaken in the knockout and control mice at any age. Given the evidence of apoptosis among retinal cells in the 129S6 Cln3-/- mice, it appears likely that modest losses of retinal neurons similar to those observed in the C57BL/6J Cln3-/- model occurred in the 129S6 model. Weimer and colleagues also studied the retina in Cln3-/- mice up to 12 months of age (Weimer et al., 2006). Based on their citation of the source of the mutant mice, they appeared have used the same model studied by Seigel and colleagues, although Weimer et al. stated that in the mice they studied the mutation was on the 129/SvJ strain background. The latter investigators reported that there was no apparent difference between the retinas of the Cln3-/- and control mice up to 12 months of age, but no quantitative assessments of retinal cell densities were performed and no animals older than 12 months were evaluated. Cotman and colleagues (Cotman et al., 2002) generated mice with an exon 7-8 deletion in the Cln3 gene in outbred 129Sv/Ev/CD1 mice. These mice produce both white (hypopigmented) and agouti offspring. Although this model was not evaluated extensively for retinal degenerative changes, evidence for significant cone cell loss was reported in hypopigmented but not agouti Cln3Δex7/8 mice that were 10 to 17 months old. Densities of other retinal cell types were not evaluated. The ERG data in the present study demonstrated a disease-related loss of cone function but morphological assessment of cone cell density in the retina was performed.
In the 129S6 Cln3 knockout model, retinal function, as assessed by ERG responses, was judged to be well preserved through 11 months of age, although no quantitative analyses were performed (Seigel et al., 2002). In the ERG recordings from an 11-month-old knockout mouse that were included in the latter publication, the b-wave to a-wave ratios appear to be lower than the recordings from an age-matched control animal. This is similar to the observation in the current study that b-wave amplitudes are decreased relative to a-wave amplitudes in 12-month-old C57BL/6J Cln3-/- mice.
In patients with JNCL, no deficits in visual function are apparent in infancy and early childhood, but affected children eventually become completely blind. Weleber (Weleber, 1998) was able to obtain ERG recordings from JNCL-affected children that still had some residual visual function. In those children, b-wave amplitudes were more severely depressed than a-wave amplitudes and an electronegative pattern was prominent. Eventually, however, the entire ERG response was nonrecordable. The early relative preservation of the a-wave suggests that in humans, as in the mouse model, the inner retina is affected by the disease first. However, unlike the mouse, photoreceptor structure and function are eventually severely affected as well. Because morphological data from early-stage human retinas are not available, it is not known whether the early selective decline in b-wave amplitudes is a result of selective degenerative changes in the inner retina. Examination of retinas obtained postmortem at the end stage of disease indicate that both the photoreceptor cell layer and inner retina ultimately undergo pronounced degeneration in the human disease (Bensaoula et al., 2000; Goebel et al., 1974; Traboulsi et al., 1987).
While the C57BL/6J Cln3-/- mice may only model the early stages of the retinal degeneration associated with JNCL, it is these early stages that are most important with respect to therapeutic interventions. The most desirable interventions would be those that could be administered early, before irreversible degenerative changes occur. It is likely that interventions that would prevent functional impairment and degeneration of the inner retina would also prevent the degeneration of the photoreceptor cell layer (Meyer et al., 2006). It is not apparent why the photoreceptors are relatively well preserved in the mouse model compared to humans with JNCL. Photoreceptor degeneration can occur secondary to degeneration of the inner retina, but this may require a relatively long time; mice may simply not live lone enough to exhibit the secondary effects of the disease.
The PLR is mediated by signal transmission from the retina to the mid-brain and then from the mid-brain back to the iris. Alterations in the PLR are therefore indicative of dysfunction along this pathway. We previously reported an exaggeration of the PLR in 4-month-old Cln3-/- mice (Wendt et al., 2005), suggesting an impairment in inhibitory signals during the early stages of the disease. By 12 months of age, the exaggeration of the PLR was no longer present, perhaps due to the loss of ganglion cells at this age. At 24 months of age, decreases in both the speed and the amplitudes of the PLRs were observed. The amplitude reductions likely reflect the substantial decrease in retinal light sensitivity at this age, although the relative decreases in PLR amplitudes were smaller than the decreases in ERG b-wave amplitudes. The altered kinetics of the PLR at 24 months, however, probably reflect alterations in signal transmission along the PLR neural pathway and/or alterations in iris sphincter muscle responses. Overall, alterations in the PLR appear to be good indicators of changes in neural function, particularly in the early stages of the disease before ERG changes occur.
In addition to vision loss, children with JNCL suffer progressive cognitive and motor declines. In early childhood, cognitive and motor functions are relatively normal, even after the onset of vision loss. As the disease progresses, however, these abilities decline until the patients become severely impaired and unable to communicate or control voluntary movements. Although the knockout mice analyzed in the present study did not exhibit such profound behavioral deficits, quantitative changes in behavioral parameters indicative of central nervous system impairment were observed. In a previous study, we reported that performance of 4-month-old Cln3-/- mice on a light-cued T-maze learning and memory task was significantly impaired relative to age-matched control animals (Wendt et al., 2005). The poorer performance of the mutant mice on this task prior to any measurable impairment of retinal function suggests an early onset of cognitive impairment in this mouse model. In the current study, 24 month old mutant mice required more trials than age-matched normal mice to find a hidden food reward without making any errors. However, this test appears to be less sensitive than the T-maze test, as no significant deficit in performance was observed in the Cln3-/- mice at 12 months of age. The results of the hole poke test used in the current study may possibly have been affected by impaired vision in the older mutant mice. In the hole poke test mice are placed in an enclosure with an array of 16 holes in the floor. Food rewards are placed in each hole but are accessible in only one of the holes. If an infrared light beam traversing any hole is interrupted by a mouse, the mouse is counted as having explored that hole. It is possible that the Cln3 -/- mice performed less well in this test not because they had not learned as quickly as the control mice which hole contained the accessible reward, but because they stumbled into the wrong hole because of poor vision or loss of coordination. Thus, although it is much more labor intensive, the T-maze test appears to be a more sensitive and perhaps more specific indicator of cognitive impairment in this model. In addition to deficits of learning and memory, spontaneous activity levels were altered in these Cln3-/- animals. The specific mechanisms that underlie the observed behavioral alterations are not known, but the behavioral tests provide global assessments of central nervous system function that are relevant to some of the most important symptoms of the human disorder. Preservation of normal behavior in the mouse model would be a good global indicator of efficacy for therapeutic interventions. As with retinal function, the fact that behavioral deficits in the mice do not become as profound as they do in human JNCL patients may be related to the relatively short lifespans of mice. As with retinal changes, it is the early cognitive changes that are important with respect to therapeutic interventions. On these grounds, the Cln3 knockout mouse is a useful model for the human disease.
Compared to human subjects with JNCL, the lifespans of the C57BL/6L Cln3-/- mice are less severely abbreviated as a consequence of the gene mutation. Most JNCL patients die after having survived only about one-third of the normal human lifespan, whereas in the knockout mice mean lifespan is reduced by only 19% and the maximum lifespan is reduced by only 30%. Longevities have not been determined for the other mouse Cln3 mutation models, but in Cln3Δex7/8 mice 20% of a cohort of the mutant animals had died by 52 weeks of age compared to none of a cohort of control animals (Cotman et al., 2002). The C57BL/6J Cln3-/- mice evaluated in the present study did not reach 20% mortality until approximately 90 weeks of age. This difference could indicate that longevity is more severely affected in the Cln3Δex7/8 model than in the C57BL/6J Cln3-/- mice, but this difference could also result from a longer lifespan of normal C57BL/6J mice than of the 129Sv/Ev/CD1 strain in which the Cln3Δex7/8 mutation was studied.
Overall, the C57BL/6J Cln3-/- mice exhibit many features of human JNCL, including a shortened lifespan, progressive storage body accumulation in the retina and brain, progressive visual impairment, neurodegeneration, and behavioral alterations. Most of the effects of the Cln3 mutation analyzed in mice in the current study do not progress to the level seen in late-stage human JNCL, perhaps due to the intrinsically shorter lifespan of mice. The mice do appear to provide a good model for the earlier stages of the disorder when therapeutic interventions are likely to be most effective. To model later stages of JNCL, it may be necessary to use a longer-lived species, such as the dog in which a number of forms of NCL have been reported (Jolly and Walkley, 1997; Katz et al., 2007).
Mutations in the CLN8 gene in humans are responsible for a form of NCL with similarities to JNCL (Ranta et al., 2004). In a previous study we found that intravitreal implantation of neuralized embryonic stem cells from genetically normal mice into mice with a mutation in the Cln8 gene resulted in a significant retardation in the mutation-related loss of photoreceptor cells from the retina (Meyer et al., 2006). This therapeutic benefit most likely resulted from the production of trophic factors by the implanted donor cells. Future studies are planned to determine whether similar preservation of retinal structure and function can be achieved by implantation of neuralized donor cells into the vitreous of young Cln3-/- mice. The quantitative markers of disease pathology that have been characterized in the Cln3-/-mouse model can be used as benchmarks for assessing efficacy of therapeutic interventions such as stem cell transplantation or gene therapy.
Acknowledgments
These studies were supported by grants NS044494, and NS045813 from the U.S. National Institutes of Health, the Batten Disease Support and Research Association, the University of Missouri Research Board, the University of Missouri PRIME fund, and Research to Prevent Blindness, Inc. The assistance of Margaret E. Umah with the behavioral studies, Keqing Zhang with the optic nerve axon analyses, and Cheryl Jensen and Melainia McClain of the University of Missouri Electron Microscopy Core Facility with electron microscopy are gratefully acknowledged.
Footnotes
Publisher's Disclaimer: This is a PDF file of an unedited manuscript that has been accepted for publication. As a service to our customers we are providing this early version of the manuscript. The manuscript will undergo copyediting, typesetting, and review of the resulting proof before it is published in its final citable form. Please note that during the production process errors may be discovered which could affect the content, and all legal disclaimers that apply to the journal pertain.
References
- Bensaoula T, Shibuya H, Katz ML, Smith JE, Johnson GS, John SK, Milam AH. Histopathologic and immunocytochemical analysis of the retina and ocular tissues in Batten disease. Ophthalmol. 2000;107:1746–1753. doi: 10.1016/s0161-6420(00)00264-5. [DOI] [PubMed] [Google Scholar]
- International Batten Disease Consortium Isolation of a novel gene underlying Batten disease, CLN3. Cell. 1995;82:949–957. doi: 10.1016/0092-8674(95)90274-0. [DOI] [PubMed] [Google Scholar]
- Cotman SL, Vrbanac V, Lebel LA, Lee RL, Johnson KA, Donahue LR, Teed AM, Antonellis K, Bronson RT, Lerner TJ, MacDonald ME. Cln3(Deltaex7/8) knock-in mice with the common JNCL mutation exhibit progressive neurologic disease that begins before birth. Human Molec. Genet. 2002;11:2709–2721. doi: 10.1093/hmg/11.22.2709. [DOI] [PubMed] [Google Scholar]
- Dyken PR. Reconsideration of the classification of the neuronal ceroid-lipofuscinoses. Am. J. Med. Genet. Suppl. 1988;5:69–84. doi: 10.1002/ajmg.1320310610. [DOI] [PubMed] [Google Scholar]
- Goebel HH, Fix JD, Zeman W. The fine structure of the retina in neuronal ceroid-lipofuscinosis. Am. J. Ophthalmol. 1974;77:25–39. doi: 10.1016/0002-9394(74)90601-1. [DOI] [PubMed] [Google Scholar]
- Goebel HH, Wisniewski KE. Current state of clinical and morphological features in human NCL. Brain Pathol. 2004;14:61–69. doi: 10.1111/j.1750-3639.2004.tb00499.x. [DOI] [PMC free article] [PubMed] [Google Scholar]
- Gupta P, Soyombo AA, Atasgband A, Wysniewski KE, Shelton JM, Richardson JA, Hammer RE, Hofmann SL. Disruption of PPT1 or PPT2 causes neuronal ceroid lipofuscinosis in knockout mice. Proc. Nat. Acad. Sci. USA. 2001;98:13566–13571. doi: 10.1073/pnas.251485198. [DOI] [PMC free article] [PubMed] [Google Scholar]
- Jolly RD, Walkley SU. Lysosomal storage diseases of animals: an essay in comparative pathology. Vet. Pathol. 1997;34:527–548. doi: 10.1177/030098589703400601. [DOI] [PubMed] [Google Scholar]
- Kaczmarski W, Wisniewski KE, Golabek A, Kaczmarski A, Kida E, Michalewski M. Studies of membrane association of CLN3 protein. Mol. Genet. Matabol. 1999;66:261–264. doi: 10.1006/mgme.1999.2833. [DOI] [PubMed] [Google Scholar]
- Katz ML, Johnson GS, Drögemüller C. Canine Neuronal Ceroid Lipofuscinoses. In: Mole SE, Lake BD, Goebel HH, editors. The Neuronal Ceroid Lipofuscinoses (Batten Disease) IOS Press; London: 2007. In press. [Google Scholar]
- Katz ML, Narfström K, Johnson GS, O’Brien DP. Assessment of retinal function and characterization of lysosomal storage body accumulation in the retinas and brains of Tibetan Terriers with ceroid-lipofuscinosis. Am. J. Vet. Res. 2005;66:67–76. doi: 10.2460/ajvr.2005.66.67. [DOI] [PubMed] [Google Scholar]
- Katz ML, Parker KR, Handelman GJ, Bramel TL, Dratz EA. Effects of antioxidant nutrient deficiency on the retina and retinal pigment epithelium of albino rats: a light and electron microscopic study. Exp. Eye Res. 1982;34:339–369. doi: 10.1016/0014-4835(82)90082-3. [DOI] [PubMed] [Google Scholar]
- Katz ML, Shibuya H, Liu P, Kaur S, Gao C, Johnson GS. A mouse gene knockout model for juvenile ceroid-lipofuscinosis. J. Neurosci. Res. 1999;57:551–556. [PubMed] [Google Scholar]
- Lei B, Tullis GE, Kirk MD, Zhang K, Katz ML. Ocular Phenotype in a Mouse Gene Knockout Model for Infantile Neuronal Ceroid-Lipofuscinosis. J. Neurosci. Res. 2006;84:1139–1149. doi: 10.1002/jnr.21008. [DOI] [PMC free article] [PubMed] [Google Scholar]
- Mao Q, Foster BJ, Xia H, Davidson BL. Membrane topology of CLN3, the protein underlying Batten disease. FEBS Letters. 2003;541:40–46. doi: 10.1016/s0014-5793(03)00284-9. [DOI] [PubMed] [Google Scholar]
- Meyer JS, Katz ML, Maruniak JA, Kirk MD. Embryonic stem cell derived neural precursors incorporate into the degenerating retina and enhance survival of host photoreceptors. Stem Cells. 2006;24:274–283. doi: 10.1634/stemcells.2005-0059. [DOI] [PMC free article] [PubMed] [Google Scholar]
- Mitchison HM, Bernard DJ, Greene ND, Cooper JD, Juniad MA, Pullarkat RK, deVos N, Bruening MH, Owens JW, Mobley WC, Gardiner RM, Lake BD, Taschner PE, Nussbaum RL. Targeted disruption of the Cln3 gene provides a mouse model for Batten disease. Neurobiol. Disease. 1999;6:321–334. doi: 10.1006/nbdi.1999.0267. [DOI] [PubMed] [Google Scholar]
- Mitchison HM, Taschner PE, Kremmidiotis G, Callen DF, Doggett NA, Lerner TJ, Janes RB, Wallace BA, Munroe PB, O’Rawe AM, Gardiner RM, Mole SE. Structure of the CLN3 gene and predicted structure, location and function of CLN3 protein. Neuroped. 1997;28:12–24. doi: 10.1055/s-2007-973656. [DOI] [PubMed] [Google Scholar]
- Phillips SN, Benedict JW, Weimer JM, Pearce DA. CLN3, the protein associated with batten disease: structure, function and localization. J. Neurosci. Res. 2005;79:573–583. doi: 10.1002/jnr.20367. [DOI] [PubMed] [Google Scholar]
- Pontikis CC, Cella CV, Parihar N, Lim MJ, Chakrabarti S, Mitchison HM, Mobley WC, Rezaie P, Pearce DA, Cooper JD. Late onset neurodegeneration in the Cln3-/- mouse model of juvenile neuronal ceroid lipofuscinosis is preceded by low level glial activation. Brain Res. 2004;1023:231–242. doi: 10.1016/j.brainres.2004.07.030. [DOI] [PubMed] [Google Scholar]
- Rakheja D, Narayan SB, Pastor JV, Bennett MJ. CLN3P, the Batten disease protein, localizes to membrane lipid rafts (detergent-resistant membranes) Biochem. Biophys. Res. Commun. 2004;317:988–991. doi: 10.1016/j.bbrc.2004.03.146. [DOI] [PubMed] [Google Scholar]
- Ranta S, Topcu M, Tegelberg S, Tan H, Ustubutun A, Saatci I, Dufke A, Enders H, Pohl K, Alembik Y, Mitchell WA, Mole SE, Lehesjoki AE. Variant late infantile neuronal ceroid lipofuscinosis in a subset of Turkish patients is allelic to Northern epilepsy. Hum. Mutation. 2004;23:300–305. doi: 10.1002/humu.20018. [DOI] [PubMed] [Google Scholar]
- Ranta S, Zhang Y, Ross B, Lonka L, Takkunen E, Messer A, Sharp J, Wheeler R, Kusumi K, Mole S, Liu W, Soares MB, Bonaldo MF, Hirvasniemi A, de la Chapelle A, Lehesjoki AE. The neuronal ceroid lipofuscinoses in human EPMR and mnd mutant mice are associated with mutations in CLN8. Nature Genet. 1999;23:233–236. doi: 10.1038/13868. [DOI] [PubMed] [Google Scholar]
- Sappington RM, Pearce DA, Calkins DJ. Optic nerve degeneration in a murine model of juvenile ceroid lipofuscinosis. Invest. Ophthalmol. Vis. Sci. 2003;44(9):3725–3731. doi: 10.1167/iovs.03-0039. [DOI] [PubMed] [Google Scholar]
- Seigel GM, Lotery A, Kummer A, Bernard DJ, Greene ND, Turmaine M, Derksen T, Nussbaum RL, Davidson B, Wagner J, Mitchison HM. Retinal pathology and function in a Cln3 knockout mouse model of juvenile Neuronal Ceroid Lipofuscinosis (batten disease) Mol. Cell. Neurosci. 2002;19:515–527. doi: 10.1006/mcne.2001.1099. [DOI] [PubMed] [Google Scholar]
- Siintola E, Partanen S, Stromme P, Haapanen A, Haltia M, Maehlen J, Lehesjoki AE, Tyynela J. Cathepsin D deficiency underlies congenital human neuronal ceroid-lipofuscinosis. Brain. 2006;129:1438–1445. doi: 10.1093/brain/awl107. [DOI] [PubMed] [Google Scholar]
- Siintola E, Topcu M, Aula N, Lohi H, Minassian BA, Paterson AD, Liu X-Q, Wilson C, Lahtinen U, Anttonen A-K, Lehesjoki A-E. The novel neuronal ceroid lipofuscinosis gene MFSD8 encodes a putative lysosomal transporter. Am. J. Human Genet. 2007;81:136–146. doi: 10.1086/518902. [DOI] [PMC free article] [PubMed] [Google Scholar]
- Steinfeld R, Reinhardt K, Schreiber K, Hillebrand M, Kraetzner R, Bruck W, Saftig P, Gartner J. Cathepsin D deficiency is associated with a human neurodegenerative disorder. Am. J. Human Genet. 2006;78:988–998. doi: 10.1086/504159. [DOI] [PMC free article] [PubMed] [Google Scholar]
- Traboulsi EI, Green WR, Luckenbach MW, de la Cruz ZC. Neuronal ceroid lipofuscinosis: ocular histopathologic and electron microscopic studies in the late infantile, juvenile and adult forms. Graefe’s Arch. Clin. Exp. Ophthalmol. 1987;225:391–402. doi: 10.1007/BF02334164. [DOI] [PubMed] [Google Scholar]
- Weimer JM, Custer AW, Benedict JW, Alexander NA, Kingsley E, Federoff HJ, Cooper JDDA,P. Visual deficits in a mouse model of Batten disease are the result of optic nerve degeneration and loss of dorsal lateral geniculate thalamic neurons. Neurobiol. Disease. 2006;22:284–293. doi: 10.1016/j.nbd.2005.11.008. [DOI] [PMC free article] [PubMed] [Google Scholar]
- Weleber RG. The dystrophic retina in mutlisystem disorders: the electroretinogram in neuronal ceroid lipofuscinoses. Eye. 1998;12:580–590. doi: 10.1038/eye.1998.148. [DOI] [PubMed] [Google Scholar]
- Wendt KD, Lei B, Schachtman TR,GE,T, Ibe ME, Katz ML. Behavioral assessment of mouse models of ceroid-lipofuscinosis using a Light-Cued T-Maze. Behav. Brain Res. 2005;161:173–180. doi: 10.1016/j.bbr.2005.02.024. [DOI] [PubMed] [Google Scholar]
- Wheeler RB, Sharp JD, Schultz RA, Joslin JM, Williams RE, Mole SE. The gene mutated in variant late-infantile ceroid lipofuscinosis (CLN6) and in nclf mice encodes a novel predicted transmembrane protein. Am. J. Human Genet. 2002;70:537–542. doi: 10.1086/338708. [DOI] [PMC free article] [PubMed] [Google Scholar]
- Wisniewski K, Zhong N. Batten Disease: Diagnosis, Treatment, and Research. Academic Press; NY: 2001. [Google Scholar]
- Wisniewski KE, Kida E, Golabek AA, Kaczmarski W, Zhong N. Neuronal ceroid lipofuscinoses: classification and diagnosis. Adv. Genet. 2001;45:1–34. doi: 10.1016/s0065-2660(01)45002-4. [DOI] [PubMed] [Google Scholar]


