Abstract
Electron transfer in complex I from Escherichia coli was investigated by an ultrafast freeze-quench approach. The reaction of complex I with NADH was stopped in the time domain from 90 μs to 8 ms and analyzed by electron paramagnetic resonance (EPR) spectroscopy at low temperatures. The data show that after binding of the first molecule of NADH, two electrons move via the FMN cofactor to the iron–sulfur (Fe/S) centers N1a and N2 with an apparent time constant of ≈90 μs, implying that these two centers should have the highest redox potential in the enzyme. The rate of reduction of center N2 (the last center in the electron transfer sequence) is close to that predicted by electron transfer theory, which argues for the absence of coupled proton transfer or conformational changes during electron transfer from FMN to N2. After fast reduction of N1a and N2, we observe a slow, ≈1-ms component of reduction of other Fe/S clusters. Because all elementary electron transfer rates between clusters are several orders of magnitude higher than this observed rate, we conclude that the millisecond component is limited by a single process corresponding to dissociation of the oxidized NAD+ molecule from its binding site, where it prevents entry of the next NADH molecule. Despite the presence of approximately one ubiquinone per enzyme molecule, no transient semiquinone formation was observed, which has mechanistic implications, suggesting a high thermodynamic barrier for ubiquinone reduction to the semiquinone radical. Possible consequences of these findings for the proton translocation mechanism are discussed.
Keywords: EPR spectroscopy, Escherichia coli, freeze-quench, iron–sulfur clusters, reactive oxygen species
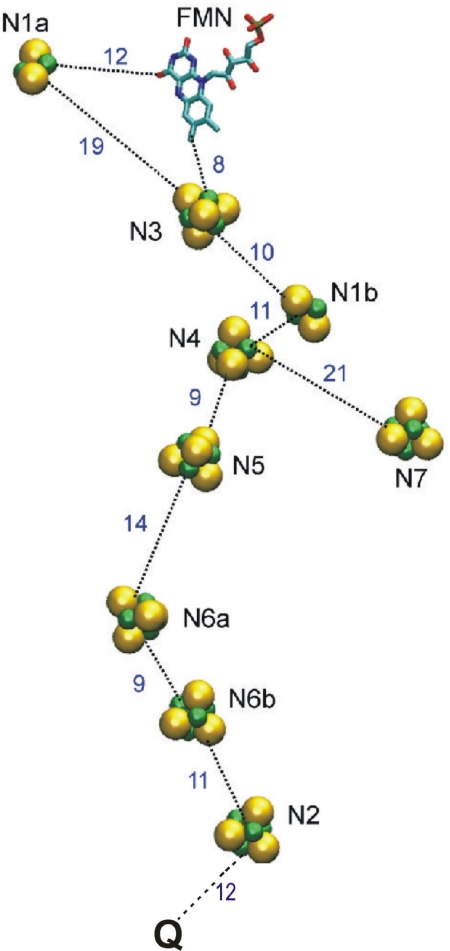
Complex I is one of the three key enzymes of the mitochondrial respiratory chain. The simpler prokaryotic version contains the same cofactors and performs the same major function as its eukaryotic counterpart (1). Complex I couples electron transfer from NADH to ubiquinone to translocation of 2 H+/e− across the membrane (2). It is a true redox-linked proton pump, as is complex IV (3), but is distinct from complex III, which generates the electrochemical proton gradient across the membrane by a redox loop mechanism (4). Complex I consists of membrane and extramembrane domains (1). A recent structure of the latter (5) established the relative positions of the NADH-oxidizing cofactor FMN and several iron–sulfur (Fe/S) clusters that provide an electron transfer pathway to the electron acceptor, ubiquinone, in the membrane domain (Fig. 1). There is no high-resolution structure of the membrane domain, which must contain the machinery of proton translocation. Electron paramagnetic resonance (EPR) spectroscopy of complex I reveals individual signals of two binuclear and several tetranuclear Fe/S clusters (6). Equilibrium redox titrations have shown that the tetranuclear cluster N2, the last in the chain (Fig. 1), has the highest midpoint redox potential (Em), approximately −150 mV vs. NHE. One of the binuclear clusters, N1a, has been reported to have a much lower Em value (−380 mV), the others being almost equipotential (approximately −240 mV, ref. 6; but see below). Center N2 is widely thought to donate electrons directly to ubiquinone. The other Fe/S clusters seem to constitute an “electron wire” from FMN to N2, with the exception of N1a, which curiously appears to be on a “side path,” and center N7, which is located far from the electron wire and does not participate in electron transfer (Fig. 1) (7, 8).
Fig. 1.
Redox centers of complex I. The figure is based on the structure of complex I from Thermus thermophilus (5) and drawn using the program VMD (27). Edge-to-edge distances between the redox centers are shown in ångströms (5), except for the distance between cluster N2 and bound ubiquinone (Q), which is center-to-center (16).
Several models of complex I function have been proposed (reviewed in ref. 1), but they have been difficult to assess because of lack of structural information, and because no real-time dynamics has been available. Complex I has not been accessible to time-resolved methodology because the catalytic reaction (kcat ≈ 500 s−1) is too fast to be captured by conventional techniques. Moreover, the redox states of the Fe/S clusters can be reliably determined only by EPR spectroscopy at low temperatures (6). Here, we have resolved the electron transfer kinetics upon reduction of complex I from Escherichia coli by NADH using an ultrafast mixer that allows freezing of the sample in the time range from tens of microseconds to tens of milliseconds. EPR spectra of trapped samples were analyzed to follow the redox changes of individual redox centers, which allowed us to follow the two electrons delivered by NADH in real time.
Results
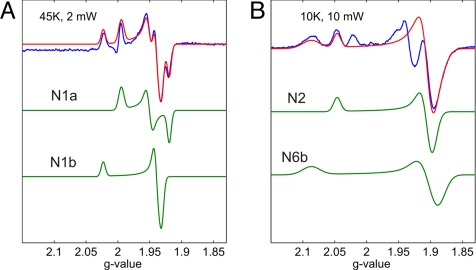
To resolve the electron transfer kinetics in complex I, its reaction with NADH must not be limiting. We determined the bimolecular rate constant to be 8.3 × 10⁷ M−1·s−1 (see Materials and Methods), which in our conditions yields NADH binding in ≈0.2 μs, much faster than our time resolution. A sample of NADH-reduced enzyme then was used to obtain individual signals of Fe/S clusters. The EPR signals of the binuclear clusters N1a and N1b with rhombic and axial symmetry, respectively, were simulated with parameters close to those reported (9), and their sum fits reasonably well with the experimental data (Fig. 2A). It should be noted that cluster N1a of the E. coli complex I was earlier named N1c (9) and was reported to have a much higher redox potential than cluster N1a from the bovine enzyme (6, 10), as confirmed here (see below). The spectrum of the fast-relaxing tetranuclear cluster N2 (Fig. 2B) with axial symmetry was simulated with parameters close to those published (10). The spectrum of the N6b center was also modeled as an axial signal. The signals at gz = 2.087 and gxy = 1.88, here attributed to center N6b, were previously thought to arise from center N4. However, the observations of this type of signal in the isolated connecting fragment containing clusters N2, N6a, and N6b of complex I from E. coli (11), and in the isolated subunit NQO9 from Pseudomonas denitrificans (12) (corresponding to NuoI in E. coli containing clusters N6a and N6b) support our assignment. This assignment is further supported by our recent mutant data (13), as well as by the absence of a g = 2.09 signal in the isolated NuoG subunit containing the N4 cluster (14). The difference between the sum of these simulated signals and the experimental spectrum (Fig. 2B) arises from other clusters because it has different power dependence and is partially saturated under the present conditions.
Fig. 2.
Fitting the EPR spectra of complex I reduced with NADH with simulated signals of individual spins. The temperature and the microwave power incident to the cavity are indicated. (A) Blue, experimental spectrum at 45 K; green, simulated spectra of clusters N1a (gxyz = 1.921, 1.952, 1.996) and N1b (gxyz = 1.930, 1.938, 2.024); red, the sum of the simulated spectra. (B) Blue, experimental spectrum at 10 K; green, simulated spectra of centers N2 (gxyz = 1.900, 1.901, 2.045) and N6b (gxyz = 1.889, 1.905, 2.087); red, sum of simulated spectra of centers N2 and N6b.
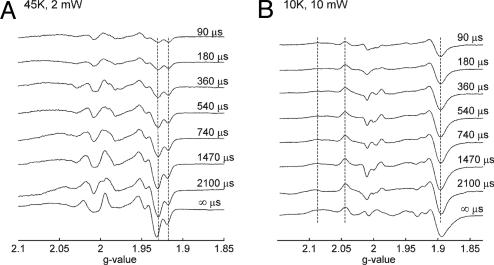
EPR spectra were collected from samples frozen at times from 90 μs to 8 ms after mixing the enzyme with NADH (Fig. 3). At 45 K, the signals at g = 1.92 and g = 1.93 are known to arise from centers N1a and N1b (Fig. 3A, dashed lines; cf. Fig. 2). In contrast, at 10 K and high-microwave power (Fig. 3B), the signals of the binuclear and slow-relaxing tetranuclear centers are power saturated and do not significantly contribute to the spectrum. Hence, we focus here on the fast-relaxing 4Fe-4S clusters N2 and N6b, which are unsaturated under these conditions.
Fig. 3.
Kinetics of complex I reduction by NADH followed by EPR spectroscopy. Complex I was mixed with NADH and frozen at the indicated times. The temperature and the microwave power incident to the cavity are indicated. (A) Kinetics of redox changes of 2Fe-2S centers. (B) Kinetics of redox changes of fast-relaxing 4Fe-4S centers.
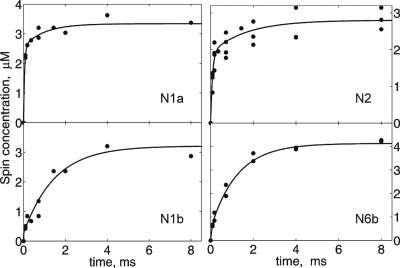
The kinetic spectra were fitted by the simulated signals, and their amplitudes were plotted against time in Fig. 4. The major part of N1a undergoes very fast reduction with a time constant (τ) of ≈90 μs. In contrast, reduction of N1b was quick only in a small fraction, but the majority was reduced much more slowly (τ ≈ 1.2 ms). A similar behavior was observed for the two 4Fe-4S clusters. The main fraction of N2 was reduced quickly (τ ≈ 90 μs), not significantly different from the rate of N1a reduction; a small part of N2 appeared to be reduced more slowly (1–2 ms). In contrast, the major part of center N6b was reduced with the slow rate (τ ≈ 1.2 ms).
Fig. 4.
Kinetics of redox changes of clusters N1a, N1b, N2, and N6b after mixing of complex I with NADH. The contribution of individual spin signals was plotted against time and fitted with exponential curves.
Discussion
NADH is a strict two-electron donor. The first event after NADH binding is hydride transfer (two electrons and one H+) from NADH to FMN. None of the products of this reaction has an EPR signal and therefore could not be discerned experimentally, but because the next resolved reaction has a time constant of ≈90 μs, the prior hydride transfer occurs at least at that rate, or faster.
Our results would be difficult to interpret unequivocally without the crystal structure (5). On the basis of this structure, the fully reduced FMN may initially donate the first electron to either of two Fe/S clusters, namely, N1a or N3, because these are closest to FMN (Fig. 1). The significantly shorter distance to cluster N3 makes it much more probable that the first electron is initially transferred here, leaving the flavin transiently as flavosemiquinone. According to electron transfer theory (15), this should happen in nanoseconds, unless it is slowed down by being coupled to proton transfer or other events. Because the clusters in the array following N3, namely, N1b, N4, and N5, all have short distances between them (Fig. 1) and similar redox potentials (1, 6), the first electron is expected to be equilibrated between all of these on a time scale of less than a microsecond, which is beyond our time resolution.
Reduction of center N1a is as fast as reduction of N2 (Fig. 4). Yet, we conclude that N1a reduction is due to the second electron from FMN because of the longer distance compared with center N3. Pure electron tunneling from FMN to center N1a across the 12-Å distance is expected to occur in less than a microsecond. No EPR signal from the FMN radical is observed at the earliest time point. Hence, we conclude that either hydride transfer from NADH to FMN or oxidation of reduced FMN limits the rate of the entire observed 90-μs process. Therefore, the fastest observed real-time electron transfer is not limited by pure electron tunneling (but see below).
N2 is the last Fe/S cluster in the chain (Fig. 1) and has the highest redox potential (1, 6). Therefore, this should be the destination of the first electron in the case that ubiquinone does not participate in the initial two-electron reaction, as observed. As noted above, the observed fast electron transfer is limited by hydride transfer or by delivery of the first electron from reduced flavin into the Fe/S chain. Therefore, the time constant for electron transfer across the entire Fe/S array to center N2 is 90 μs or faster. Because the observed rate of N2 reduction is very close to the rate expected from electron tunneling theory across the entire span of Fe/S centers (τ ≈ 100 μs; ref. 15), this electron transfer is unlikely to be coupled to other reactions, such as proton transfers or conformational changes.
On the microseconds time scale, we thus mainly observe reduction of two clusters, N1a and N2, which account for the two electrons delivered by the first NADH molecule after its encounter with complex I. Further reduction can proceed only after dissociation of the product NAD+ from the enzyme and binding of the next NADH molecule. We observe a slow (≈1–2 ms) component of reduction of the two other measured Fe/S clusters. Because all elementary rate constants of electron transfer between the clusters are several orders of magnitude higher than this observed rate, we conclude that reduction of the remaining clusters is limited by a single process, namely, the dissociation of the oxidized NAD+ molecule from its binding site, where it prevents entry of the next NADH molecule.
One ubiquinone molecule is bound per complex I in our preparation (see Materials and Methods). We observe full reduction of the N2 cluster, the immediate electron donor to ubiquinone, but no ubisemiquinone radical was detected. Such a radical has, in fact, generally been found only at high membrane potential in vesicular complex I systems (6, 16), suggesting that it is otherwise unstable, and therefore that the Em for the Q/Q•− couple is very low (see below). Our observation supports this view, which may have important implications for the proton translocation mechanism. The ubiquinone radical has a characteristic narrow and very well detectable EPR signal (6, 16). Assuming that the stoichiometrically bound ubiquinone of our preparation occupies the ubiquinone reduction site, our failure to detect ubisemiquinone despite full reduction of center N2 means that the population of the radical must be less than ≈1–2% of the enzyme concentration. Such a low population of semiquinone in equilibrium with reduced center N2 would require that the Em of the Q/Q•− couple be at least 100 mV more negative than for center N2 (i.e., less than −300 mV). The latter potential is close to the Em of the NAD+/NADH couple, which would mean that the transfer of the first electron from NADH to ubiquinone is not associated with any drop of energy. It appears that it is the transfer of the second electron into ubiquinone that occurs across a large potential drop and that drives translocation of all four protons across the membrane (cf. refs. 1 and 15).
The second implication of our findings concerns the role of cluster N1a. As predicted (5), we find that this center accepts one of the two electrons from reduced flavin, which is in accord with the high Em of this center in complex I from E. coli (9, 10). As discussed above, the likely electron donor is the flavosemiquinone, which supports the idea that N1a may function as a quencher of radical formation that minimizes or modulates the reactivity with oxygen. Messner and Imlay (17) suggested that it is the reduced flavin that predominantly reacts with O2 in flavoproteins, as also concluded by Kussmaul and Hirst (18) for complex I, where the reactive oxygen species formed is predominantly superoxide. Therefore, our finding is consistent with the proposal that an Fe/S center near the flavin captures the electron from the FMN radical before it can react with nascent superoxide to form hydrogen peroxide (17). This may be advantageous, because locally formed peroxide may otherwise be reduced to the highly reactive OH radical by the low-potential Fe/S centers. In complex I from mitochondria, the Em of cluster N1a is reported to be significantly lower than in E. coli (6, 10). The question arises as to why the conserved center N1a appears to have such different properties in different species, especially if it has the important function suggested here. It is possible that the Em of cluster N1a in mitochondrial complex I is higher during dynamic functioning than during static redox titrations—for example, due to electrostatic interactions between redox sites.
Finally, we note that the observed bifurcation of electron transfer from reduced FMN to the main Fe/S chain and to N1a might ensure a long (millisecond) lifetime of a state where center N2 is reduced but where there is no second electron available to complete ubiquinone reduction. Such a state might be required to initiate a conformational change intrinsic to the subsequent proton pump mechanism coupled to ubiquinone reduction in the membrane domain (1, 20).
Materials and Methods
Purification of Complex I.
The E. coli MWC215 (Δnhd) (21) strain was used. Bacteria were grown in LB medium at 37°C and harvested at the second half of the exponential growth phase. Membranes were obtained by passing the cells through an APV Gaulin homogenizer. Complex I was purified by two chromatography steps, as described in ref. 13. Purified complex I was concentrated and activated by phospholipids, as described in ref. 22. Finally, the sample of 1.1 ml contained 20–24 mg/ml complex I in the buffer consisting of 20 mg/ml azolectin, 30 mM Mes/NaOH, 70 mM Hepes/KOH (pH 7.5), 70 mM NaCl, 0.19% sodium cholate, 0.1% n-dodecyl β-d-maltoside, 7% sucrose, and 1.7% glycerol.
Determination of the Second-Order Rate Constant of NADH Oxidation.
NADH:hexaammineruthenium (HAR) oxidoreductase activity of complex I was measured at 30°C in a buffer containing 25 mM Hepes/BTP (1,3-bis[tris(hydroxymethyl)methylamino]propane) (pH 7.5), 350 μM HAR, and 3.5 mM KCN with constant stirring using a USB2000 ultraviolet-vis spectrophotometer (Ocean Optics) and by following NADH absorption at 340 nm (ε = 6.2 mM−1·cm−1). The reaction was started by addition of the enzyme. The range of NADH concentrations was 1–2,000 μM. The bimolecular rate constant was defined as kcat/KM. We obtained kcat = 600 s−1 and KM = 7.2 μM for purified complex I. The obtained second-order rate constant was 8.3 × 10⁷ M−1·s−1.
Ubiquinone Determination.
The ubiquinone content of the preparations of purified complex I was determined by n-hexane extraction and measurements of extracted ubiquinone redox spectra in ethanol using sodium borohydride (εox − εred)275 = 12.25 mM−1·cm−1, as described in ref. 23. The amount of ubiquinone was found to be 1.6 nmol/mg protein, which closely corresponds to one ubiquinone per FMN.
EPR Spectroscopy.
X-band (9.4 GHz) EPR measurements were performed with a Bruker EMX EPR spectrometer equipped with an Oxford Instruments ESR900 helium flow cryostat with an ITC4 temperature controller. The field modulation frequency was 100 kHz, and the modulation amplitude was 1.27 mT. The microwave power incident to the cavity is indicated in the figures. The spectra shown are normalized for temperature, gain, and microwave power, and are corrected for baseline. The spectral simulation was performed using the program WinEPR SimFonia [Version 1.26 (beta); Bruker BioSpin]. The simulated spectra were adjusted to 1 μM spin concentration by double integration and normalization using a Cu-standard. This simulated spectrum was used to determine the amount of spin at any time point of the reaction. The complex I preparation was contaminated with an Fe/S protein of succinate dehydrogenase, which cannot be reduced by NADH without mediators on the time scale of our experiment. Therefore, in the EPR spectra of NADH-reduced complex I, the signal of the oxidized (3Fe-4S) cluster, S3, was observed at 10 K. This signal, obtained directly from the oxidized sample, was subtracted from the final kinetic spectra.
Ultrafast Freeze-Quench Apparatus.
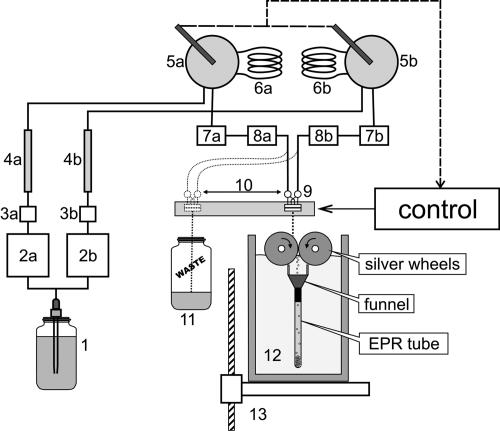
The freeze-quenching device was built in our laboratory and based on principles described in refs. 24 and 25. It consists of two Waters 501 high-performance liquid chromatography (HPLC) pumps (Fig. 5), two mechanically coupled Rheodyne 7125 sample injectors with 100-μl sample loops, and a tangential four-jet mixer. To decrease pressure pulsation, a special suppressor and an HPLC reverse-phase column were included into the flow path after the HPLC pumps. Sequential inline filters protect the mixer orifice from clogging. Flow path and sample loops were made of 1/16-inch-outer-diameter and 0.01-inch-inner-diameter PEEK or stainless-steel tubes. To decrease sample dilution, the flow path after the sample injectors was as short as possible and was built of PEEK tubes with the same dimensions.
Fig. 5.
Scheme of the freeze-quench apparatus. 1, Vessel with buffer; 2a and 2b, Waters 501 HPLC solvent delivery pumps; 3a and 3b, pressure dumpers; 4a and 4b, reverse-phase HPLC columns; 5a and 5b, Rheodyne 7125 sample injection valves; 6a and 6b, sample loops; 7a and 7b, and 8a and 8b, 5-μm and 0.2-μm inline solvent filters; 9, tangential micromixer; 10, mixer head moving system; 11, waste collection vessel; 12, Dewar with liquid nitrogen; 13, jet length adjusting table. Before the experiment, buffer was degassed on a vacuum line and saturated with argon. Two HPLC pumps (2a and 2b), installed in parallel, are used to deliver the buffer to the micromixer (9). In the purging mode, buffer bypasses the sample loops (6a and 6b), and the free-flowing jet directs to the waste collection vessel (11). In the operational mode, sample loops are included into the flowing path by the sample injectors' valves (5a and 5b), and after a delay, the mixer head (9) moves to the work position and the jet of the mixed sample solution is directed to the cold silver cylinders. The rotating cylinders work as a mill, and the cold sample powder is collected into an EPR tube.
The tangential four-jet mixer was built based on the design described in ref. 25. The mixer body was made of a stainless-steel cylinder with a 6-mm outer diameter. From one end of the cylinder, four 1/16-inch stainless-steel tubes with inner diameters of 0.01 inch were soldered into the mixer body to create channels arranged along the cylinder axis. On the opposite end of the cylinder, cross-like channels were made by electrochemical etching. The width of the channel was ≈100 μm, and the depth ≈50 μm. To form a mixing chamber the channels were covered by an inlay with an orifice. The inlay was made of a 50-μm stainless-steel sheet, and the orifice was produced by electrochemical micromachining technology (26). The orifice diameter was ≈25 μm. Mixer body and inlay were placed into a brass holder and fastened by screws.
The characteristic feature of the mixing device is a continuous-flow modus operandi. In purging mode, the buffer bypassing the sample loops comes through the mixer, and its free flowing jet is directed to the waste container. Switching mechanically coupled sample injector valves triggers the operational mode. At this moment, the sample loops filled with assay solutions are inserted into the flow path, and a microcontroller-based timing system generates a time delay necessary for assay solutions to approach the mixer head. Then, the mixer head shifts to the “work” position, where the jet of the mixed solutions is directed to liquid-nitrogen-cooled rotating cylinders produced of pure (99.99%) silver. At this point, the system delivers a volume equal to the volume of both sample loops and then returns the mixing head back to the “waste” position. At “work” position, the mixer head does constant longitudinal moves to direct a jet to the ice-free zone of the rotating cylinders. Timing delays depend on tubing length and solvent flow rate, and could be adjusted with millisecond precision.
The freeze-quenching device was manufactured similarly to that previously described (24). Two silver cylinders with 4-cm diameters were arranged in a side-by-side fashion. The drive wheel, attached to a motor, drives the slave wheel through frictional contact. As a result, the two silver wheels rotate in opposite directions at the same speed. The bottom halves of the two wheels are immersed in a liquid nitrogen bath to maintain low temperature. The mixed-solution jet is directed to the drive wheel and instantaneously freezes on the surface of the wheel, and it is ground into a fine powder as it is carried down between the wheels. The powder is collected into an EPR tube through a collecting funnel placed in liquid nitrogen directly below the wheels. The rectangular funnel is equipped with two scrapers. In operational mode, the scrapers contact the wheel's surface and increase the efficiency of powder collecting. An EPR tube was attached to the funnel by heat shrink. A moving table allows adjustment of the length of the jet.
After collecting the powder, the wheels were removed and the funnel with the connected EPR tube (5-mm diameter) was slowly lifted up to evaporate liquid nitrogen. During this procedure the powder was completely packed in the EPR tube (packing factor of 0.5–0.6). Then, the funnel was removed and the EPR tube was transferred to a low-temperature chamber, where it was incubated for 15 min at 100 K to remove traces of liquid oxygen.
A model system of azide binding to metmyoglobin from horse heart was used for calibration of the time scale (24, 25). The rate constants for this reaction obtained on the basis of the timing by jet length were found to be close to those calculated from the known parameters of the reaction.
To follow the reduction of complex I, the enzyme at 20–24 mg/ml was mixed with 200 mM NADH at a ratio of 1:1. The sample volume was 200 μl.
ACKNOWLEDGMENTS.
This work was supported by Biocentrum Helsinki, the Sigrid Jusélius Foundation, and the Academy of Finland.
Footnotes
The authors declare no conflict of interest.
This article is a PNAS Direct Submission.
References
- 1.Brandt U. Energy converting NADH: Quinone oxidoreductase (complex I). Annu Rev Biochem. 2006;75:69–92. doi: 10.1146/annurev.biochem.75.103004.142539. [DOI] [PubMed] [Google Scholar]
- 2.Wikström M. Two protons are pumped from the mitochondrial matrix per electron transferred between NADH and ubiquinone. FEBS Lett. 1984;169:300–304. doi: 10.1016/0014-5793(84)80338-5. [DOI] [PubMed] [Google Scholar]
- 3.Wikström MKF. Proton pump coupled to cytochrome-c oxidase in mitochondria. Nature. 1977;266:271–273. doi: 10.1038/266271a0. [DOI] [PubMed] [Google Scholar]
- 4.Mitchell P. The protonmotive Q cycle: A general formulation. FEBS Lett. 1975;59:137–139. doi: 10.1016/0014-5793(75)80359-0. [DOI] [PubMed] [Google Scholar]
- 5.Sazanov LA, Hinchliffe P. Structure of the hydrophilic domain of respiratory complex I from Thermus thermophilus. Science. 2006;311:1430–1436. doi: 10.1126/science.1123809. [DOI] [PubMed] [Google Scholar]
- 6.Ohnishi T. Iron-sulfur clusters/semiquinones in complex I. Biochim Biophys Acta. 1998;1364:186–206. doi: 10.1016/s0005-2728(98)00027-9. [DOI] [PubMed] [Google Scholar]
- 7.Pohl T, et al. Iron-sulfur cluster N7 of the NADH:ubiquinone oxidoreductase (complex I) is essential for stability but not involved in electron transfer. Biochemistry. 2007;46:6588–6596. doi: 10.1021/bi700371c. [DOI] [PubMed] [Google Scholar]
- 8.Nakamaru-Ogiso E, Yano T, Yagi T, Ohnishi T. Characterization of the iron-sulfur cluster N7 (N1c) in the subunit NuoG of the proton-translocating NADH-quinone oxidoreductase from Escherichia coli. J Biol Chem. 2005;280:301–307. doi: 10.1074/jbc.M410377200. [DOI] [PubMed] [Google Scholar]
- 9.Uhlmann M, Friedrich T. EPR signals assigned to Fe/S cluster N1c of the Escherichia coli NADH:ubiquinone oxidoreductase (complex I) derive from cluster N1a. Biochemistry. 2005;44:1653–1658. doi: 10.1021/bi048136n. [DOI] [PubMed] [Google Scholar]
- 10.Friedrich T. The NADH:ubiquinone oxidoreductase (complex I) from Escherichia coli. Biochim Biophys Acta. 1998;1364:134–146. doi: 10.1016/s0005-2728(98)00024-3. [DOI] [PubMed] [Google Scholar]
- 11.Rasmussen T, et al. Identification of two tetranuclear FeS clusters on the ferredoxin-type subunit of NADH: ubiquinone oxidoreductase (complex I). Biochemistry. 2001;40:6124–6131. doi: 10.1021/bi0026977. [DOI] [PubMed] [Google Scholar]
- 12.Yano T, Magnitsky S, Sled VD, Ohnishi T, Yagi T. Characterization of the putative 2x[4Fe-4S]-binding NQO9 subunit of the proton-translocating NADH-quinone oxidoreductase (NDH-1) of Paracoccus denitrificans. Expression, reconstitution, and EPR characterization. J Biol Chem. 1999;274:28598–28605. doi: 10.1074/jbc.274.40.28598. [DOI] [PubMed] [Google Scholar]
- 13.Belevich G, Euro L, Wikström M, Verkhovskaya M. Role of the conserved arginine 274 and histidine 224 and 228 residues in the NuoCD subunit of complex I from Escherichia coli. Biochemistry. 2007;46:526–533. doi: 10.1021/bi062062t. [DOI] [PubMed] [Google Scholar]
- 14.Yakovlev G, Reda T, Hirst J. Reevaluating the relationship between EPR spectra and enzyme structure for the iron sulfur clusters in NADH:quinone oxidoreductase. Proc Natl Acad Sci USA. 2007;104:12720–12725. doi: 10.1073/pnas.0705593104. [DOI] [PMC free article] [PubMed] [Google Scholar]
- 15.Moser CC, Farid TA, Chobot SE, Dutton PL. Electron tunneling chains of mitochondria. Biochim Biophys Acta. 2006;1757:1096–1109. doi: 10.1016/j.bbabio.2006.04.015. [DOI] [PubMed] [Google Scholar]
- 16.Yano T, Dunham WR, Ohnishi T. Characterization of the ΔμH+-sensitive ubisemiquinone species (SQNf) and the interaction with cluster N2: New insight into the energy-coupled electron transfer in complex I. Biochemistry. 2005;44:1744–1754. doi: 10.1021/bi048132i. [DOI] [PubMed] [Google Scholar]
- 17.Messner KR, Imlay JA. Mechanism of superoxide and hydrogen peroxide formation by fumarate reductase, succinate dehydrogenase, and aspartate oxidase. J Biol Chem. 2002;277:42563–42571. doi: 10.1074/jbc.M204958200. [DOI] [PubMed] [Google Scholar]
- 18.Kussmaul L, Hirst J. The mechanism of superoxide production by NADH:ubiquinone oxidoreductase (complex I) from bovine heart mitochondria. Proc Natl Acad Sci USA. 2006;103:7607–7612. doi: 10.1073/pnas.0510977103. [DOI] [PMC free article] [PubMed] [Google Scholar]
- 20.Ohnishi T, Salerno JC. Conformation-driven and semiquinone-gated proton-pump mechanism in the NADH-ubiquinone oxidoreductase (complex I). FEBS Lett. 2005;579:4555–4561. doi: 10.1016/j.febslet.2005.06.086. [DOI] [PubMed] [Google Scholar]
- 21.Calhoun MW, Gennis RB. Demonstration of separate genetic-loci encoding distinct membrane-bound respiratory NADH dehydrogenases in Escherichia coli. J Bacteriol. 1993;175:3013–3019. doi: 10.1128/jb.175.10.3013-3019.1993. [DOI] [PMC free article] [PubMed] [Google Scholar]
- 22.Sinegina L, Wikström M, Verkhovsky MI, Verkhovskaya ML. Activation of isolated NADH:ubiquinone reductase I (complex I) from Escherichia coli by detergent and phospholipids. Recovery of ubiquinone reductase activity and changes in EPR signals of iron-sulfur clusters. Biochemistry. 2005;44:8500–8506. doi: 10.1021/bi050134v. [DOI] [PubMed] [Google Scholar]
- 23.Redfearn ER. Isolation and determination of ubiquinone. Methods Enzymol. 1967;10:381–384. [Google Scholar]
- 24.Lin Y, Gerfen GJ, Rousseau DL, Yeh SR. Ultrafast microfluidic mixer and freeze-quenching device. Anal Chem. 2003;75:5381–5386. doi: 10.1021/ac0346205. [DOI] [PubMed] [Google Scholar]
- 25.Cherepanov AV, de Vries S. Microsecond freeze-hyperquenching: development of a new ultrafast micro-mixing and sampling technology and application to enzyme catalysis. Biochim Biophys Acta. 2004;1656:1–31. doi: 10.1016/j.bbabio.2004.02.006. [DOI] [PubMed] [Google Scholar]
- 26.Schuster R, Kirchner V, Allongue P, Ertl G. Electrochemical micromachining. Science. 2000;289:98–101. doi: 10.1126/science.289.5476.98. [DOI] [PubMed] [Google Scholar]
- 27.Humphrey W, Dalke A, Schulten K. VMD: Visual molecular dynamics. J Mol Graphics. 1996;14:33–38. doi: 10.1016/0263-7855(96)00018-5. [DOI] [PubMed] [Google Scholar]


